ORGANOHALOGEN COMPOUNDS
Vol. 59 (2002)
ARE TARGET DIOXIN LEVELS IN ANIMAL FEEDINGSTUFFS
ACHIEVABLE FOR LABORATORIES IN TERMS OF ANALYTICAL
REQUIREMENTS? RESULTS OF AN INTERLABORATORY STUDY
Gauthier Eppe and Edwin de Pauw
Mass Spectrometry Laboratory – C.A.R.T., University of Liege, B6c Sart-Tilman, B-4000 Liege, Belgium
Introduction
The recent cases of contamination of feedingstuffs (the ‘ball clay’ in USA in 1997, the citrus pulp pellets from Brazil in 1998, the fat from Belgium in 1999 and recently the choline chloride from Spain in 2000) induced the European Commission to establish maximum levels for dioxin and dioxin-like PCBs in feedingstuffs1,2. These maximum levels are accompanied by measures stimulating the setting
of action and target levels included in the global strategy of reduction of dioxins. The commission emphasis also monitoring programs in the food and feed chain at European level. More recently, directives SANCO/3432/01 and SANCO/3397/01 establishing analytical methods for the official control of dioxins and dioxins-like PCBs in food and feed were placed at the disposal of laboratories involved in monitoring programs. Due to the lack of reference materials with certified dioxin and dioxin-like PCBs contents, there is a need for laboratories to participate at relevant interlaboratory studies.
The first European interlaboratory study on PCDD/Fs and dioxin-like PCBs in animal feed took place from Novembre 2001 to March 2002. Thirteen European laboratories from eight different countries were invited to participated and all of them took part in the test. Most of these laboratories were from the official food control in their country but some private laboratories participated as well. Materials and Methods
The test material consisted of a freeze dried (moisture<3 %) animal feed powder, characterising naturally contaminated positives (> 0.5 ng WHO-TEQ/ kg dry matter) feed samples collected during the monitoring program 2000 in Belgium and representing a total amount of 12 kg. These samples were sent to the Institute for Reference Material (IRMM at Geel, Belgium) for grinding, sieving at 0.5 mm, freeze drying, homogenising and bottling in amber glass vials. Analytical controls performed randomly on bottles such as moisture level, distribution of particles size were determined. The concentration range of PCDD/Fs in the feed sample was covering 4 orders of magnitude. The participants received one bottle containing roughly 100 g of sample. Analysis were performed using the laboratory’s own analytical method and quantification procedure. Laboratories were asked to perform analysis in triplicate under repeatability conditions in order to estimate the within-laboratory variability. No specific recommendations were given to laboratories excepted the sample intakes. It was recommended to work with a minimum of 30 g of dry matter to achieve low detection limits.
Extraction methods used were Soxhlet (9 times) with mainly toluene or various mixtures of toluene/ethanol, toluene/acetone, hexane and cyclohexane as extracting solvent , ultra-turrax (1 time) with hexane/dichoromethane, hot extraction (1 time) with toluene or toluene/ethanol, mechanical shaken (1 time) with ethylacetate and ASE (1 time) with hexane/acetone.
QUALITY IN POPs ANALYSIS
ORGANOHALOGEN COMPOUNDS
Vol. 59 (2002)
Clean-up methods included the use of silica, alumina, florisil and carbon columns, sulphuric acid pre-treatment, silcagel KOH/H2SO4 and GPC. All laboratories used high resolution mass spectrometry for dioxin analysis. The dioxin-like PCBs were also run on HRMS excepted for one laboratory who used LRMS.The analytical method performance was evaluated by processing the results with ISO 5725 standard. This standard is based on the classical ANOVA technique that gives estimation of the gross average, intralaboratory and interlaboratory variances, repeatability and reproducibility of the method. Tests were applied for outliers detection. The within-laboratory variability was examined using the Cochran’s test and the between-laboratory variability using Grubb’s test. Finally the individual laboratory performances based either on their trueness and their precision were inspected using Mandel’s statistic.
Results and Discussion
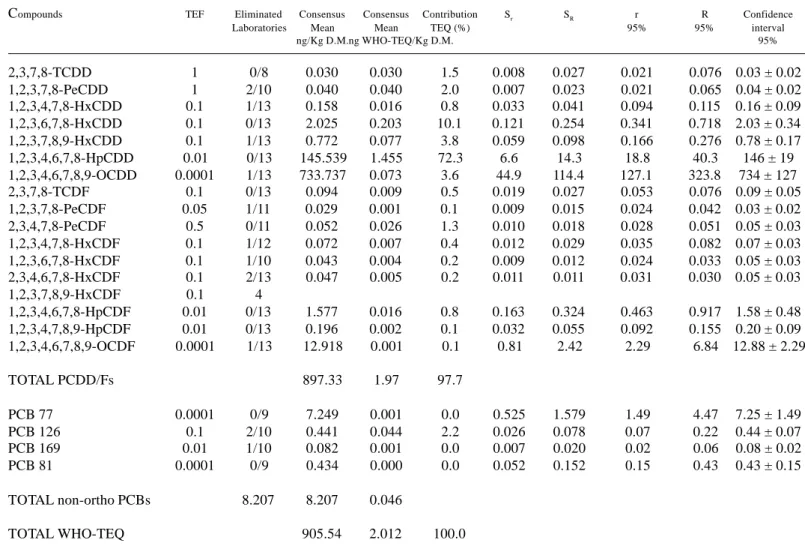
Here is presented the PCDD/Fs and coplanar PCBs results. Table 1 summarised the results. Scarce results (only 4) were reported for 1,2,3,7,8,9 HxCDF and therefore not statistically significant. It was decided to stop further statistical treatment for this congener.
By applying Cochran’s test to all intralaboratory variances, six outliers and three stragglers were detected. Then, the application of the Grubb’s test for single largest and single lowest mean value detected six outliers. Finally, two outliers and two stragglers were found when analysing two extreme observation by the Grubb’s test for two largest and two smallest mean values.
The outliers were rejected and the stragglers were left in the set. Thus, fourteen outlying observations were found by applying at once Cochran’s test, single and double Grubb’s test corresponding to 6 % of the overall dataset. The ratio between the number of eliminated laboratories to the total number of laboratories is always below the 2/9 ratio indicating that the interlaboratory study is acceptable.
Table 1 presents the statistical characteristics of the results for PCDD/Fs and non-ortho PCBs obtained by the participants for the animal feed material. Results are expressed in concentration (ng/kg dry matter) and on WHO-TEQ basis. The congeners concentration varied from part per quadrillion (ppq) level to hundreds part per trillion (ppt) level and hence covering four orders of magnitude. The pattern is quite surprising for animal feedingstuffs but this due to the fact that only naturally positives samples from isolate contamination were collected and mixed. Dioxins congeners contribute to more than 94% of the total TEQ with a high contribution of the 1,2,3,4,6,7,8 HpCDD and 1,2,3,6,7,8 HxCDD congeners. Most of the others congeners are near or just above the limit of quantification of the analytical method. Thus, this study allowed to assess the method performance in terms of precision (repeatability and reproducibility) and trueness over a four orders of magnitude concentration range.
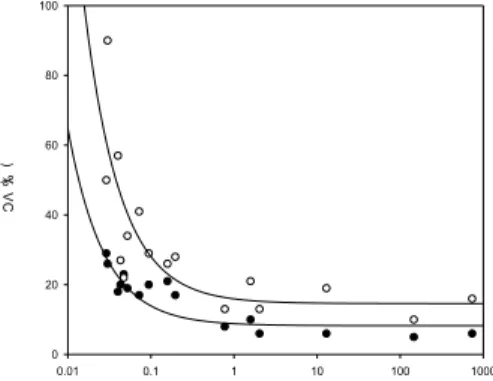
In general, the results summarised in table 1 are characterised by a good repeatability. The repeatability as well as the reproducibility in terms of Sr, SR or r and R are increasing with the mean
analyte level. Then, a linear relationship between Sr or SR and the mean level can be drawn as shown in
figure 1 (left graph). In the linear range, the repeatability and reproducibility expressed in terms of relative standard deviation (RSDr o RSDR) are therefore constant over the concentration range as shown in figure 1 (right graph). Consequently, it seems that the repeatability and reproducibility over the concentration range is independent of the PCDD/Fs congener. In other words, it can be assumed that the reference method by HRMS is, in this case, enough robust to get the same performances in terms of precision for all the PCDD/Fs congeners.
If this assumption can be used, a precision criteria (CV) fixed at 20 % gives, by using the regression curves (figure 1, right graph), a corresponding level at 0.05 ppt for repeatability and 0.25 ppt for reproducibility of the method for all the congeners. This means that 20 % of reproducibility for the method can be achieved at 0.25 pg/g dry matter for any congener.
QUALITY IN POPs ANALYSIS
ORGANOHALOGEN COMPOUNDS
Vol. 59 (2002)
To translate this concentration value in terms of norms, usually expressed on TEQ basis, typical congeners patterns should be available to evaluate the contribution of each congener to the TEQ. For example, figure 2 represents different patterns such as a background pattern (n=75) and three cases of positives patterns observed during the monitoring program of feedingstuffs in Belgium. The ‘worst case’ is the situation when only 2,3,7,8 TCDD is present at 100 % in the sample. Thus, 20 % precision in terms of reproducibility is achieved at 0.25 pg WHO-TEQ/g dry matter. An homogeneous distribution of the 17 congeners gives the same precision at 0.05 pg WHO-TEQ/g d.m. If the same criteria is applied to the positive patterns, a value of 0.02 pg WHO-TEQ/g d.m. is obtained. The calculated values are 2 to 25 times lower than the target 0.5 pg WHO-TEQ/g d.m.
References
1. Official journal of European commission, 2002/201/CE 2. SCAN, European commission, 06/11/2000.
Figure 1. Sr (black dots) and SR (white dots) versus ppt level ; CVr and CVR versus ppt level.
Figure 2. PCDD/Fs patterns of animal feed.
QUALITY IN POPs ANALYSIS
ORGANOHALOGEN COMPOUNDS
V
ol. 59 (2002)
Table 1. Statistical characteristics of the results obtained by the participants laboratories, Sr, Repeatability standard deviation; SR, reproducibility standard deviation ; r, repeatability ; R, reproducibility.
Compounds TEF Eliminated Consensus Consensus Contribution Sr SR r R Confidence
Laboratories Mean Mean TEQ (%) 95% 95% interval
ng/Kg D.M.ng WHO-TEQ/Kg D.M. 95% 2,3,7,8-TCDD 1 0/8 0.030 0.030 1.5 0.008 0.027 0.021 0.076 0.03 ± 0.02 1,2,3,7,8-PeCDD 1 2/10 0.040 0.040 2.0 0.007 0.023 0.021 0.065 0.04 ± 0.02 1,2,3,4,7,8-HxCDD 0.1 1/13 0.158 0.016 0.8 0.033 0.041 0.094 0.115 0.16 ± 0.09 1,2,3,6,7,8-HxCDD 0.1 0/13 2.025 0.203 10.1 0.121 0.254 0.341 0.718 2.03 ± 0.34 1,2,3,7,8,9-HxCDD 0.1 1/13 0.772 0.077 3.8 0.059 0.098 0.166 0.276 0.78 ± 0.17 1,2,3,4,6,7,8-HpCDD 0.01 0/13 145.539 1.455 72.3 6.6 14.3 18.8 40.3 146 ± 19 1,2,3,4,6,7,8,9-OCDD 0.0001 1/13 733.737 0.073 3.6 44.9 114.4 127.1 323.8 734 ± 127 2,3,7,8-TCDF 0.1 0/13 0.094 0.009 0.5 0.019 0.027 0.053 0.076 0.09 ± 0.05 1,2,3,7,8-PeCDF 0.05 1/11 0.029 0.001 0.1 0.009 0.015 0.024 0.042 0.03 ± 0.02 2,3,4,7,8-PeCDF 0.5 0/11 0.052 0.026 1.3 0.010 0.018 0.028 0.051 0.05 ± 0.03 1,2,3,4,7,8-HxCDF 0.1 1/12 0.072 0.007 0.4 0.012 0.029 0.035 0.082 0.07 ± 0.03 1,2,3,6,7,8-HxCDF 0.1 1/10 0.043 0.004 0.2 0.009 0.012 0.024 0.033 0.05 ± 0.03 2,3,4,6,7,8-HxCDF 0.1 2/13 0.047 0.005 0.2 0.011 0.011 0.031 0.030 0.05 ± 0.03 1,2,3,7,8,9-HxCDF 0.1 4 1,2,3,4,6,7,8-HpCDF 0.01 0/13 1.577 0.016 0.8 0.163 0.324 0.463 0.917 1.58 ± 0.48 1,2,3,4,7,8,9-HpCDF 0.01 0/13 0.196 0.002 0.1 0.032 0.055 0.092 0.155 0.20 ± 0.09 1,2,3,4,6,7,8,9-OCDF 0.0001 1/13 12.918 0.001 0.1 0.81 2.42 2.29 6.84 12.88 ± 2.29 TOTAL PCDD/Fs 897.33 1.97 97.7 PCB 77 0.0001 0/9 7.249 0.001 0.0 0.525 1.579 1.49 4.47 7.25 ± 1.49 PCB 126 0.1 2/10 0.441 0.044 2.2 0.026 0.078 0.07 0.22 0.44 ± 0.07 PCB 169 0.01 1/10 0.082 0.001 0.0 0.007 0.020 0.02 0.06 0.08 ± 0.02 PCB 81 0.0001 0/9 0.434 0.000 0.0 0.052 0.152 0.15 0.43 0.43 ± 0.15 TOTAL non-ortho PCBs 8.207 8.207 0.046 TOTAL WHO-TEQ 905.54 2.012 100.0