Transient reduction of placental angiogenesis in PAI-1 deficient mice
Soraya Labied1, Silvia Blacher1,Peter Carmeliet2, Agnès Noël1, Francis Frankenne1, Jean-Michel Foidart1,2 and Carine Munaut1.
1
Laboratory of Tumour and Development Biology, University of Liège, Tour de Pathologie (B23), Groupe Interdisciplinaire de Génoprotéomique Appliquée-Cancer (GIGACancer, B-4000 Liège, Belgium; 2Center of Transgene technology and Gene Therapy, Katholieke Universiteit Leuven, B-3000 Leuven; 3Department of Gynecology, CHU, University of Liège, B-4000 Liège, Belgium.
Editorial correspondence:
Laboratory of Tumour and Development Biology Université de Liège, Tour de Pathologie (B23) Sart-Tilman; B-4000 Liège
Tel : 32-4-366.24.53 Fax: 32-4-366.29.36
ABSTRACT
Murine placentation is associated with the invasion of maternal endometrium by trophoblasts and an extensive maternal and foetal angiogenesis. Plasminogen activator inhibitor-1 (PAI-1) is transiently produced by spongiotrophoblasts and trophoblast giant cells at 10.5-11.5 day post-coitum (dpc). Knowing the key contribution of PAI-1 in the regulation of angiogenesis, we have now analyzed the consequence of PAI-1 deficiency on murine placentation. Morphological and quantitative computer-assisted image analysis revealed abnormal placental morphology in PAI-1
mice at 10.5 and 12.5 dpc. At 10.5 dpc, the genetic ablation of PAI-1 resulted in a transient reduction of both maternal and foetal vascularizations in the placenta and increased trophoblast cell density. This was associated with a poorer development of the labyrinth and an extension of the decidua. A larger spongiotrophoblast layer appeared at 12.5 dpc in PAI-1 deficient mice. Placental morphology was normalized at 14,5 dpc. Microarray analyses performed on laser capture microdissected labyrinths revealed that 46 genes were differentially expressed at 10.5 dpc between the two genotypes. However, only 11 genes were still differently modulated at 14.5 dpc when normalization of placental morphology had take place. This transcriptomic profiling highlighted a dysregulation in the expression of placenta-related cathepsin family members. All together our data provide evidence for a transient impaired placental morphology in PAI-1-deficient mice which is then normalized leading to normal embryonic development.
1. INTRODUCTION
Extensive maternal and foetal vascular remodellings during placentation result in a large network of closely apposed but separated maternal and foetal circulations (24). The maternal uterine vascular bed changes dramatically during pregnancy as existing vessels dilate and new vessels form (13). In addition, in primates and rodents, terminal vascular bed is not lined by endothelial cells but is rather hemochorial, meaning that maternal blood perfuses a space lined by trophoblast cells. Failure in placental angiogenesis can lead to pregnancy disorders, including miscarriages, foetal growth restriction and preeclampsia (8).
The precise molecular mechanisms that regulate maternal vascular development during gestation and its relationship to foetoplacental development are largely unknown. Adequate placentation involves successful invasion of uterine decidua by primary and secondary trophoblast cells. These cells express several factors with potent angiogenic (e.g., VEGF, Proliferin) and vasoactive (e.g., nitric oxide, Adrenomedullin) effects (13). Their invasive property is associated with their capacity to secrete serine proteases (plasminogen/plasmin), matrix metalloproteinases (MMPs) and cathepsins that degrade the extracellular matrix (37; 45). A functional synergism of both serine proteases and MMPs regulates vascularisation during placental development (48).
The plasminogen/plasmin system consists of an inactive proenzyme, plasminogen which is converted into plasmin by urokinase-type plasminogen activator (uPA) or tissue-type plasminogen activator (tPA). Plasminogen activator inhibitor-1 (PAI-1) is a primary uPA regulator which inhibits uPA by forming a covalent complex, thus controlling the thrombotic/fibrinolytic process(7; 39). In addition, through its binding to the extracellular matrix (ECM), PAI-1 regulates cell adhesion and migration by interfering with the binding between cellular integrins or uPA receptor (uPAR) and vitronectin (16).
The key role of PAI-1 in angiogenesis associated to cancer progression is well documented. In vivo experiments revealed that: (1) pharmacological PAI-1 levels prevent angiogenesis and tumorigenesis; (2) physiological PAI-1 levels inversely facilitate tumour growth and angiogenesis, and (3) tumour growth and angiogenesis are impaired in the absence of PAI-1 in mice (3; 20; 36). We have shown in several in vivo and in vitro models of angiogenesis that such angiogenic property of PAI-1 results from its ability to inhibit plasmin and thereby to protect endothelial cells from excessive proteolytic degradation (2-4; 20; 33; 39) and/or apoptosis (5). Based on the similarities between tumor cell invasion and trophoblast invasion (49), we extended our study by investigating the putative function of PAI-1 during physiological placentation through a genetic approach. Intriguing findings are the observations that PAI-1 knockout mice are fertile and that their litter sizes are normal (11). During implantation, PAI-1 is produced specifically by spongiotrophoblasts and trophoblast giant cells at days 10.5-11.5 dpc (50). The cell specific and timely regulated expression of PAI-1 in placenta, suggest that it might play a significant role, during early phases of placental vascular remodelling. In the present study, we explored the putative role of PAI-1 during mouse placentation by analysing the vasculature and morphology of placenta at 10.5, 12.5 and 14.5 dpc in PAI-1 mice deficient or in their control counterparts. In order to evaluate gene expression modulation associated to PAI-1 deficiency, laser capture microdissection (LCM) of labyrinth from PAI-1+/+ and PAI-1-/- mice followed by microarray analysis were carried out. We provide evidence for a transient perturbation of placental morphology associated with a deregulation at the transcript levels of murine cathepsin family members.
2. MATERIALS AND METHODS
2.1 Transgenic mice
Homozygous mice with a single gene deficiency (PAI-1-/-) and the corresponding wild type animals (PAI-1+/+) were previously described (11). To generate homozygous embryos in mothers of the same genotype, homozygote knockout and WT females with proven fertility were mated with homozygotes knockout and WT males, respectively. Pregnancy was checked by occurrence of vaginal plugs in the morning. The day of vaginal copulation plug detection was designated as day 0.5 post-coitum (dpc). Embryos were collected at 10.5, 12.5 and 14.5 dpc. At each time point, 6 to 9 embryos were obtained from three different females.
2.2 Tissue preparation
At sacrifice, the two uterine horns were removed to isolate and separate the different placental units. Length and width of each of them were measured just after dissection. The feto-placental units of first horn were fixed in 10% formaldehyde for 1 hour, at room temperature. Dehydration was achieved by incubating embryos, 2 times for 1 hour in increasing concentrations of alcohol (70% to 95% ethanol) followed by isopropanol and xylol. Specimens were then embedded in Paraplast Plus (Labonord, Rekkem, Belgium). The feto-placental units of second horn were embedded in TissuTeck (Labonord), snap frozen in liquid nitrogen, and stored at -80oC until use.
2.3 Histological analysis
Serial sections (5 µm thick) were stained with Hematoxylin and Eosine or May-Grünwal-Giemsa (MGG) staining (Merck, Darmstadt, Germany) for classical morphology analysis. To identify trophoblast cells in labyrinth and spongiotrophoblast, frozen sections were dryed for 10
min, fixed with paraformaldehyde (PFA) 4% for 10 min, permeabilised in Triton X-100 1% for 5 min, incubated with 1.5% milk and 0.5% Tween-20 for 30 min at room temperature and then incubated with primary antibody (Ab). Sections were then incubated, during 2h at room tempture, with anti-keratin Ab (rabbit anti-mouse, Z0622, DAKO, Denmark) diluted 1/200 (1). Sections were washed in PBS (5x 5min) before incubation with the appropriate secondary Ab (swine anti-rabbit, DAKO) conjugated to tetramethyl-rhodamine isothiocyanate (TRITC) diluted 1/40, for 30 min, at room temperature.
Decidual cells were labeled by specific staining for desmin (9; 26) as follows: paraffin sections were heated (1.4 bar and 126oC for 11 min in 10 mM citrate buffer, pH 6). Incubation with monoclonal mouse anti-desmin Ab (M0760, DAKO) (diluted 1/100) was conducted for 30 min at room temperature and detected with ARK system (K3954, DAKO) (9; 26). The DAB system was used for final staining.
Panendothelial cell “MECA32” Ab (75861E, Pharmingen, San Jose, CA, USA ) was used to identify both maternal and foetal blood vessels (6). For this purpose, sections were fixed in acetone at -20oC for 10 min then in 80% methanol for 10 min at 4°C. The primary Ab (rat-anti mouse MECA32) diluted 1/10, was incubated overnight at 4oC followed by the appropriate secondary Ab for 30 min at room temperature then revealed with DAB system.
Cell proliferation in mice placenta was performed by Ki-67 immunostaining as follow: paraffin sections were heated (1.4 bar and 126oC for 11 min in 10 mM target retrieval solution). Endogenous peroxydases were inactivated in 3% H2O2 solution for 20 min at RT followed by incubation with the universal blocking reagent (HK085-5KE, BioGenex, CA, USA). Ki-67 Ab (M7249, DAK0) (diluted 1/50) was applied for 60 min at RT. A biotinylated rabbit anti-rat (E468, DAKO) (diluted 1/300) was used as secondary Ab. Immunostaining was achieved by 30 min streptavidine/HRP incubation and DAB revelation.
For each specific immunohistochemistry controls were performed by omitting the primary antibody (Desmine IHC) or by incubating the sections with nonspecific IgG at the same concentration as the primary antibody. Rabbit (X0936, DAKO) and rat (012-000-002, Jackson Immunoresearch, UK) immunoglobulin’s fractions were used for keratin, Ki67 and anti-MECA32 IHC.
2.4 May-Grünwald-Giemsa (MGG) staining
Paraffin sections were incubated 20 min at 37°C with the May-Grünwald solution diluted 1/8 with Sorensen buffer (pH 6.4) (Merck). After rinsing in Sorensen buffer, sections were stained 40 min with Giemsa solution (Merck) at 37°C (stock solution was diluted 1/75 with Sorensen buffer) and then incubated 4 min in 0,1% acetic acid (31).
2.5 Quantification of trophoblast, foetal and maternal blood vessel density
Image processing was performed by using Aphelion3.2 (Adsis, Meythet, France) software. Images were registered in the RGB color space, in which maternal erythrocytes appeared red whereas foetal red cells were colored as mauve dots and trophoblast cells as purple-blue regions (Fig. 1a). Area of region of interest was manually delineated by drawing (Fig. 1b). Two windows were drawn manually in order to discriminate between maternal (Fig. 1c) and foetal vessels (Fig. 1d). The region corresponding to trophoblast cells (Fig. 1e) was then obtained by subtracting the images (c) and (d) from the image (b). Resulting images were binarized (Figs. 1f, g, h) and maternal and foetal vessel and trophoblast cell densities were determined as the quotient between the surface occupied by maternal vessels, foetal vessels and trophoblast cells and the surface of the region of interest (Fig. 1b).
2.6 Morphometric analysis of labyrinth and decidua thickness
Different zones including the labyrinth, the spongiotrophoblast, trophoblast giant cells and maternal decidua, were identified in hematoxylin-eosine stained sections. The widths of labyrinth, spongiotrophoblast and decidua were determined by drawing a line parallele to the basis of the labyrinth, identifying the midpoint of this line, and then extending a perpendicular line first to the outer edge of the spongiotrophoblast (junctional zone) and then up to the peripheral edge of the decidua (Fig. 2 G). These measures were used to determine the ratios between decidua/labyrinth and spongiotrophoblast/labyrinth.
For these measurements, microscopic images of feto-placental sections stained with hematoxylin-eosine were acquired via a numerical camera (Nikon, Coolpix 990, Tokyo, Japan) with identical magnification. For each sample, whole implantation site with the embryo in situ was cut and morphometric measurement was performed on 5 sections chosen in the extremities and the middle part of the placenta using the IMAGE J software. The average of these five values was determined for each implantation site.
2.7 Laser Pressure Microdissection (LCM) and RNA extraction
In order to isolate the labyrinth layer, 10 µm of foeto-placental frozen sections were carried out and labyrinth was microdissected. With this aim, 3 foeto-placental units from 3 different mice were used for each condition [(1) PAI-1+/+ at 10.5 dpc, (2) PAI-1-/- at 10.5 dpc, (3) PAI-1+/+ at 14.5 dpc and (4) PAI-1-/- at 14.5 dpc]. The laser pressure catapulting technique was adapted from our previous study (42). Briefly, 8 to 10 serial frozen sections of each placenta were mounted onto PALM® Membrane Slides (0.17mm PEN) ready to use (PALM, Germany) and stored on ice until microdissection. The Robot-Microbeam (PALM) focused the laser (60nm) on the specimen with appropriate energy settings enabling the catapulting of the labyrinthic selected area into the
microfuge cap. Samples were covered with 100 µl of TRIzol (Invitrogen, CA, USA) and stored at -80°C. For RNA extraction, 100 µl of TRIzol and 40 µl of chloroform were added to samples, mixed and centrifuged for 15 min at full speed at 4°C. Supernatant was measured and transferred in a new tube and then a same volume of 70% ethanol was added. Samples were mixed by pipetting. Purification of total RNA was performed with RNeasy Mini Kit (Qiagen, Venlo, Netherlands) according to manufacturer’s protocol.
2.8 Transcriptome analysis
For microarray study, RNA pools were used and contained equal amount of RNA from the labyrinth layer of 3 mice per conditions [(1) PAI-1+/+ at 10.5 dpc, (2) PAI-1-/- at 10.5 dpc, (3) PAI-1+/+ at 14.5 dpc and (4) PAI-1-/- at 14.5 dpc]. The RNA quality was assessed by automated elecrophoresis Experion System using the RNA StdSens Analysis kit (Bio-Rad). Four micrograms of total RNA were labeled using the GeneChip® Expression 3’ Amplification One-Cycle Target Labeling kit (Affymetrix, Santa Clara, CA) following the manufacturer’s protocol. The cRNA was hybridized to Genechip Mouse Genome 430 2.0 (Affymetrix) according to the manifacturer’s protocol. Briefly, double-stranded cDNA was synthesized from 4 µ g of total RNA primed with a poly-(dT)-T7 oligonucteotide. The cDNA was used in an in vitro transcription reaction (IVT) in the presence of T7 RNA polymerase and biotin-labeled modified nucleotides during 16 hours at 37°C. Biotinylated cRNA was purified and then fragmented (35-200 nucleotides) together with hybridization controls and hybridized to the microarrays for 16 hours at 45°C. Using Fluidics Station (Affymetrix), the hybridized biotin-labeled cRNA was revealed by successive reactions with streptavidin R-phycoerythrin conjugate, biotinylated anti-strepatvidine antibody and streptavidine R-phycoerythrin conjugate. The arrays were finally scanned with an affymetrix/Hewlett-Packard GeneChip Scanner 3000 7G. The raw CEL files
were imported in R software (http://www.r-project.org/) for data analysis. Data obtained after Affymetrix microarray hybridization analysis were normalized with the gcrma algorithm (29), available in the Bioconductor package (23). Differential analysis was performed with the varmixt package of R. A double-sided, unpaired t-test was computed for each gene between the two conditions. Variance of the difference in gene expression was split between subgroups of genes with homogeneous variance (17).
2.9 cDNA synthesis and RT-PCR
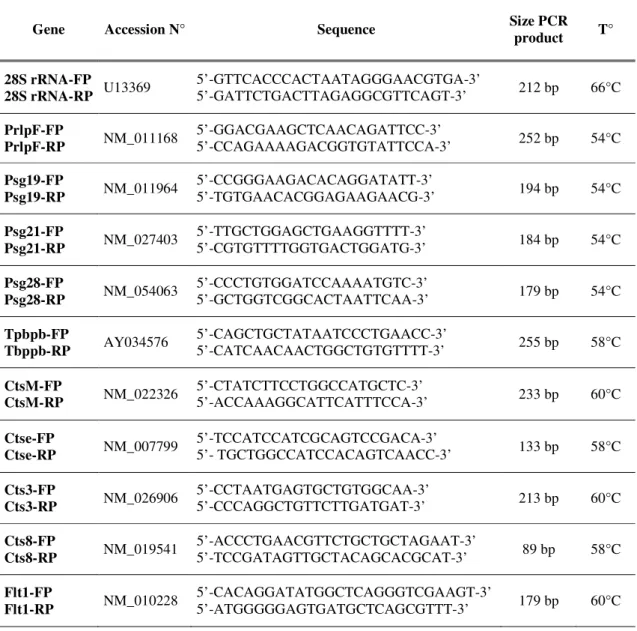
For cDNA synthesis, 1µg of total RNA was reverse transcribed with a Super Script First Strand Synthesis System (Invitrogen, Carslbad, USA) and random hexamers as primers. cathepsine 3 (Cts3), cathepsine M (CtsM), cathepsine 8 (Cts8), cathepsine E (CtsE), pregnancy-specific-glycoprotein 19, 21 and 28 (Psg), prolactin-like protein F (PrlpF), trophoblast specific protein beta (Tpbpb) and fms-like tyrosine kinase 1 (Flt-1) RNA and 28S ribosomal RNA (rRNA) were measured in 10 ng aliquots of cDNA using Taq polymerase (Takara, Shiga, Japan) and 5 pmoles of specific primers (Eurogentec, Seraing, Belgium). Primers, amplification tempter and cycle’s number used for each gene are listed in Table 1. The thermal cycling included 2 min. at 95°C for denaturation and then amplification 15 sec. at 94°C, 20 sec at specific amplification tempeture (Table1) and then 20 sec. at 72°C with a final incubation 2 min. at 72°C. RT-PCR products were resolved on 10%polyacrylamide gels and analysed using a LAS-4000 Imaging (FujiFilm) after staining with Gelstar dye (FMC BioProduct, Rockland, ME, USA). mRNA products were quantified by normalization withrespect to 28S rRNA. RT-PCR was performed in duplicate for eachsample.
For histological investigations, data were analyzed by using GraphPad 4.0 software (San Diego, CA). A Mann-Withney test was used to determine if difference between experimental groups could be considered as significant. For microarray, the raw P values were adjusted by the Bonferroni method, which controls the Family Wise Error Rate (FWER) (22). The level of statistical significance was set at 0.05 for all the comparisons.
3. RESULTS
3.1- Maternal and foetal vascularisations are reduced in PAI-1-/- mice at 10.5 dpc
Since placental PAI-1 expression is restricted to days 10.5-11.5 dpc (50) we first examined PAI-1+/+ and PAI-1-/- implantation sites at 10.5 dpc when embryonic and maternal placental vessels invade the labyrinth. Placental circulation was assessed by the presence of vessels containing nucleated foetal erythrocytes stained in mauve by MGG (Fig. 2A). Remodeled maternal vessels where endothelial cells were substituted by trophoblast cells, were characterized by their content in red enucleated erythrocytes (Fig. 2A). Maternal and embryonic circulations were in close proximity in the labyrinth layer (Fig. 2A) which was composed of thin strands of trophoblast cells positive for keratin (Fig. 2C) intermingled with extensive networks of foetal and maternal vessels. In PAI-1-/- mice, the labyrinth was characterized by a dense network of thicker strands of keratin positive trophoblastic cells (Fig. 2D) which were poorly infiltrated by maternal and embryonic vessels (Fig. 2B).
Both foetal and maternal blood vessel densities were significantly reduced in PAI-1 deficient mice in comparison to WT mice (p< 0.02) (Figs. 3A, B). In addition, a 35% increase of trophoblast cell density was noted in PAI-1-/- mice (p= 0.0047) (Fig. 3C). Immunostaining of foetal and maternal blood vessels by using an anti- MECA-32 Ab confirmed the reduction of
blood vessel number and confirmed the reduced development of the labyrinth in PAI-1-/- mice (Fig. 2E, F). No difference was seen in spongiotrophoblast layer between these two groups of mice.
3.2- The labyrinth is poorly developed and the decidual layer is extended in PAI-1-/- mice at 10.5 dpc
The decidua identified with an anti-desmin antibody appeared larger in PAI-1-/- mice than in WT animals (Figs. 2G, H). A quantitative morphometric assessment of relative labyrinth and decidua thickness confirmed the relative poorer development of the labyrinth and the higher extension of the decidual layer in PAI-1-/- mice. The decidua/labyrinth ratio was 2.3-fold higher in PAI-1-/- than in their WT counterpart (Fig. 3D). This increased ratio was related to a thicker decidua and a thinner labyrinth layer in PAI-1-/- mice (p=0.0002). This is presumably the consequence of a decreased decidual invasion by trophoblast cells.
Ki-67 immunohistochemistry, revealed that PAI-1-/- placentas presented a larger area or patches of Ki67 positive cells at the labyrinth layer comparing to PAI-1+/+ placentas (Fig.2I, J). This finding confirms that reduction of labyrinth layer in the absence of PAI-1 is correlated to differentiation delay of trophoblast cells.
3.3- The labyrinthic vascularization is restored with a larger spongiotrophoblast layer in PAI-1-/- mice at 12.5dpc
At day 12.5, when placental PAI-1 is no longer expressed, important differences appeared in the spongiotrophoblast (Fig. 4A, B). In PAI-1-/- mice, spongiotrophoblast appeared much denser with more trophoblast cells and less lacunar structures, leading to an increased thickness (Fig. 4B). Morphometric measurement revealed a 34% increased spongiotrophoblast/labyrinth ratio in PAI-1-/- mice (Fig. 5A). The relative decidua/labyrinth ratio was again more important in
PAI-1-/- mice (Fig. 5B). Thus, at day 12.5, PAI-1 deficiency led to a reduction of the labyrinth thickness and an enhancement of the thickness of spongiotrophoblast layer. However, in sharp contrast to the observation performed at 10.5 dpc, the labyrinth morphology (Figs. 4C, D) and vessel density (Figs. 4 E, F) evaluated with an anti-MECA32 antibody appeared identical in PAI-1+/+ and PAI-1-/- mice, suggesting a normalization of the labyrinth structure. Quantification of foetal and maternal blood vessel and trophoblast cell densities confirmed these observations.
3.4- Placental morphology is normalized in PAI-1-/- mice at 14.5 dpc
At day 14.5, the placental morphology of PAI-1-/- and PAI-1+/+ mice were indistinguishable. The morphological differences observed in the placenta of PAI-1-/- or PAI-1+/+ mice, at days 10.5 and 12.5, were no longer present. The decidua/labyrinth ratio was identical in PAI-1+/+ and PAI-1-/- mice. Morphometric quantifications confirmed the restoration of a normal placental morphology in PAI-1 deficient mice. This observation demonstrates that the lack of PAI-1 transiently affected placental morphology and vascularisation which is then followed by a normalization of placental structure between 12.5 and 14.5 dpc.
3.5- Phenotype observed at 10.5 dpc in PAI-1-/- mice is associated with gene modulation To assess the molecular basis of the impaired angiogenesis observed in PAI-1deficient mice, we performed a transcriptomic profiling using the Affymetrix Mouse Genome 430 2.0 chips (34,000 genes) in the labyrinth layer of PAI-1+/+ and PAI-1-/- at 10.5 and 14.5 dpc. This microarray analysis revealed that more genes were significantly modulated during the course of pregnancy by comparing 10.5 dpc to 14.5 dpc than when comparing the two genotypes at identical lengths of pregnancy. Indeed, the comparison of gene expression between 10.5 dpc and 14.5 dpc revealed that 496 genes were differentially expressed in PAI-1+/+ mice and 210 in PAI-1
-
mice. Among those genes, 159 were co-expressed in the two genotypes (Figure 6A). When comparing PAI-1 proficient and deficient mice at the early time point, i.e. at 10.5 dpc when specific alteration of the labyrinth layer was histologically observed, only 46 genes were differentially expressed between PAI-1+/+ and PAI-1-/- (Figure 6B). Later on, at 14.5 dpc, when placental morphology was normalized, only 8 of these 46 genes were still differently regulated between the two genotypes. In addition, two additional genes appeared differently expressed at this latter time point. Features of the identified gene profile in PAI-1-deficient mice at 10.5dpc are that (1) most are related to molecules specifically expressed in the murine placenta (Fig. 6), and (2) no extracellular matrix components, MMPs or serine proteases has been identified.
To validate this transcriptional profiling, quantitative RT-PCR assays were performed on the same RNA pools those used for microarray analysis. Among the regulated genes, we validated the RNA expression of those that are potentially implicated in the impaired angiogenesis and abnormal morphology. Results in Fig. 7 are expressed as the mRNA ratio in PAI+/+ to PAI-1-/- at 10.5 and 14.5 dpc. This analysis confirmed the up-regulation of cathepsin 8 (Cts8) and the down-regulation observed at 10.5 dpc in PAI-1-deficient mice for cathepsin 3 (Cts3), cathepsin M (CtsM), pregnancy-specific-glycoprotein (Psg) 19, 21 and 28, prolactin-like protein F (PrlpF), trophoblast specific protein beta (Tpbpb), and fms-like tyrosine kinase 1 (Flt-1). In sharp contrast, such a differential regulation between the two genotypes was not anymore detected at 14.5 dpc (mRNA ratio around 1) (Fig.7), further supporting the normalization of placental features at this time point.
4. DISCUSSION
PAI-1 contribution in pathological processes associated to abnormal angiogenesis such as cancer and age-related macular degeneration is well documented (4; 25; 33), but its function during the remodeling of maternal tissues associated with human embryo implantation is not yet fully determined (21; 28; 45). In mice, PAI-1 is essentially produced by spongiotrophoblast and trophoblast giant cells at days 10.5-11.5 dpc (50). Through a genetic approach, we tested the hypothesis that PAI-1, which is a key regulator of pathological angiogenesis could contribute to the control of placental angiogenesis. We provide, for the first time, evidence that PAI-1 gene deletion transiently affects the process of placentation.
The lack of PAI-1 resulted at day 10.5 dpc, when PAI-1 is normally expressed by the trophoblasts, in an enlarged decidua and a reduced labyrinth layer due to trophoblast cells differenciation delay as evidenced by Ki-67 immunostaining. Similar results were also described with cystein cathepsin proteases in trophoblast function (47). Moreover, both maternal and foetal vessel densities were decreased. Prolactin immunohistochemistry revealed no difference in trophoblast giant cells density between PAI-1+/+ and PAI-1-/- mice (data not shown). At later time point (14.5 dpc) a normalization of placental morphology was evident. Such a normalization detected at a time when PAI-1 is no longer expressed in normal mouse pregnancy indicates that placental remodeling and embryo growth become subsequently independent from PAI-1 status. These data emphasize the importance of PAI-1 specifically at early steps of angiogenesis onset. They are on line with previous studies related to cancer progression (36).
PAI-1 is a multifunctional molecule known to control not only extracellular matrix proteolysis, but also cell matrix interaction through binding to vitronectin and cell surface molecules such as integrins and uPA receptor (7; 15; 18; 43). We previously showed in various in
vivo and in vitro models of angiogenesis that PAI-1 plays a critical angiogenic role mainly through its capacity to tightly control extracellular proteolysis (4). The necessity of a balance between plasminogen activators and PAI-1, at least in pathological angiogenesis, is supported by evidence of a dose-dependent effect of PAI-1 (2; 20; 32). One function of PAI-1 may consist in the protection of angiogenic vascular endothelial cells or other migrating cells by preventing excessive pericellular proteolysis and cellular damage as well as by preserving matrix integrity (4; 10; 39; 41). We also recently reported that PAI-1 displays a proangiogenic activity by protecting endothelial cells from Fas-ligand mediated apoptosis induced by plasmin (5). Although, PAI-1 action could rely on the control of plasmin-mediated proteolysis, the absence of a phenotype in plasminogen-deficient mice suggests that the action of PAI-1 could not be simply related to this mechanism. In an attempt to determine whether impaired vascularisation in the labyrinth layer could be related to excessive extracellular matrix protein deposit, immunostainings of fibrin(ogen), collagen III and collagen VI were performed. However, no difference between the two genotypes of mice was detected (data not shown). Moreover, in both physiological (the present work) and pathological angiogenesis process, the phenotype associated to PAI-1 deficiency (impaired angiogenesis) is more severe than that observed in plasminogen-deficient mice. Indeed, the defect of tumor vascularisation observed in PAI-1-/- mice could not be fully phenocopied by plasminogen deficiency(3) . Therefore, one can suggest that PAI-1controls placenta formation by regulating adhesive, migratory, and growth properties of invasive cells (15; 38; 41).
Transient elevated PAI-1 expression could serve to temporally and spatially modulate plasmin initiated peritrophoblast proteolysis further facilitating epithelial invasive potential. Microarray analysis performed on microdissected labyrinth layers demonstrated that 46 genes were differentially regulated in the absence of PAI-1 gene at 10.5 dpc. In sharp contrast, at 14.5
dpc, when placental morphologies normalization takes place, only 10 genes were found differentially regulated between PAI-1-/- and PAI-1+/+. Among the 38 genes modulated between PAI-1+/+ and PAI-1-/-, at 10.5 dpc, 20 (52%) were placenta-specific genes or placenta-specific members of gene families. Placenta-specific genes include the pregnancy-specific-glycoproteins (Psg) (44), and carcinoembyonic antigen-related cell adhesion molecules (Ceacam) (44) which both belong to the immunoglobulin super family, trophoblast specific protein b (Tpbpb), prolactine like protein (Prlp) and decidual/trophoblast prolactin-related protein (Dtrp) (30; 40). These gene modulations might reflect the morphological changes observed at early stage of placental formation. Surprisingly, the transcriptomic analysis did not reveal any modulation of serine proteases or MMPs, or their inhibitors. These two proteolytic systems have however been shown to display overlapping functions during embryo implantation and development (12; 14; 45), as well as during physiological remodeling processes such as wound healing (34). In contrast, our study pinpointed a dysregulation in cystein cathepsin expression. Two murine cathepsins (cts3 and M) specifically expressed by spongiotrophoblasts were downregulated at 10.5 dpc (37). In the opposite, cts8 transcripts mainly produced by giant trophoblastic cells were upregulated at this time point. In addition, the expression of Tpbps encoding a truncated protein with homology to cathepsin (19; 37) was repressed. Tpbps may function as inhibitors of cathepsin proteases. Little is known about the functions and targets of these cathepsins. Whether the transcriptomic modulation of murine cathepsin family members contribute to impaired angiogenesis or participate to the subsequent normalization of placenta development remains to be determined. In this context, it is intriguing to note that Cts8 whose transcripts were up-regulated in PAI-1-deficient mice is produced by trophoblast cells that invade the maternal decidua and contribute to spiral artery remodeling (47; 52). Cts8 has been reported to endow trophoblast giant cells with smooth muscle-degrading function (47).
Several compensatory angiogenic factors allowing mice to escape to the phenotype could be associated with PAI-1 deficiency. Indeed, we have previously shown that the angiogenic factor, FGF-1, is important for primary tumor growth and compensates the absence of PAI-1 (35). However, no modulation of FGF-1 mRNA expression was observed in our microdissected samples (data not shown). In addition, angiogenic factors such as VEGF or Placental Like Growth Factor (PlGF) were not listed in our microarray analysis to be differentially regulated between PAI-1+/+ and PAI-1-/- mice. The unique known angiogenic factor to be modulated at 10.5 dpc was fms-like tyrosine kinase 1 (Flt-1) (27). However, its down-regulation observed in PAI-1-deficient mice likely reinforces the impaired placental vascularization rather than compensates for the lack of PAI-1.
Altogether, our data show that, despite the unaffected pregnancy outcomes, transient morphological abnormalities at the level of labyrinth, spongiotrophoblast and decidua as well as modulation of several gene expressions by trophoblast cells, result from the deficiency of PAI-1 at 10.5 and 12.5 dpc. Through a genetic approach, we provide new insights into the unique function of PAI-1, in the setup of placental maternal and foetal vascularisation.
Successful human embryo implantation and placentation also requires a tight control of placental expression of proteases and of their inhibitors (53). Abnormalities in PAI-1 expression are documented in patient with reported implantation failures, early preeclampsia, HELLP syndrome (46; 51; 54). It is therefore interesting to speculate that the major transient placental abnormalities elicited by lack of PAI-1 expression in this murine model my also translate in human placental pathogenesis.
ACKNOWLEDGMENTS
We thank Isabelle Dasoul, Patricia Gavitelli, Marie-Rose Pignon and Fabrice Olivier for their excellent technical assistance, Benoît Hennuy (GIGA-GenoTranscriptomics platform) and Nathalie Coqué (AgroParisTech-INRA, Paris) respectively for microarray hybridization and statistical analyses.
The authors thank the helpful contribution of the GIGA genomic plateform (University of Liège). This work was supported by (FP6) Framework Programme 6-NOE n° LSHM-CT-2004-512040 « EMBIC », grants from the FP7-HEALTH-2007-A Proposal No. 201279 “MICROENVIMET”, the Fonds de la Recherche Scientifique Médicale, the Fonds de la Recherche Scientifique - FNRS (F.R.S.-FNRS, Belgium), the Foundation against Cancer (foundation of public interest, Belgium), the C.G.R.I.-F.N.R.S.-INSERM Coopération, the Fonds spéciaux de la Recherche (University of Liège), the Centre Anticancéreux près l'Université de Liège, the Fonds Léon Fredericq (University of Liège), the Direction Générale Opérationnelle de l’Economie, de l’Emploi et de la Recherche from the S.P.W. (Région Wallonne, Belgium), the Fonds Social Européen (F.S.E., Belgium), the Fonds d’Investissements de la Recherche Scientifique (F.I.R.S., CHU, Liège, Belgium), the Interuniversity Attraction Poles Programme - Belgian Science Policy (Brussels, Belgium).
Reference List 5
1. Adamson SL, Lu Y, Whiteley KJ, Holmyard D, Hemberger M, Pfarrer C and Cross JC. Interactions between trophoblast cells and the maternal and fetal circulation in the mouse placenta. Dev Biol 250: 358-373, 2002.
2. Bajou K, Maillard C, Jost M, Lijnen RH, Gils A, Declerck P, Carmeliet P, Foidart JM 10
and Noel A. Host-derived plasminogen activator inhibitor-1 (PAI-1) concentration is critical for in vivo tumoral angiogenesis and growth. Oncogene 23: 6986-6990, 2004.
3. Bajou K, Masson V, Gerard RD, Schmitt PM, Albert V, Praus M, Lund LR, Frandsen TL, Brunner N, Dano K, Fusenig NE, Weidle U, Carmeliet G, Loskutoff D, Collen D, Carmeliet P, Foidart JM and Noel A. The plasminogen activator inhibitor PAI-1 controls 15
in vivo tumor vascularization by interaction with proteases, not vitronectin. Implications for antiangiogenic strategies. J Cell Biol 152: 777-784, 2001.
4. Bajou K, Noel A, Gerard RD, Masson V, Brunner N, Holst-Hansen C, Skobe M, Fusenig NE, Carmeliet P, Collen D and Foidart JM. Absence of host plasminogen activator inhibitor 1 prevents cancer invasion and vascularization. Nat Med 4: 923-928, 20
5. Bajou K, Peng H, Laug WE, Maillard C, Noel A, Foidart JM, Martial JA and DeClerck YA. Plasminogen activator inhibitor-1 protects endothelial cells from FasL-mediated apoptosis. Cancer Cell 14: 324-334, 2008.
6. Bergese SD, Pelletier RP, Ohye RG, Vallera DA and Orosz CG. Treatment of mice with 25
anti-CD3 mAb induces endothelial vascular cell adhesion molecule-1 expression.
Transplantation 57: 711-717, 1994.
7. Blasi F and Carmeliet P. uPAR: a versatile signalling orchestrator. Nat Rev Mol Cell Biol 3: 932-943, 2002.
8. Brosens JJ, Pijnenborg R and Brosens IA. The myometrial junctional zone spiral arteries 30
in normal and abnormal pregnancies: a review of the literature. Am J Obstet Gynecol 187: 1416-1423, 2002.
9. Can A, Tekelioglu M and Baltaci A. Expression of desmin and vimentin intermediate filaments in human decidual cells during first trimester pregnancy. Placenta 16: 261-275, 1995.
35
10. Carmeliet P and Collen D. Transgenic mouse models in angiogenesis and cardiovascular disease. J Pathol 190: 387-405, 2000.
11. Carmeliet P, Kieckens L, Schoonjans L, Ream B, van Nuffelen A, Prendergast G, Cole M, Bronson R, Collen D and Mulligan RC. Plasminogen activator inhibitor-1
gene-deficient mice. I. Generation by homologous recombination and characterization. J Clin 40
Invest 92: 2746-2755, 1993.
12. Cohen M, Meisser A and Bischof P. Metalloproteinases and human placental invasiveness. Placenta 27: 783-793, 2006.
13. Cross JC, Hemberger M, Lu Y, Nozaki T, Whiteley K, Masutani M and Adamson SL. Trophoblast functions, angiogenesis and remodeling of the maternal vasculature in the 45
placenta. Mol Cell Endocrinol 187: 207-212, 2002.
14. Curry TE, Jr. and Osteen KG. The matrix metalloproteinase system: changes, regulation, and impact throughout the ovarian and uterine reproductive cycle. Endocr Rev 24: 428-465, 2003.
15. Czekay RP, Aertgeerts K, Curriden SA and Loskutoff DJ. Plasminogen activator 50
inhibitor-1 detaches cells from extracellular matrices by inactivating integrins. J Cell Biol 160: 781-791, 2003.
16. Czekay RP and Loskutoff DJ. Unexpected role of plasminogen activator inhibitor 1 in cell adhesion and detachment. Exp Biol Med (Maywood ) 229: 1090-1096, 2004.
17. Delmar P, Robin S and Daudin JJ. VarMixt: efficient variance modelling for the 55
18. Deng G, Curriden SA, Hu G, Czekay RP and Loskutoff DJ. Plasminogen activator inhibitor-1 regulates cell adhesion by binding to the somatomedin B domain of vitronectin.
J Cell Physiol 189: 23-33, 2001.
19. Deussing J, Kouadio M, Rehman S, Werber I, Schwinde A and Peters C. Identification 60
and characterization of a dense cluster of placenta-specific cysteine peptidase genes and related genes on mouse chromosome 13. Genomics 79: 225-240, 2002.
20. Devy L, Blacher S, Grignet-Debrus C, Bajou K, Masson V, Gerard RD, Gils A, Carmeliet G, Carmeliet P, Declerck PJ, Noel A and Foidart JM. The pro- or
antiangiogenic effect of plasminogen activator inhibitor 1 is dose dependent. FASEB J 16: 65
147-154, 2002.
21. Floridon C, Nielsen O, Holund B, Sweep F, Sunde L, Thomsen SG and Teisner B. Does plasminogen activator inhibitor-1 (PAI-1) control trophoblast invasion? A study of fetal and maternal tissue in intrauterine, tubal and molar pregnancies. Placenta 21: 754-762, 2000.
70
22. Ge Y DS and Speed TP. Resampling-based multiple testing for microarray data analysis.
TEST 12 1-44, 2003.
24. Georgiades P, Ferguson-Smith AC and Burton GJ. Comparative developmental anatomy of the murine and human definitive placentae. Placenta 23: 3-19, 2002. 75
25. Gutierrez LS, Schulman A, Brito-Robinson T, Noria F, Ploplis VA and Castellino FJ. Tumor development is retarded in mice lacking the gene for urokinase-type plasminogen activator or its inhibitor, plasminogen activator inhibitor-1. Cancer Res 60: 5839-5847, 2000.
26. Halperin R, Fleminger G, Kraicer PF and Hadas E. Desmin as an immunochemical 80
marker of human decidual cells and its expression in menstrual fluid. Hum Reprod 6: 186-189, 1991.
27. Hirashima M, Lu Y, Byers L and Rossant J. Trophoblast expression of fms-like tyrosine kinase 1 is not required for the establishment of the maternal-fetal interface in the mouse placenta. Proc Natl Acad Sci U S A 100: 15637-15642, 2003.
85
28. Hu ZY, Liu YX, Liu K, Byrne S, Ny T, Feng Q and Ockleford CD. Expression of tissue type and urokinase type plasminogen activators as well as plasminogen activator inhibitor type-1 and type-2 in human and rhesus monkey placenta. J Anat 194 ( Pt 2): 183-195, 1999.
29. Irizarry RA, Hobbs B, Collin F, Beazer-Barclay YD, Antonellis KJ, Scherf U and Speed TP. Exploration, normalization, and summaries of high density oligonucleotide array 90
30. Kawai J, Shinagawa A, Shibata K, Yoshino M, Itoh M, Ishii Y, Arakawa T, Hara A, Fukunishi Y, Konno H, Adachi J, Fukuda S, Aizawa K, Izawa M, Nishi K, Kiyosawa H, Kondo S, Yamanaka I, Saito T, Okazaki Y, Gojobori T, Bono H, Kasukawa T, Saito R, Kadota K, Matsuda H, Ashburner M, Batalov S, Casavant T, Fleischmann 95
W, Gaasterland T, Gissi C, King B, Kochiwa H, Kuehl P, Lewis S, Matsuo Y, Nikaido I, Pesole G, Quackenbush J, Schriml LM, Staubli F, Suzuki R, Tomita M, Wagner L, Washio T, Sakai K, Okido T, Furuno M, Aono H, Baldarelli R, Barsh G, Blake J, Boffelli D, Bojunga N, Carninci P, de Bonaldo MF, Brownstein MJ, Bult C, Fletcher C, Fujita M, Gariboldi M, Gustincich S, Hill D, Hofmann M, Hume DA, Kamiya M, 100
Lee NH, Lyons P, Marchionni L, Mashima J, Mazzarelli J, Mombaerts P, Nordone P, Ring B, Ringwald M, Rodriguez I, Sakamoto N, Sasaki H, Sato K, Schonbach C, Seya T, Shibata Y, Storch KF, Suzuki H, Toyo-oka K, Wang KH, Weitz C, Whittaker C, Wilming L, Wynshaw-Boris A, Yoshida K, Hasegawa Y, Kawaji H, Kohtsuki S and Hayashizaki Y. Functional annotation of a full-length mouse cDNA collection. Nature 105
409: 685-690, 2001.
31. Kobayashi TK and Yakushiji M. Gastric carcinoma metastatic to the bone marrow: immunoperoxidase identification of KMO-1 antigen in MGG-destained aspirate. Diagn
Cytopathol 7: 597-600, 1991.
32. Lambert V, Munaut C, Carmeliet P, Gerard RD, Declerck PJ, Gils A, Claes C, 110
Foidart JM, Noel A and Rakic JM. Dose-dependent modulation of choroidal
neovascularization by plasminogen activator inhibitor type I: implications for clinical trials.
33. Lambert V, Munaut C, Noel A, Frankenne F, Bajou K, Gerard R, Carmeliet P, Defresne MP, Foidart JM and Rakic JM. Influence of plasminogen activator inhibitor 115
type 1 on choroidal neovascularization. FASEB J 15: 1021-1027, 2001.
34. Lund LR, Romer J, Bugge TH, Nielsen BS, Frandsen TL, Degen JL, Stephens RW and Dano K. Functional overlap between two classes of matrix-degrading proteases in wound healing. EMBO J 18: 4645-4656, 1999.
35. Maillard C, Bouquet C, Petitjean M, Mestdagt M, Frau E, Jost M, Masset A, Opolon 120
P, Beermann F, Abitbol M, Foidart JM, Perricaudet M and Noel A. Reduction of brain metastases in plasminogen activator inhibitor-1 deficient mice with transgenic ocular tumors. Carcinogenesis 2008.
36. Maillard C, Jost M, Romer MU, Brunner N, Houard X, Lejeune A, Munaut C, Bajou K, Melen L, Dano K, Carmeliet P, Fusenig NE, Foidart JM and Noel A. Host
125
plasminogen activator inhibitor-1 promotes human skin carcinoma progression in a stage-dependent manner. Neoplasia 7: 57-66, 2005.
37. Mason RW. Emerging functions of placental cathepsins. Placenta 29: 385-390, 2008.
38. McMahon GA, Petitclerc E, Stefansson S, Smith E, Wong MK, Westrick RJ,
Ginsburg D, Brooks PC and Lawrence DA. Plasminogen activator inhibitor-1 regulates 130
39. Noel A, Maillard C, Rocks N, Jost M, Chabottaux V, Sounni NE, Maquoi E, Cataldo D and Foidart JM. Membrane associated proteases and their inhibitors in tumour
angiogenesis. J Clin Pathol 57: 577-584, 2004.
40. Orwig KE, Ishimura R, Muller H, Liu B and Soares MJ. Identification and 135
characterization of a mouse homolog for decidual/trophoblast prolactin-related protein.
Endocrinology 138: 5511-5517, 1997.
41. Pepper MS. Positive and negative regulation of angiogenesis: from cell biology to the clinic. Vasc Med 1: 259-266, 1996.
42. Rakic JM, Lambert V, Devy L, Luttun A, Carmeliet P, Claes C, Nguyen L, Foidart 140
JM, Noel A and Munaut C. Placental growth factor, a member of the VEGF family, contributes to the development of choroidal neovascularization. Invest Ophthalmol Vis Sci 44: 3186-3193, 2003.
43. Rakic JM, Maillard C, Jost M, Bajou K, Masson V, Devy L, Lambert V, Foidart JM and Noel A. Role of plasminogen activator-plasmin system in tumor angiogenesis. Cell 145
Mol Life Sci 60: 463-473, 2003.
44. Rawn SM and Cross JC. The evolution, regulation, and function of placenta-specific genes. Annu Rev Cell Dev Biol 24: 159-181, 2008.
46. Sartori MT, Serena A, Saggiorato G, Campei S, Faggian D, Pagnan A and Paternoster 150
DM. Variations in fibrinolytic parameters and inhibin-A in pregnancy: related hypertensive disorders. J Thromb Haemost 6: 352-358, 2008.
47. Screen M, Dean W, Cross JC and Hemberger M. Cathepsin proteases have distinct roles in trophoblast function and vascular remodelling. Development 135: 3311-3320, 2008.
48. Solberg H, Rinkenberger J, Dano K, Werb Z and Lund LR. A functional overlap of 155
plasminogen and MMPs regulates vascularization during placental development.
Development 130: 4439-4450, 2003.
49. Soundararajan R and Rao AJ. Trophoblast 'pseudo-tumorigenesis': significance and contributory factors. Reprod Biol Endocrinol 2: 15, 2004.
50. Teesalu T, Blasi F and Talarico D. Expression and function of the urokinase type 160
plasminogen activator during mouse hemochorial placental development. Dev Dyn 213: 27-38, 1998.
51. Teng YC, Lin QD, Lin JH, Ding CW and Zuo Y. Coagulation and fibrinolysis related cytokine imbalance in preeclampsia: the role of placental trophoblasts. J Perinat Med 37: 343-348, 2009.
52. Varanou A, Withington SL, Lakasing L, Williamson C, Burton GJ and Hemberger M. The importance of cysteine cathepsin proteases for placental development. J Mol Med 84: 305-317, 2006.
53. von Steinburg SP, Kruger A, Fischer T, Mario Schneider KT and Schmitt M. Placental expression of proteases and their inhibitors in patients with HELLP syndrome. Biol Chem 170
390: 1199-1204, 2009.
54. Wikstrom AK, Nash P, Eriksson UJ and Olovsson MH. Evidence of increased oxidative stress and a change in the plasminogen activator inhibitor (PAI)-1 to PAI-2 ratio in early-onset but not late-early-onset preeclampsia. Am J Obstet Gynecol 201: 597-598, 2009.
Gene Accession N° Sequence Size PCR product T° 28S rRNA-FP 28S rRNA-RP U13369 5’-GTTCACCCACTAATAGGGAACGTGA-3’ 5’-GATTCTGACTTAGAGGCGTTCAGT-3’ 212 bp 66°C PrlpF-FP PrlpF-RP NM_011168 5’-GGACGAAGCTCAACAGATTCC-3’ 5’-CCAGAAAAGACGGTGTATTCCA-3’ 252 bp 54°C Psg19-FP Psg19-RP NM_011964 5’-CCGGGAAGACACAGGATATT-3’ 5’-TGTGAACACGGAGAAGAACG-3’ 194 bp 54°C Psg21-FP Psg21-RP NM_027403 5’-TTGCTGGAGCTGAAGGTTTT-3’ 5’-CGTGTTTTGGTGACTGGATG-3’ 184 bp 54°C Psg28-FP Psg28-RP NM_054063 5’-CCCTGTGGATCCAAAATGTC-3’ 5’-GCTGGTCGGCACTAATTCAA-3’ 179 bp 54°C Tpbpb-FP Tbppb-RP AY034576 5’-CAGCTGCTATAATCCCTGAACC-3’ 5’-CATCAACAACTGGCTGTGTTTT-3’ 255 bp 58°C CtsM-FP CtsM-RP NM_022326 5’-CTATCTTCCTGGCCATGCTC-3’ 5’-ACCAAAGGCATTCATTTCCA-3’ 233 bp 60°C Ctse-FP Ctse-RP NM_007799 5’-TCCATCCATCGCAGTCCGACA-3’ 5’- TGCTGGCCATCCACAGTCAACC-3’ 133 bp 58°C Cts3-FP Cts3-RP NM_026906 5’-CCTAATGAGTGCTGTGGCAA-3’ 5’-CCCAGGCTGTTCTTGATGAT-3’ 213 bp 60°C Cts8-FP Cts8-RP NM_019541 5’-ACCCTGAACGTTCTGCTGCTAGAAT-3’ 5’-TCCGATAGTTGCTACAGCACGCAT-3’ 89 bp 58°C Flt1-FP Flt1-RP NM_010228 5’-CACAGGATATGGCTCAGGGTCGAAGT-3’ 5’-ATGGGGGAGTGATGCTCAGCGTTT-3’ 179 bp 60°C
Figure 1:
Quantification method of maternal vessels, foetal vessels and trophoblast cells by computer-assisted image analysis. (a) Histological cross-section of labyrinth, (b) Window with isolated labyrinth layer, (c) Windows allowing the identification of maternal vessels, (d) foetal vessels and (e) trophoblast cells. (f) Binary images of maternal vessels, (g) foetal vessels and (h) trophoblast cells.
Figure 2:
Labyrinth and decidua histology in implantation sites of PAI-1+/+ (left panels) and PAI-1-/- (right panels) mice at 10.5 dpc. A-B: May-Grümwal-Giemsa staining of labyrinth layer. Foe: Foetal blood vessels; Ma: Maternal blood vessels; Tro: Trophoblast cells. C-D: Trophoblast cells staining using anti-keratin Ab. E-F: Labeling of foetal blood vessels using MECA-32 Ab in the labyrinth layer. G-H: Labeling of the decidua using anti-desmin Ab. I-J: labeling of cells proliferation using Ki-67 Ab. De: Decidua; Lab: Labyrinth; Sp: Spongiotrophoblast.
Figure 3:
A, B and C: Quantification of foetal and maternal blood vessels and trophoblast cell density at 10.5 dpc, in PAI-1+/+ and PAI-1-/- mice. Quantification was performed according to the computer-assisted method described in materials and methods and in Fig 1. A: Foetal blood vessel density. B: Maternal blood vessel density. C: Trophoblast cells density. D: Decidua/ labyrinth ratio was determined by measuring the thickness of the decidua and the labyrinth on microscopic images of foeto-placental units stained with hematoxylin-eosine. Five different
measurements were performed for each sample and results represent the average of all values. The number of implantation sites analyzed is indicated in each graph (n).
Figure 4:
Labyrinth, spongiotrophoblast and decidua histology and blood vessel architecture in implantation sites of PAI-1+/+ (left panels) and PAI-1-/- (right panels) at 12.5 dpc. A-B: Overview of the labyrinth layer with hematoxylin&eosin staining. C-D: Fluorescent labeling of trophoblast cells using anti-keratin Abs. E-F: Labeling of foetal blood vessels in the labyrinth layer using MECA-32 Abs.
De: Decidua; Lab: Labyrinth; Sp: Spongiotrophoblast.
Figure 5:
Calculation of the Spongiotrophoblast/labyrinth (A) and decidua/ labyrinth (B) ratios at 12.5 dpc in PAI-1+/+ and PAI-1-/- mice. Decidua, spongiotrophoblast and labyrinth thickness were measured on microscopic images of hematoxylin-eosine stained sections of feto-placental unity as described in materials and methods. Five different measurements were performed for each sample and results represent the average of all values. The number of implantation sites analyzed is indicated (n).
Figure 6: Venn diagram illustration of genes differentially modulated between PAI-1+/+ and PAI-1-/- at 10.5 and 14.5 dpc by. The 38 genes modulated at 10.5 dpc are listed according to their association with or exclusive expression in murine placental cells.
Figure 7:
Semi-quantitative RT-PCR analysis with the same RNA samples used in the transcriptomic analysis. Results are expressed as the mRNA ratio in PAI-1+/+ to PAI-1-/- at 10.5 and 14.5 dpc. PAI-1+/+/PAI-1-/- ratio of Psg19 (A), Psg21 (B), Psg28 (C), Prlpf (D), Tpbpb (E), Cts3 (F), CtsM (G), Cts E (H) Cts 8 (I) and Flt1 (J). Line indicate the value 1 of PAI-1+/+/PAI-1-/- ratio.