Network Fingerprinting
Emeline Marechal∗and Benoit Donnet
Montefiore Institue, Belgium
E-mail: [email protected]; [email protected]
∗Corresponding Author
Received 30 November 2020; Accepted 01 December 2020; Publication 23 March 2021
Abstract
Nowadays, simple tools such as traceroute can be used by attackers to acquire topology knowledge remotely. Worse still, attackers can use a lightweight fingerprinting technique, based on traceroute and ping, to retrieve the routers brand, and use that knowledge to launch targeted attacks. In this paper, we show that the hardware ecosystem of network operators can greatly vary from one to another, with all potential security implications it brings. Indeed, depending on the autonomous system (AS), not all brands play the same role in terms of network connectivity and network usage (MPLS vs. standard traffic). An attacker could find an interest in targeting a specific hardware vendor in a particular AS, if known defects are present in this hardware, and if the AS relies heavily on it for forwarding its traffic.
Keywords: Network fingerprinting, traceroute, ping, MPLS, attack,
connec-tivity.
1 Introduction
Fingerprinting [20, 23] is defined as the process of splitting network
equip-ment into several disjoint classes. This is achieved by analyzing messages Journal of Cyber Security and Mobility, Vol. 10 2, 347–376.
doi: 10.13052/jcsm2245-1439.1022 © 2021 River Publishers
sent by equipment and their behavior, usually in response to some form of active probing. As such, fingerprinting is an expensive process as it could require many probes to be sent, and thus time consuming [23]. In addition, too many probes towards a network node or a subnet could easily appear as an attack and, consequently, be filtered by the target. Recently, Vanaubel et al. [42] have proposed a lightweight network fingerprinting technique that is based on inferring the initial TTL values in packets sent by routers. Vanaubel et al. have shown that it is enough to obtain the initial TTL of two ICMP messages (i.e., time-exceeded and echo-reply– the so-called
router signature) to guess the router hardware vendor.
Providing such a fingerprinting is useful for several applications and studies. For instance, it has been used in alias resolution (i.e., the process of aggregating IP interfaces of a router into a single identifier) [16, 43]. It has also been used for revealing the content of MPLS tunnels hidden to traceroute, as some MPLS behaviors depend on the hardware vendor (mainly Cisco vs. Juniper) [40].
In this paper, we extend our previous work [27] by relying on an updated dataset1and by answering two research questions:
1. beyond the classic hardware vendor market share (i.e., proportion of Cisco vs. proportion of Juniper, etc.), we ask ourselves what is the
hardware ecosystem within Internet and operators?. In particular, we are
interested in describing the potential role they could play in the topology. Our findings in this paper show that, if Cisco largely dominates the overall market, this is not reflected when looking on a per autonomous system (AS) basis, where the distribution is more blurred.
Compared to our previous work, we also focus on MPLS [34] aspects and how the router hardware is used within MPLS tunnels. Moreover, we show that label values used by operators can extend the fingerprinting technique of Vanaubel et al. [42] and help us identify hardware vendors. 2. if knowing the hardware ecosystem of an AS is straightforward and not that intrusive, we ask ourselves what could happen if an attacker can
easily identify router brands and target specific vendor with (known) security breaches? This question is motivated by the recent five
vul-nerabilities found in various Cisco devices (four of them leading to remote code execution vulnerabilities, and one to a Denial of Service vulnerability) [17] and by the discovery of Bleichenbacher oracles [9]
1
We work on the most recent TNT data and also make use of a novel alias resolution technique, Apple [25], to further refine our view of the operators’ networks
(i.e., an adaptive chosen ciphertext attack against some protocols based on RSA) in the IKEv1 implementations of four large network equipment manufacturers (Cisco, Huawei, Clavister, and ZyXEL) [15].
Those attacks are not limited to a few scattered devices, but could affect many different hardware models for each manufacturer, as the vulner-abilities are found in software common to many different products. If an attacker is able to easily identify unsecured equipment within an AS, they could easily target it and possibly disrupt the AS connectivity. Generally speaking, the attack could affect the AS connectivity or use the AS equipment for performing a larger-scale attack (e.g., DDoS). In this paper, we focus on connectivity loss, as result of the attack. In particular, we show that it is enough for an attacker to target an AS and a few devices (of a given brand) to affect its connectivity.
Compared to our previous work, we also investigate attacks from a multi-layer perspective with MPLS. We show that the network is more vulnerable to attacks than it appears from a single layer perspective, when looking only at the routing devices, without considering the MPLS layer. This is particularly relevant because what ultimately matters in a multi-layer system is the upper-most layer, as it is a reflection of the service provided by the system to its users.
The remainder of this paper is organized as follows: Section 2 describes how fingerprinting can be a valuable tool for an attacker and pose a threat for operators; Section 3 provides the required background for this paper; Section 4 discusses ASes hardware ecosystem (Research Question 1); Section 5 dives into MPLS labels and how they can be used to further refine our view of the hardware ecosystem; Section 6 illustrates the impact of routers failures due to attacks (Research Question 2) and provides mitigation solutions to operators and hardware vendors; finally, Section 7 concludes this paper by summarizing its main achievements.
2 Motivation
We present in this section how fingerprinting could represent a great asset for someone with bad intentions. Attacks in the Internet are commonly performed by worms [44], i.e., pieces of software able to spread in the Network without human interaction. This makes them incredibly faster than viruses, that need a human to take action before they can infect a machine (e.g., emails). Worms are able to infect machines by scanning IP addresses
and compromising any vulnerable target computer they encounter in their scanning.
Worms can have different scanning strategies, making them more or less efficient in infecting targets. The simplest of worms use random scanning, a strategy where they scan the entire IPv4 space to find vulnerable machines. Some more advanced strategies use preference scanning for example, with a higher probability to scan an address within the same “/16” or “/8” network than a random address, in order to focus on a particular area of the network. Other strategies exist as well, and have been referenced and studied [46].
The key component when designing a scanning strategy is to reduce as much as possible the scanning space, in order not to waste time and resources on machines that are immune or that do not interest the attacker. The most efficient scanning strategy is a hit-list worm [37], that builds a list of IP addresses of vulnerable hosts into worm code and thus shorten their propagation time. Indeed, Staniford et al. showed that a hit-list worm can infect all vulnerable hosts on its hit-list within just several seconds [37].
Applying the same line of though, Zou et al. [47] presented what they call a routing worm, that uses BGP information to reduce its scanning space without ignoring any potential vulnerable computer. They show this worm can propagate twice to more than three times faster than a traditional worm. In addition, the geographic information that comes with BGP enables such routing worms to conduct fine-grained selective attacks on a specific country, an Internet Service Provider (ISP), or an Autonomous System (AS), without much collateral damages done to others [47].
Combined together, a hit-list and a routing worm form an optimal spread-ing worm, both reducspread-ing its scannspread-ing space and increasspread-ing its speed by knowing addresses of a large number of vulnerable hosts.
Until now, such a worm was admittedly the best propagating worm, but was rather a theoretical concept, as there was no way to build such a hit-list. With fingerprinting however, it is now possible to easily determine which hosts in the network are vulnerable, and boost the worm’s efficiency with a list of IP addresses belonging to a certain brand of router. Fingerprinting can thus pose a real threat as it facilitates worm propagation with topological information.
Although a hit-list+routing worm is much faster than a random scanning worm, the latter can still achieve impressive propagation speed with a very high scan-rate. This is the case of Slammer [29], a well-known worm that infected 90% of its vulnerable population in only 10 minutes. However, the worm quickly dropped its spreading speed as the Internet was congested by
massive traffic sent out from a large number of infected hosts. Many routers and switches crashed under the load, and this disruption to legitimate traffic was actually more harmful than the worm itself.
Despite Slammer’s incredible speed (without using a hit-list), an attacker can still benefit from building such a list, if their goal is to remain under the radar. Indeed, Slammer’ scanning technique was so aggressive that it quickly saturated the network and was noticed early on by operators. With a hit-list, an attacker is able to fine-tune their worm to avoid detection, while achieving the same result as a fast-scanning worm that would fire away as quickly as possible and get spot, whether it is by humans or by an Intrusion Detection System (IDS).
Therefore, as they recommend in [46], it is crucial to prevent attackers from easily identifying the IP addresses of a large number of potentially vulnerable hosts, or more generally, from obtaining any information that can dramatically reduce a worm’s scanning space. In Section 6.3, we present several mitigation techniques for operators to protect themselves against fingerprinting, and all the security implications it brings.
3 Background
This section introduces the required background for this paper. In particular, it describes the fingerprinting technique (Section 3.1) we use for identifying router vendors, as well as the main features of MPLS (Section 3.2)
3.1 Fingerprinting
The IP packet header contains a time-to-live (TTL) field used to avoid packets looping forever when a routing loop occurs. This 8-bit field is set by the originating host/router to an initial value (iTTL) that is usually and nearly always a power of 2 in the list 32 (or 30), 64, 128, and 255. RFC1700 [31] recommends to use 64 as iTTL value but in practice, this is not followed by most router manufacturers, each one having its own policy that may also depend on the protocol used [42].
Based on that, Vanaubel et al. [42] have proposed a router signature made of a n-tuple of n iTTLs, those iTTLs being retrieved from different ICMP messages received from routers.2
2
To estimate the iTTL forged by the router, it is enough to find the smallest number in 32, 64, 128, 255 that is larger than the received value in the TTL field of the IP packet encompassing the ICMP message.
Table 1 Summary of main router signature – the first initial TTL of the pair corresponds to ICMP time-exceeded, while the second is for ICMP echo-reply
Router Signature Router Brand and OS < 255, 255 > Cisco (IOS, IOS XR) < 255, 64 > Juniper (Junos) < 128, 128 > Juniper (JunosE)
< 64, 64 > Brocade, Alcatel, Linux (BAL)
Vanaubel et al. have demonstrated that it is sufficient to consider the iTTL of two different messages (i.e., n = 2) to discriminate hardware vendors basic pair-signature: a time-exceeded message elicited by a traceroute probe, and an echo-reply message obtained from an echo-request probe. The advantage, here, is that router signatures can be easily retrieved with basic traceroute and ping exploration.
Table 1 summarizes the main router signatures, with associated router brands and router OSes.
3.2 MPLS
MPLS Operations
The Multiprotocol Label Switching (MPLS) [34] is a forwarding technology initially designed to speed up the forwarding process. Nowadays, MPLS has two main usages: (i) a basic encapsulation technique allowing to trans-parently transmit packets through an MPLS domain using best effort IP routes computed by an Interior Gateway Protocol (IGP), and (ii) a traffic engineering (TE) tool allowing to better control routing and resources used by some flows [36, 45].
In practice, one or more MPLS headers (called Label Stack Entry – LSE) are inserted in a packet between the data-link layer and the IP layer. Each LSE is 32-bit long and contains a 20-bit label value used for forwarding the packet, based on an exact look-up of the label, to the next router (instead of using the destination IP address). At each MPLS hop, the label of the incoming packet is replaced by a corresponding outgoing label found in the Label Information Base (LIB).
MPLS routers, called Label Switching Routers (LSRs), exchange labeled packets over Label Switched Paths (LSPs). The first MPLS router is called the
Ingress and is responsible for tagging incoming packets with a label. Packets
0 19 20 22 23 24 31
Label TC S LSE-TTL
Figure 1 The MPLS label stack entry (LSE) format.
which is called the Egress. The series of LSRs that carried the packets form the LSP, or put more simply, the MPLS tunnel.
MPLS Label Distribution
MPLS tunnels need to be built and installed into LSRs by distributing MPLS labels and their semantic in the MPLS LIB. According to the intended usage of MPLS, a different protocol will be used to allocate and propagate the labels [41].
Using the Resource Reservation Protocol TE (RSVP-TE) [7] allows operators to deploy tunnels for TE purposes, and to reserve resources along the path. On the other hand, using the Label Distribution Protocol (LDP) [5] on top of an IGP (such as IS-IS or OSPF) allows to use the routes computed by the IGP but to encapsulate and forward the packets with the MPLS technology.3
In the remainder of this paper, we will refer to tunnels as either RSVP-TE tunnels or LDP tunnels. Finally, note that the RSVP-TE signaling protocol may be used conjointly with LDP or not. These two protocols are independent even if there is no reason to use only RSVP-TE for specific purposes without using LDP globally within the network.
Revealing MPLS Tunnels
The LSE is made of four fields, as illustrated in Figure 1: a 20-bit label value used for forwarding the packet to the next router, a 3-bit Traffic Class field for quality of service (QoS), priority, and Explicit Congestion Notification (ECN) [4], a 1-bit bottom of stack flag (when set the current label is the last in the stack [33]), and an 8-bit time-to-live (LSE-TTL) field having the same purpose as the IP-TTL field [3]. This means that MPLS routers may send ICMP time-exceeded messages when the LSE-TTL expires, just like a classic IP router would do.
For a packet entering a tunnel, the LSE-TTL field can be set differently according to the router configuration. The IP-TTL can either be copied to
3It is worth noting that other usages of MPLS can also be made, such as MPLS for
the LSE-TTL, in which case the different LSRs in the tunnel will reveal themselves with a classic traceroute exploration via ICMP messages. Or an arbitrary value, such as 255, can be written in the LSE-TTL field, effectively hiding the tunnel from traceroute. Operators can configure this action using the ttl-propagate option provided by the router man-ufacturer [3]. Additionally, routers may also implement RFC4950 [10], an extension to ICMP allowing a router to embed an MPLS LSE in an ICMP time-exceeded message. This feature allows to doubtlessly identify MPLS routers, as the LSE is directly quoted in the ICMP message (those tunnels are called explicit by Donnet et al. [14]).
The combination of these two features (ttl-propagate and RFC4952) has an impact on the discovery of MPLS tunnels with traceroute [14]. In addition to explicit tunnels, TNT is able to reveal implicit (i.e., tunnels with ttl-propagate enabled but RFC450 disabled) as well as some invisible tunnels (i.e., tunnels with no-ttl-propagate and RFC4950 disabled).
4 Hardware Ecosystem
In this section, we discuss our first research question: what is the hardware
ecosystem within Internet and operators? We first present how data has
been collected and pre-processed (Section 4.1). Next, we check the signature coherence for both IP interfaces and routers (Section 4.2). After this, we provide some insight into hardware distribution (Section 4.3) and emphasize on MPLS tunnels (Section 4.4). Finally, we discuss the limits of our approach (Section 4.5).
4.1 Data Collection
We collected data using TNT [22, 39], a Paris-traceroute [6] extension that is able to reveal the content of MPLS tunnels hidden to traceroute exploration [40], revealing so more links and IP interfaces than standard traceroute exploration. TNT comes with the advantage that it also auto-matically collects the signature for each collected IP interface.
We deployed TNT on the EdgeNet infrastructure [38] between October 3rd and 8th, 2020 over 15 vantage points, scattered all around the world: Europe (6), North America (2), South America (3), Asia (2), and Australia (2). The overall set of destinations, over 10 million IP addresses, is inherited from the Archipelago dataset [11] and spread over the 15 vantage points to speed up the probing process. Our raw dataset is available at http://gofile.me/2PfYg/b rtxHbu2W.
Table 2 Signature coherence – for both IP addresses and routers (after alias resolution)
IP Router
Coherent 89,1% 94,9%
Weakly incoherent 10,8% 4,8%
Incoherent 0.1% 0,3%
A total of 938,399 distinct unique IP addresses (excluding traceroute targets) have been collected, with 34,297 being non-publicly routable addresses (and thus excluded from our dataset).
We then used MIDAR[19], a tool based on similarities in the IP-ID field, to perform alias resolution on our set of addresses. Alias resolution [18] is the process of identifying IP addresses that belong to the same router, and can thus yield a router-level topology from the address-level topology provided by traceroute. This more concrete topology can then be used, among other purposes, to study more precisely the physical infrastructure of routers, their diversity, and the resiliency of the infrastructure. Out of the 900k addresses discovered by TNT, MIDARfound 36,999 routers involving 91,037 addresses. Additionally, we used Apple [25], a new technique for resolving router IP aliases that complements existing techniques, such as MIDAR. Applewas able to find 26,808 routers involving 87,492 addresses. In combination with MIDAR, we were thus able to further refine our alias resolution with a total of 53,011 routers involving 154,439 addresses, which represents an increase in coverage of 43% compared to the initial results with MIDAR.
Finally, from the router dataset obtained with MIDAR and Apple, we applied bdrmapIT [26], a tool for annotating routers with AS ownership. The objective here is to delimit as accurately as possible ASes in order to better study their hardware infrastructure. Studying the Internet at the scale of ASes, rather than at a global scale, is more meaningful because each AS is an independent network, operated by different people with different policies and technologies. This scale provides thus a more refined vision of the hardware distribution, with all potential implications for network resiliency and security. Moreover, focusing on individual ASes when discussing routers under attack is more realistic than envisioning a world-wide attack.
4.2 Address and Router Signature Coherence
In order to evaluate the coherence of the collected fingerprints, we first check if the same data collected multiple times by TNT always corresponds to the
same signature. Following Vanaubel et al. [42] vocabulary, IP addresses can either be (i) coherent (i.e., the same signature is always observed for that address), (ii) weakly incoherent (i.e., two signatures are observed for a given IP address, one being an incomplete version of the other – e.g., < x, y > and < x,∗ >), and, (iii) incoherent (i.e., several different signatures are observed for a given address). We extend this vocabulary to routers, where the coherence of a router is determined by the signature of each of its addresses. Table 2 reports the results for both IP addresses and routers.
We observe that the majority of IP addresses signatures are coherent, which is the perfect case for us, as there is no ambiguity in the finger-print. Weakly incoherent signatures are slightly significant, probably due to overloading, rate limiting, or filtering on routers, which prevent the device to answer to one of the two probes. As such, we can simply consider the signature of these addresses to be the complete one of the two. Finally, incoherent IP signatures are very infrequent. Only 0.1% of the addresses cannot be classified into a router brand, and have therefore been removed from our data.
With respect to routers, an even greater majority of routers are coherent, meaning that all interfaces of the router show the same signature. A small portion of routers are weakly incoherent, and, as for addresses, we consider the signature of a router to be the complete one among its interfaces. Finally, we cannot conclude anything regarding the brand of a router for only 0.2% of the routers. Note that these fingerprinting results are consistent with the alias resolution process. Indeed, it is expected, by definition, that addresses showing different signatures cannot share a router, which is confirmed in our results.
4.3 Hardware Distribution The big picture
Leveraging the fingerprinting method, we can have a look at the hardware dis-tribution in the network. Figure 2 illustrates the global signature disdis-tribution for both addresses and routers in the Internet.
Regarding addresses, we notice that Cisco signatures are largely dom-inant, with more than 40% of addresses in that class. The second most important class is the BAL class (i.e., Brocade, Alcatel, and Linux machines) with around 22% of addresses. After that, with a share of 16% of the addresses, comes the signature < 255,∗ >. This signature is an incomplete one, meaning that the device answered to the traceroute probe, but not to
Cisco Junos BAL <255 , ∗> <64 , 255 > <64 , ∗> JunosE <128 , ∗>Others Signatures 0.0 0.1 0.2 0.3 0.4 0.5 Prop ortion addresses routers
Figure 2 Big picture of hardware distribution – for both addresses and routers (complete dataset).
the ping one. This class is probably made of addresses that actually belong either to < 255, 255 > (Cisco) or < 255, 64 > (Junos) classes. Based only on this signature, we are unable to discern between them, because those routers did not answer to the second probe. In Section 5, we jointly analyze MPLS labels and router brands, which allows us to assign Cisco or Junos with a certain likelihood for some < 255,∗ > signatures. Finally, the fourth most important class is the Junos one, with approximately 11% of the market share. The remaining signatures (including JunosE) are quite rare.
Looking at routers now, we can observe that the signature distribution is extremely different. Cisco routers are still largely dominating the other brands, with nearly 60% of the devices. Next comes the Junos class, followed by BAL, followed by the < 255,∗ > incomplete signature, which has become almost non-existent. At first sight, we may think that the router topology, derived from the address topology with alias resolution, provides the actual hardware distribution in the Internet and corrects previous believes about the share of the market, when looking only at addresses. However, when looking at those results, we must keep in mind that alias resolution remains an imperfect process despite considerable progress in this domain, as discussed in Section 4.5.
Large ASes
For the remainder of this paper, we restrict ourselves to seven ASes of interest, in order to study the hardware distribution at a finer granularity.
Table 3 Basic data about ASes of interest – AS numbers have been anonymized AS # IP # Router # Traces A 428 165 45,964 B 2,511 892 608,305 C 896 180 721,584 D 762 224 586,879 E 630 140 138,217 F 510 93 53,347 G 1,116 404 481,895 A B C D E F G ASes 0.0 0.2 0.4 0.6 0.8 1.0 Prop ortion Cisco Junos BAL < 255,∗ > JunosE Others
Figure 3 Hardware distribution, per AS.
To do so, as mentioned in Section 4.1, we used bdrmapIT for annotating routers with their AS number. For security reasons (see Section 6), we have anonymized AS numbers. Table 3 provides high level statistics on those ASes: the number of routers, as well as the number of IP addresses involved in those routers. The column labeled “# Traces” provides the number of TNT traces crossing each AS.
If the global hardware distribution (see Figure 2) stated that Cisco largely dominates the market, the situation differs within our seven ASes of interest, as illustrated by Figure 3. Indeed, only AS A and AS B are dominated by Cisco, while AS E and AS F are relying nearly only on Junos. AS G uses a nearly equal mix of BAL and Junos. Finally, AS C and AS D deploy essentially Junos with Cisco. It is now obvious that different operators can
A B C D E F G ASes 0.0 0.2 0.4 0.6 0.8 Prop ortion of traces Cisco Junos BAL < 255,∗ > JunosE Others
Figure 4 Hardware popularity, per AS.
have very different hardware infrastructure, with all potential implications for network resiliency and security.
Finally, anticipating on Section 6, we present for each AS the hardware
popularity in Figure 4. Similarly to Sanchez et al. [35], we measure the
hardware popularity as the proportion of TNT traces crossing each hardware brand. While the hardware distribution is already a first indicator of the topological importance of a brand in terms of connectivity, the popularity of a brand reflects more accurately the notion of topological importance than the distribution does. Indeed, and this is particularly true for Internet networks, not all nodes play the same role in terms of connectivity and some are more important than others (see Section 6.1). As such, it could turn out that, although a brand is largely represented in the network, the role it plays in terms of connectivity and in terms of traffic volume it carries is not as important.
We find that the hardware popularity is relatively close to the hardware distribution for our seven ASes of interest, with some notable exceptions. For several ASes (AS A, B, E, F), the dominating brand in terms of hardware share is also the brand that plays a major role in terms of traffic. For AS C however, the hardware popularity is quite different from the hardware repartition. Here we see that Junos routers, that represent approximately 60% of the routing devices in the AS, attract almost 80% of the traffic. The situation is the same with AS C: in terms of routing devices, the AS uses a nearly equal mix of BAL and Junos, but in terms of traffic, Junos is
Table 4 Main ASes MPLS stats – the column ‘Explicit (rsvp-te)‘ shows the number of
explicit tunnels remaining after applying the same filtering as Vanaubel et al. [41] and after
keeping only RSVP-TE tunnels
AS Invisible Implicit Explicit Explicit (rsvp-te)
A 0 2 74,751 24,066 B 0 296 124 30 C 5 1 6,684 3,269 D 5 1 8,110 2,450 E 0 0 10,513 5,900 F 0 0 60,816 44,895 G 2,124 0 0 0
actually more important. For those two ASes, Junos routers play a major role in forwarding the traffic.
4.4 The MPLS Case
After studying the hardware distribution, we further refine our study of the hardware ecosystem by considering various MPLS aspects of the ASes of interest. TNT is able to reveal MPLS tunnels, discovering so more IP links and interfaces than a classic traceroute exploration would. As explained in Section 3.2, those tunnels can be classified into explicit, implicit, and invisible tunnels. The number of each type of tunnel can be found in Table 4.
We see that the majority of ASes use explicit tunnels, i.e., tunnels that can be fully revealed through a classic traceroute exploration (see Section 3.2 for details). On the other hand, ASG uses only invisible tunnels, i.e., tunnels hidden to traceroute but that can be exposed by TNT (see Section 3.2 for details).
Explicit tunnels can be further classified according to their usage. Vanaubel et al. [41] developed the Label Pattern Recognition (LPR) algo-rithm, which is able to distinguish between both LDP and RSVP-TE tunnels. LPR is based on the analysis of the MPLS labels found in packets, excluding so implicit and invisible tunnels from the analysis. Therefore, for the remain-ing of the MPLS study, we will focus on explicit tunnels (and thus leave out ASG from our analysis).
The proportion of each type of tunnel (among the explicit tunnels) can be found in Figure 5.
A B D C E F ASes 0.0 0.2 0.4 0.6 0.8 1.0 Prop ortion LDP RSVP-TE LDP with LB Unknown
Figure 5 The different usages of tunnels.
Some ASes, such as AS A and AS F deploy MPLS mostly for Traffic Engineering (TE) purposes, with a proportion of 70% and 100% of RSVP-TE tunnels respectively. The other ASes decided to rather use MPLS as a forwarding technology for their whole network by deploying a majority of LDP tunnels. Nevertheless, they also deployed some RSVP-TE tunnels, with a proportion of roughly 25% of RSVP-TE tunnels in each of those ASes.
In the last column of Table 4, one can find the number of explicit tunnels remaining after applying the same filtering rules as done by Vanaubel et al. [41] and after keeping only RSVP-TE tunnels. These tunnels will form the basis for our analysis on network vulnerability in Section 6.2.
4.5 Limits
Despite considerable progress in this domain, alias resolution remains an imperfect process. All techniques present the risk of false positive, and all of them also have significant incompleteness. The inability to draw an accurate router-level map of the Internet limits what we can study, leading in this section on a lower bound of statistics discussed. Indeed, some routers will simply never be found due to routers not responding to probes, or routers that do not use monotonic counters, or do not share a counter across interfaces, making them, by definition, undetectable by any IP-ID based technique [19]. As such, using different alias resolution techniques, as we did for this study by combining Appleand MIDAR, can only lead to a more precise alias resolution, as each technique complements the others and can compensate for their respective weaknesses. Therefore, despite its shortcomings, we believe
the router level better captures hardware brand distribution than the IP level does.
5 Label Analysis
The fingerprinting technique of Vanaubel et al. [42] is currently able to distinguish between four main brands of hardware, namely Cisco, Juniper (Junos), Juniper (JunosE), and BAL (Brocade, Alactel, Linux). The technique is highly consistent (Section 4.2) and can attribute a brand to the great majority of addresses (Section 4.3). Nevertheless, a non negligible portion of addresses (16%) cannot be classified, as they present the incomplete signature < 255,∗ >. This signature means that the device answered to the traceroute probe, but not to the ping one, probably due to overloading, rate limiting, or ICMP filtering on routers, which prevent the device from answering one of the two probes.
We postulate that this < 255,∗ > class is actually made of addresses that belong either to < 255, 255 > (Cisco) or < 255, 64 > (Junos) classes. In this section, we jointly analyze MPLS labels and router brands, which allows us to assign Cisco or Junos for some < 255,∗ > addresses with a certain likelihood. We restrict our study to what we call the outer labels, i.e., the labels found in the top of the LSE stack (see Section 3.2). For the rest of the paper, we will call them labels for the sake of simplicity.
Overall, we found 512,531 distinct labels in our dataset, distributed for each router brand as illustrated in Figure 6. From this graph, we notice that Junos uses 202,573 distinct labels for its MPLS traffic, while Cisco uses only 27,534 distinct labels. For each brand, we also have the number of unique labels, that is to say, labels that have been seen only for this brand, and not for the others. 59% of Junos labels are actually unique and can be used to doubtlessly identify routers that have the incomplete signature < 255,∗ >. Likewise, 20% of the Cisco labels can serve to distinguish the brand from the others. Based on those unique labels, we were able to reclassify 10% of the addresses in the < 255,∗ > class that present MPLS labels.
We go further by analyzing the labels that the different brands have in common. Figure 7 illustrates the distribution of the MPLS label values between the different router brands. As an MPLS label is 20-bit long, and can thus take any value in the interval [0; 220− 1], we grouped labels in ranges of 30,000 values each for the sake of visualization. The upper part of the graph presents the distribution between the different router brands (Y-axis) for each range of labels (X-axis). It is worth noting that blank values in the graph
Cisco Junos BAL <255 , ∗> <64 , 255 > <64 , ∗> JunosE <128 , ∗> signatures 0 100000 200000 300000 400000 Num b er of lab els distinct labels unique labels
Figure 6 Labels distribution – for both distinct and unique labels (all labels).
< 255,∗ > Cisco Junos BAL < 64,∗ > < 255, 128 > < 64, 255 > signatures 0 30,00060,00090,000120,000150,000180,000210,000240,000270,000300,000330,000360,000390,000420,000450,000480,000510,000540,000570,000600,000630,000660,000690,000720,000750,000780,000810,000840,000870,000900,000930,000960,000990,0001,020,000 label range 105 107 ra w n um b er 0.01 0.10 0.20 0.30 0.40Proportion0.50 0.60 0.70 0.80 0.90
Figure 7 Label values distribution – the upper graph presents the distribution between the different router brands (Y-axis) for each range of labels (X-axis). The lower graph completes this information with the raw numbers of observed labels in each range (logarithmic scale). Graph for labels in common to various brands.
mean that the particular label range has not been observed for the particular router brand. The lower part of the graph completes this information with the raw numbers of observed labels in each range (logarithmic scale). We can observe, for example, that labels in the range [0; 30, 000] are seen 27% of the time for Cisco routers, 59% of the time for Junos routers, and 14% of the time for the incomplete < 255,∗ > signature. The proportions for the other brands are too low to consider them. Moreover, this range of label is extremely popular, as they have been observed 107 times. Knowing that Cisco and Junos share 9,297 distinct labels, this kind of information can be used to classify addresses in the < 255,∗ > class with a certain probability between both brands. For a classification engine, it is of course possible to consider each label value individually (instead of grouping them in range) in order to be more precise.
Looking at the graph as a whole now, we can clearly notice global pat-terns. For example, labels in the range [270, 000; 780, 000] are observed most often for Junos routers, and to a lesser extend for the incomplete signature < 255,∗ >. Proportions for Cisco routers are extremely low in this range, or even null. This means that, for addresses in the < 255,∗ > class that present MPLS labels in the [270, 000; 780, 000] range, we can assign them to the Junos class with a very high likelihood. These results are also consistent with the different labels used by each brand (Figure 6). Indeed, Cisco uses very few labels compared to Junos, which is confirmed by the Figure 7 where we see that the majority of labels used by Cisco is constrained to the range [0; 90, 000], while labels used by Junos are more widespread.
6 Routers Under Attack
In this section, we consider network attacks from two different perspectives. The first one explores attacks carried out on particular brands of routers (Section 6.1), and the second one investigates attacks on MPLS routers (Section 6.2). Finally, we give some mitigation techniques to fingerprinting for operators (Section 6.3)
6.1 Router Brands Attacks
Not all routing devices contribute equally to forwarding packets in the network. Indeed, routers can span multiple different technologies, and have different throughput capacity. There can be small routers with a few ports,
large routers with a lot of forwarding power, routers at strategic intercon-nection points, etc. Routers can also be limited by the fabric interconnecting them (cable vs. optical fiber).
Therefore, if a certain router brand contributes heavily to network connec-tivity in a particular AS, and if known defects are present in this hardware, an attacker could cause great damage with little effort by targeting this router brand in the AS. Knowing that an attacker can fairly easily fingerprint a device (with only two simple probes), it becomes even easier for them.
Knowing this, and leveraging our new understanding of the ASes hard-ware infrastructure, we now look back at our second research question: what
could happen if an attacker can easily identify router brands and target specific vendor with (known) security breaches? Indeed, we already saw in
Section 4.3 that different operators have different hardware infrastructure, and thus most likely have different levels of vulnerability to a brand-targeted attack as well.
The hardware distribution (see Figure 3) is a first coarse indicator of the sensibility to brand-targeted attacks. However, it does not a priori reflect the topological importance of a particular brand in terms of connectivity, as we saw with Figure 4. Therefore, to assess the vulnerability of an AS, we will review our hardware popularity approach, and study the number of traces (traceroute paths) impacted when a fraction of the routers are removed from the network. We consider this metric to reflect the topological impor-tance4 and to estimate which brands of routers carry traffic to a significant fraction of the Internet. Indeed, Sanchez et al. [35] showed that the popularity of a link or a router is strongly related to the amount of traffic being carried.
Methodology and results
To simulate an attack, we consider each AS separately and remove different proportions (0.001, 0.005, 0.01, 0.02, 0.05, 0.1, 0.25, 0.5, 0.75, 0.9, 1.0) of routers for four brands: Cisco, Junos, JunosE, and BAL. Each time, we count the total number of traces that go through those downed routers. For each percentage, we performed the simulation 30 times, averaged the results, and built confidence zone around the mean.
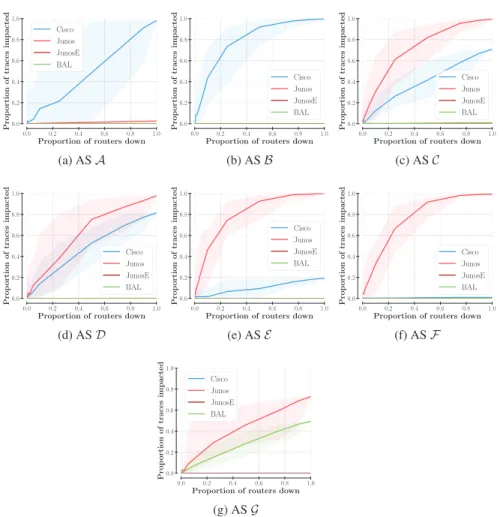
Figure 8 presents, for each AS, the number of traces impacted (Y-Axis) given a percentage of removed routers (X-Axis), for each brand. The number
4
A node that is topologically important will be sampled redundantly (multiple times) by traceroute. This is due to the traceroute exploration process that statistically focuses on topologically important nodes and links [12]. Therefore, the topological importance is reflected in the number of traces crossing a node.
0.0 0.2 0.4 0.6 0.8 1.0
Proportion of routers down
0.0 0.2 0.4 0.6 0.8 1.0 Prop ortion of traces impacted Cisco Junos JunosE BAL (a) AS A 0.0 0.2 0.4 0.6 0.8 1.0
Proportion of routers down
0.0 0.2 0.4 0.6 0.8 1.0 Prop ortion of traces impacted Cisco Junos JunosE BAL (b) AS B 0.0 0.2 0.4 0.6 0.8 1.0
Proportion of routers down
0.0 0.2 0.4 0.6 0.8 1.0 Prop ortion of traces impacted Cisco Junos JunosE BAL (c) AS C 0.0 0.2 0.4 0.6 0.8 1.0
Proportion of routers down
0.0 0.2 0.4 0.6 0.8 1.0 Prop ortion of traces impacted Cisco Junos JunosE BAL (d) AS D 0.0 0.2 0.4 0.6 0.8 1.0
Proportion of routers down
0.0 0.2 0.4 0.6 0.8 1.0 Prop ortion of traces impacted Cisco Junos JunosE BAL (e) AS E 0.0 0.2 0.4 0.6 0.8 1.0
Proportion of routers down
0.0 0.2 0.4 0.6 0.8 1.0 Prop ortion of traces impacted Cisco Junos JunosE BAL (f) AS F 0.0 0.2 0.4 0.6 0.8 1.0
Proportion of routers down
0.0 0.2 0.4 0.6 0.8 1.0 Prop ortion of traces impacted Cisco Junos JunosE BAL (g) AS G
Figure 8 Attack impact – proportion of traces impacted (Y-axis) given the proportion of routers down (X-axis), for each AS.
of traces impacted has been normalized by the total number of traces for that AS, in order to compare the four ASes together.
As expected given their hardware distribution and popularity, different ASes are sensitive to the removal of routers from different brands. Regarding ASB, we see that it is enough to remove 20% of the Cisco nodes to impact more than 60% of the traces, while other brands do not have much of an impact. In this case, Cisco plays a major role in network connectivity. However, for ASC, AS E, and AS F, the removal of Junos is more harmful to network connectivity than for the other brands, especially for AS E and
F. Regarding AS D and AS G, they rely on two different brands (Junos and Cisco for the former, Junos and BAL for the latter), which has the effect of making them less vulnerable to attacks on one of those brands. Indeed, for both these ASes, an attack on 20% of their dominating brand impacts approximately 30% of the traces, instead of 60% compared to other ASes.
In the light of those results, we can definitely conclude that not all router brands contribute equally to network connectivity, and that some of them are topologically more important than others, depending on the AS.
Newly discovered vulnerabilities could be exploited by those seeking to damage networks. Even though an attack targeting a defect on a particular brand could be launched blindly without fingerprinting devices beforehand, if the attack requires heavy resources from the attacker, they can find a benefit in fingerprinting to focus the scope of their attack on carefully selected nodes. An additional benefit would be to proceed stealthy and avoid detection while keeping a reasonable scanning rate, as already explained in Section 2.
6.2 MPLS Attacks
The Internet is a complex system composed of several layers, each playing a distinct role. The application traffic is mapped onto the IP network, which is in turn mapped onto the physical network, composed of routing devices, cables and fibers. With MPLS, an additional layer is in inserted in the stack on top of the physical network.
Each layer has its own topology and properties, but depends on the layers beneath itself to operate properly. As such, a seemingly harmless failure of the lower layers could have a great impact on the upper layers.
In the light of this, we ask ourselves the question what is the impact if an
MPLS router is killed inside a tunnel? Is the entire MPLS tunnel unusable? Or
is there a rerouting mechanism in place to redirect packets to another tunnel? Is it done automatically or does it require human intervention?
There are two cases of figure, depending on whether the router belongs to an RSVP-TE tunnel or an LDP one. First, with LDP [5], tunnels are congruent with the IGP: they simply follow the IGP routing decisions. In the event of a failing router, the rerouting of the packets will be as fast as the IGP convergence itself, and the impact will be the same as for a classic IP-based router. Second, in the case of RSVP-TE [7] however, MPLS tunnels have been engineered explicitly to follow a certain path according to the TE requirements. The reservation state in each router is considered as a soft state, meaning periodic messages must be sent at each hop to maintain the state. If
there is a failure at any hop, RSVP provides messages to propagate the error along the path, and to tear down the existing reservation [7]. Therefore, if a single router is killed inside a tunnel, the entire tunnel will be unusable and all the traffic it used to carry will be impacted.
There exists several protection mechanisms of the tunnels, each with their advantages and drawbacks. Both Cisco and Juniper provide the ability to configure and establish a secondary LSPto provide failure protection for the LSPthat is carrying a tunnel’s TE traffic. When there is a failure on the protected LSP, the Ingress router immediately reroutes traffic to the secondary LSP. If there is a failure on the secondary LSP however, there is no more protection [1, 2]. An alternate recovery function is Fast Reroute (FRR) [30], which protects MPLS TE LSPs only from link and node failures by locally repairing the LSPs at the point of failure. A router upstream of the failure will route around the failure to the router downstream of the failure, thereby maintaining connectivity while a new LSPis established at the Ingress.
However, these two mechanisms require considerable configuration and planning. We do not know if the protection of MPLS tunnels is commonplace among network operators, but the proportion of RSVP-TE tunnels for each AS (see Table 4) is large enough to justify looking more deeply into this matter.
Methodology and results
First and foremost, we will only consider RSVP-TE tunnels for this analysis, as they are the ones potentially vulnerable. We also exclude AS A from the picture because the proportion of addresses in its MPLS tunnels that could be resolved to routers was extremely low (around 3%). As such, an analysis at the router level would have been meaningless. Coverage for the other ASes was good and revolved around 84%.
To answer our question, we will use a framework for the analysis of complex multi-layers networks, as introduced by Kurant and Thiran [21]. We represent the network as a two-layers system, with the logical graph Gλ rep-resenting the MPLS layer, and the underlying physical graph Gφcomposed of actual routers. Every logical edge eλ, i.e., MPLS tunnel, is mapped onto the physical network as a physical path M (eλ). For example in Figure 9, the logical edge eλ1 is mapped onto the physical path M (eλ1) = eφ1, eφ2, eφ3, eφ4
Figure 10 presents the ECDF of the number of MPLS tunnels supported by a router, for each AS. We can already see from this graph that many physical routers serve more than a single MPLS tunnel. Indeed, for AS F, 80% of the MPLS routers support 100 different tunnels or more. ASE follows
Figure 9 Multilayer view – mapping between the logical graph, Gλ, and the physical one, Gφ.
100 101 102 103 104
# MPLS tunnels per router 0.0 0.2 0.4 0.6 0.8 1.0 ECDF B C D E F
Figure 10 ECDF – number of MPLS tunnels supported per router.
directly after with 60% of its MPLS routers serving 100 tunnels or more. The failure of such important routers will affect the numerous MPLS tunnels that are mapped onto it.
Next, to simulate an attack, we consider each AS separately and remove different proportions (0.001, 0.005, 0.01, 0.02, 0.05, 0.1, 0.25, 0.5, 0.75, 0.9, 1.0) of MPLS routers. Each time, we count the number of MPLS tunnels that go through those downed MPLS routers. And for each percentage, we performed the simulation 30 times and built confidence zone around the mean.
Figure 11 presents, for each AS, the proportion of MPLS tunnels impacted (Y-axis) given a percentage of removed routers (X-axis). Not sur-prisingly given the number of tunnels per router (see Figure 10), failures
0.0 0.2 0.4 0.6 0.8 1.0 Proportion of MPLS routers down 0.0 0.2 0.4 0.6 0.8 1.0 Prop ortion of tunnels impacted B C D E F
Figure 11 MPLS attack impact – proportion of MPLS tunnels impacted (Y-axis) given the proportion of MPLS routers down (X-axis), for each AS.
at the physical layer propagate quickly to the logical layer and multiply. Globally, 20% of MPLS routers down can impact between 35 and 99% of MPLS tunnels depending on the AS. AS B is most vulnerable, followed by ASE, then AS C, then AS D, and finally AS F. In conclusion, we can say that the behavior of a complex layered system in response to attacks is more involved than what can be observed at a single layer.
6.3 Risk Mitigation
Network operators can protect themselves from fingerprinting, and all its potential security implications, in different manners. The first one is extremely simple: use a standard initial TTL (iTTL) in ICMP packets, as rec-ommended by RFC1700 [31]. As the iTTL is not configurable by operators, this suggestion is addressed to hardware vendors who must anonymize their routers by ensuring that each packet is forged with the same iTTL.
A more sophisticated technique is to obfuscate the topology to prevent attackers from discovering potential targets. An example would be to adapt, e.g., NetHide [28] for obfuscating the links but also anonymizing the routers. Another idea would be to diversify as much as possible the hardware infrastructure, in order to make oneself less vulnerable to an attack on a particular brand (such as AS D and AS G – see Section 6.1). This may however require too much effort from an operator in terms of management and/or investment.
Finally, as a last-resort solution, an operator could decide to completely turn off ICMP packets (or at least filter them at the edge, as done with
IGMP [24]), effectively hiding the topology and the hardware infrastructure. However, this solution brings more drawbacks than advantages, and is most often seen as completely impracticable, as traceroute and ping are essen-tial network debugging tools (error messages, connectivity checking, PMTU discovery, . . . ). Furthermore, the case is even worst for IPv6, where ICMPv6 cannot be treated as an auxiliary function, like its IPv4 counterpart, with packets that can be dropped in most cases without damaging the functionality of the network [13].
7 Conclusion
In this paper, we investigated two research questions: (i) what is the hardware ecosystem in the Internet and operators and (ii) what could happen if an attacker can easily identify router brands and target specific vendor with (known) security breaches? For this analysis, we rely on an updated dataset and make use of a novel alias resolution technique, Apple[25], to refine our view of the operators’ networks.
For the first question, we showed that, if Cisco largely dominates the over-all market, the hardware distribution appears more colorful when looking on a per AS basis. Different ASes can have very different hardware ecosystems, with all potential implications for network resiliency and security. Further-more, we explored various MPLS aspects of the networks under study, and showed that it is possible to extend the fingerprinting technique of Vanaubel et al. [42] to help identifying hardware vendors.
With respect to the second question, we demonstrated that not all brands contribute equally to network connectivity, depending on the AS. An attacker seeking to cause a lot of damage, with the least amount of effort, could target a specific brand that plays a vital role in network connectivity, and do so very easily given the simplicity of our fingerprinting technique. Additionally, we also studied the interactions between the router layer and the MPLS layer, and showed that the state of a single layer does not necessarily reflect well the state of the entire system.
Ethical Considerations
We are aware that someone with bad intentions (hacker, unscrupulous com-petitor, . . . ) could easily replicate what has been described here. To avoid this situation, this paper also includes simple schemes that could be applied
by hardware vendors to “anonymize” their hardware, while still allowing traceroute and ping, that are valuable monitoring tools.
In addition, for security reasons, we have anonymized the four ASes of interest described in this paper.
References
[1] Configuring mpls te rsvp, August 2018. See https://www.cisco.com/c/ en/us/td/docs/switches/datacenter/sw/5 x/nx-os/mpls/configuration/gu ide/mpls cg/mp te path prot.html.
[2] Node and path protection for mpls lsps, September 2020. See https: //www.juniper.net/documentation/en US/junos/topics/topic-map/node-path-protection-for-mpls.html.
[3] P. Agarwal and B. Akyol. Time-to-live (TTL) processing in multiproto-col label switching (MPLS) networks. RFC 3443, Internet Engineering Task Force, January 2003.
[4] L. Andersson and R. Asati. Multiprotocol label switching (MPLS) label stack entry: EXP field renamed to traffic class field. RFC 5462, Internet Engineering Task Force, February 2009.
[5] L. Andersson, I. Minei, and T. Thomas. Ldp specification. RFC 5036, Internet Engineering Task Force, October 2007.
[6] B. Augustin, X. Cuvellier, B. Orgogozo, F. Viger, T. Friedman, M. Lat-apy, C. Magnien, and R. Teixeira. Avoiding traceroute anomalies with Paris traceroute. In Proc. ACM Internet Measurement Conference
(IMC), October 2006.
[7] D. Awduche, L. Berger, D. Gan, T. Li, G. Srinivasan, and V. ans Swal-low. Rsvp-te: Extensions to rsvp for lsp tunnels. RFC 3209, Internet Engineering Task Force, December 2001.
[8] A. Bashandy, C. Filsfils, S. Previdi, B. Decraene, S. Litkowski, and R. Shakir. Segment routing with the mpls data plane. RFC 8660, Internet Engineering Task Force, December 2019.
[9] D. Bleichebacher. Chose ciphertext attacks against protocols based on the RSA encryption standard PKCS#1. In Proc. International
Cryp-tology Conference on Advances in CrypCryp-tology (CRYPTO), August
1998.
[10] R. Bonica, D. Gan, D. Tappan, and C. Pignataro. ICMP extensions for multiprotocol label switching. RFC 4950, Internet Engineering Task Force, August 2007.
[11] kc claffy, Y. Hyun, K. Keys, M. Fomenkov, and D. Krioukov. Internet mapping: from art to science. In Proc. IEEE Cybersecurity Application
and Technologies Conference for Homeland Security (CATCH), March
2009.
[12] L. Dall’Asta, I. Alvarez-Hamelin, A. Barrat, A. V´asquez, and A. Vespig-nani. A statistical approach to the traceroute-like exploration of net-works: Theory and simulations. In Proc. Combinatorial and Algorithmic
Aspects of Networking (CAAN) Workshop, August 2004.
[13] E. Davies and J. Mohacsi. Recommendations for filtering ICMPv6 messages in firewalls. RFC 4890, Internet Engineering Task Force, May 2007.
[14] B. Donnet, M. Luckie, P. M´erindol, and J.-J. Pansiot. Revealing MPLS tunnels obscured from traceroute. ACM SIGCOMM Computer
Commu-nication Review, 42(2):87–93, April 2012.
[15] D. Felsch, M. Grothe, and J. Schwenk. The dangers of key reuse: Practical attacks on IPsec IKE. In Proc. USENIX Security Symposium, August 2018.
[16] J.-F. Grailet and B. Donnet. Towards a renewed alias resolution with space search reduction and IP fingerprinting. In Proc. IFIP Network
Traffic Measurementand Analysis Conference (TMA), June 2017.
[17] B. Hadad, B. Seri, and Y. Sarel. CDPwn: Breaking the discovery pro-tocols of the entreprise of things. Technical White Paper 20200205-1, Armis, Inc., February 2020. See https://www.armis.com/cdpwn/ for additional details.
[18] K. Keys. Internet-scale IP alias resolution techniques. ACM SIGCOMM
Computer Communication Review, 40(1):50–55, January 2010.
[19] K. Keys, Y. Hyun, M. Luckie, and kc claffy. Internet-scale IPv4 alias resolution with MIDAR. IEEE/ACM Transactions on Networking, 21(2):383–399, April 2013.
[20] T. Kohno, A. Broido, and kc claffy. Remote physical device finger-printing. IEEE Transactions on Dependable and Secure Computing, 2(2):93–108, May 2005.
[21] M. Kurant and P. Thiran. Layered complex networks. Physical review
letters, 96:138701, 05 2006.
[22] J.-R. Luttringer, Y. Vanaubel, P. M´erindol, J.-J. Pansiot, and B. Don-net. Let there be light: Revealing hidden MPLS tunnels with TNT.
IEEE Transactions on Network and Service Management (TNSM),
[23] G. F. Lyon. Nmap Network Scanning: The Official Nmap Project Guide
to Network Discovery and Security Scanning. Nmap Project, 2009. See
http://nmap.org/book/toc.html.
[24] P. Marchetta, P. M´erindol, B. Donnet, A. Pescap´e, and J.-J. Pan-siot. Quantifying and mitigating IGMP filtering in topology discovery. In Proc. IEEE Global Communications Conference (GLOBECOM), December 2012.
[25] A. Marder. APPLE: Alias pruning by path length estimation. In Proc.
Passive and Active Measurement Conference (PAM), March 2020.
[26] A. Marder, M. Luckie, A. Dhamdhere, B. Huffaker, J. Smith, and kc claffy. Pushing the boundaries with bdrmapIT: Mapping router owner-ship at internet scale. In Proc. ACM Internet Measurement Conference
(IMC), November 2018.
[27] E. Marechal and B. Donnet. Network fingerprinting: Routers under attack. In Proc. International Workshop on Traffic Measurements for
Cybersecurity (WTMC), September 2020.
[28] R. Meier, P. Tsankov, V. Lenders, L. Vanbever, and M. Vechev. NetHide: Secure and practical network topology obfuscation. In Proc. USENIX
Security Symposium, August 2018.
[29] D. Moore, V. Paxson, S. Savage, C. Shannon, S. Staniford, and N. Weaver. The spread of the sapphire/slammer worm. Technical report, CAIDA, ICSI, Silicon Defense, UC Berkeley EECS and UC San Diego CSE, January 2003.
[30] P. Pan, G. Swallow, and A. Atlas. Fast reroute extensions to rsvp-te for lsp tunnels. RFC 4090, Internet Engineering Task Force, May 2005. [31] J. Postel. Assigned numbers. RFC 1700, Internet Engineering Task
Force, October 1994.
[32] E. Rosen and Y. Rekhter. Bgp/mpls ip virtual private networks (vpns). RFC 4364, Internet Engineering Task Force, February 2006.
[33] E. Rosen, D. Tappan, G. Fedorkow, Y. Rekhter, D. Farinacci, T. Li, and A. Conta. MPLS label stack encoding. RFC 3032, Internet Engineering Task Force, January 2001.
[34] E. Rosen, A. Viswanathan, and R. Callon. Multiprotocol label switching architecture. RFC 3031, Internet Engineering Task Force, January 2001. [35] Mario Sanchez, Fabian Bustamante, Balachander Krishnamurthy, Wal-ter Willinger, Georgios Smaragdakis, and Jeffrey Erman. InWal-ter-domain traffic estimation for the outsider. In Proc. ACM Internet Measurement
[36] C. Srinivasan, L. P. Bloomberg, A. Viswanathan, and T. Nadeau. Mul-tiprotocol label switching (mpls) traffic engineering (te) management information base (mib). RFC 3812, Internet Engineering Task Force, June 2004.
[37] S. Staniford, V. Paxson, and N. Weaver. How to own the Internet in your spare time. In Proc. USENIX Security Symposium, 2002.
[38] US Ignite, LIP6, Tandon School of Engineering, Swarm Lab, University of Victoria, the University of Vienna, and Cslash. Edgetnet. See https: //edge-net.org.
[39] Y. Vanaubel, J.-R. Luttringer, P. M´erindol, J.-J. Pansiot, and B. Donnet. TNT, watch me explode: A light in the dark for revealing MPLS tunnels. In Proc. IFIP Network Traffic Measurement and Analysis Conference
(TMA), June 2019.
[40] Y. Vanaubel, P. M´erindol, J.-J. Pansiot, and B. Donnet. Through the wormhole: Tracking invisible MPLS tunnels. In Proc. ACM Internet
Measurement Conference (IMC), November 2017.
[41] Y. Vanaubel, P. M´erindol, JJ. Pansiot, and B. Donnet. Mpls under the microscope: Revealing actual transit path diversity. In Proc. ACM
Internet Measurement Conference (IMC), October 2015.
[42] Y. Vanaubel, J.-J. Pansiot, P. M´erindol, and B. Donnet. Network fingerprinting: TTL-based router signature. In Proc. ACM Internet
Measurement Conference (IMC), October 2013.
[43] K. Vermeulen, S. Strowes, O. Fourmaux, and T. Friedman. Multil-vel MDA-lite paris traceroute. In Proc. ACM Internet Measurement
Conference (IMC), October 2018.
[44] N. Weaver, V. Paxson, S. Staniford, and R. Cunningham. A taxonomy of computer worms. In Proc. ACM Workshop on Rapid Malcode (WORM), October 2003.
[45] X. Xiao and B. Hannan, A. andBailey. Traffic engineering with mpls in the internet. In IEEE Network Magazine, April 2000.
[46] C. Zou, D. Towsley, and W. Gong. On the performance of Inter-net worm scanning strategies. Performance Evaluation, 63(7):700–723, July 2006.
[47] C. Zou, D. Towsley, W. Gong, and S. Cai. Routing worm: a fast, selec-tive attack worm based on IP address information. In Proc. Workshop
on Principles of Advanced and Distributed Simulation (‘PADS’), june
Biographies
Emeline Marechal received her MS degree in Computer Engineering from
the Universit´e de Li`ege (Belgium) in 2019. She is currently a Ph.D. student at the Montefiore Institute at the Universit´e de Li`ege. Her research interests are in network measurements, including traffic and topology measurements, and measurement applied to security.
Benoit Donnet received his Ph.D. degree in Computer Science from the
Universit´e Pierre et Marie Curie in 2006 and has been a PostDoc until 2011 at the Universit´e catholique de Louvain (Belgium). Mr. Donnet joined the Montefiore Institute at the Universit´e de Li`ege in 2011 where he was appointed successively as Assistant Professor and Associate Professor. His research interests are about Internet measurements (measurements scalabil-ity, Internet topology discovery, measurements applied to security), network modeling, middleboxes, new Internet architectures (LISP, Segment Routing), and Computer Science Education.