Introduction
Phthalates are toxic organic contaminants, and their toxicity is manifested by teratogenic, carcinogenic, mutagenic, and estrogenic effects. They are also endocrine disruptors and can exhibit toxic effects by synergism, particularly in the case of diabetes [1]. Phthalates are synthetic diester molecules obtained from the esterification of ortho-phthalic acid with alcohols or salts of this acid. Their world production has grown considerably over the last three decades, from 1.8 million tons in 1975 to 6 million tons in 2006 [2]. They are used in many economic and social contexts [3]. They are used as additives in the polymer industry and especially in the manufacture of PVC-based objects, due to their excellent plasticizing properties. Thus, phthalates are present in many materials, such as vehicle accessories, shower curtains, shoes, raincoats, toys, printing inks, detergents, cosmetics, building materials, paints, deodorants, insecticides, hospital equipments, food and medicine packagings, plastic bags and bottles [3].
The most commonly encountered phthalate molecules in the environment are: Dimethyl phthalate (DMP), Diethylphthalate (DEP), Di-n-butylphthalate (DnBP), Butylbenzylphthalate (BBP), Di-isoDecylphthalate (DisoDP), Diallylphthalate (DALP), Dinylphthalate (DNP), Di- (2-ethylhexyl) phthalate (DEHP) and Di-n-octyl phthalate (DnOP).
Pthalates are highly ubiquitous and disperse into the environment by volatilization or solubilization [4].
This dispersion process is governed by their physico-chemical properties such as aqueous solubility, air volatility, octanol-water partition coefficient (Kow), organic matter-water partition coefficient (Koc) and molecular molar mass (M). Semi-volatile phthalates, such as DnBP and DEP adsorb to small particles in the form of aerosols [5], while the heaviest ones (like DEHP) are found in dust [6].
World production of phthalates has grown considerably over the last three decades, from 1.8 million tons in 1975 to 6 million tons in 2006 [2]. They are used in many economic and social contexts [3]. They are used as additives in the polymer industry and especially in the manufacture of PVC-based materials, and their contents vary with the environmental matrices and sampling regions considered. So, DEHP concentrations for example were ranging: 160-210 ng/m³ of air in USA [7], 0.28-3 μg/L for continental surface waters in Italy [8], 0.08-10.0 μg/L in Germany [9] and 0.3-1.8 μg/L in Sweden [10] where sediments contained 0.2-8.4 mg/kg dry weight [11]. For DnBP, its concentrations were ranging 3.4 - 89 ng/m³ of air in China [12].
In marine surface waters in Europe, such as highly industrialized estuarine Spain, the total phthalates concentrations were ranging 600 -11000 ng/L [13], while in Germany, total phthalate concentrations in rainwater were 8-170 ng/L range[14].
Phthalates are exhibited in the list II of 41 priority hazardous substances according to the Water Framework Directive (WFD) 2000/60 / EC in Europe [15].
A R T I C L E I N F O
A r t i c l e h i s t o r y : Received: 4 April 2018; Received in revised form: 7 May 2018; Accepted: 18 May 2018; K e y w o r d s Phthalate Toxicity Water HPLC/DAD Quality control.
Development of Phthalate Analysis Methodology by High Performance
Liquid Chromatography Coupled with Diode Array Detector
(HPLC/DAD)
Adéwolé Jules Ossoulanan
1, Hope Sounouvou
2, Urbain Kassehin
2, Magloire A. N. Gbaguidi
1, Mickael V. M.
K.Saizonou
1, Alassane A.K Youssaao
1, Léonce Firmin Dovonon
1, Fernand Gbaguidi
2and Henri H.. Soclo
1 1Unité de Recherche en Ecotoxicologie et Etude de Qualité, Laboratoire d’Etude et de Recherche en Chimie
Appliquée (LERCA/UREEQ), Ecole Polytechnique d’Abomey-Calavi, Université d’Abomey-Calavi, 01 BP 2009 Cotonou,
Bénin. 2
Laboratoire de Chimie Analytique et Analyse des Médicaments (LCAM) – Faculté Sciences de la Santé (FSS/UAC), Bénin. A B S T R A C T
Phthalates are toxic for human beings and their toxicity can be expressed in various forms like teratogenic, mutagenic, estrogenic and carcinogenic effects as well as by endocrine disturbances. The most commonly encountered phthalate molecules in the environment are: DMP, DEP, DnBP, BBP, DisoDP, DALP, DNP), DEHP, and DnOP. In order to assess the health and environmental impacts of phthalates, it is necessary to access these compounds at the molecular level in natural systems, including water. Therefore, our study was devoted to setting up a protocol including phthalate extraction step, followed with a development of a HPLC/DAD analysis methodology, using artificial mixtures of different standard phthalate compounds and water standard reference material we made in our laboratory. As results, we obtained good performance characteristics such as detection limits (ranging 1.1 - 40.0 ng/L), limits of quantification (from 3.75 to 134 ng /L), coefficients of variation (CV) lower than 10 %, and quality control cards showing that the HPLC/DAD methodology we developed was under
statistical control and suitable for phthalate determination in water. © 2018 Elixir All rights reserved.
Elixir Appl. Chem. 118 (2018) 50779-50784
Applied Chemistry
Available online at www.elixirpublishers.com (Elixir International Journal)
Tele:
E-mail address: [email protected]
In addition, the US Environmental Protection Agency (USEPA) has established permissible daily dose limits for phthalates (mg /kg / CP / day): (0.1) for DnBP in 1990; (0.02) for DisoDP in 1991 and 1993; (0.8) for DEP and (0.2) for DBP [1]. Because of their ecotoxicity and ubiquity, international regulations require their regular monitoring in environmental compartments, including water for the protection of the environment and human health [16].
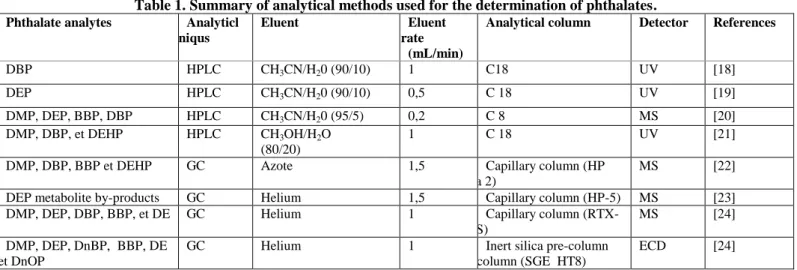
Several analytical techniques are used for the detection of phthalates and their concentration measurements in water. Among others, we can mention: HPLC/UV, HPLC/MS and GC/MS techniques [15]. Table 1 summarizes different analytical methods used by different authors as well as the phthalate analytes considered.
According to the data in Table 1, the types of phthalates identified and quantified vary with the analytical techniques and conditions adopted. As part of the present study, we then tried to develop an experimental methodology adapted to the analysis equipment available in our laboratory, in particular the VWR-Hitachi type chromatograph equipped with a UV-DAD detector, using a C18 Zorbax column. According to the literature, the HPLC/DAD method has previously been used efficiently by other authors to assay phthalate compounds such as DEP, DOP, DPP, DBP, BBP, DCHP and DEHP in cosmetics and drinking water [17]. Material and methods
Preparation of Standard Reference Material (SRM) As mentioned previously, we opted for the research and the determination of eight phthalate compounds, namely: DMP, DEP, DiNP, DEHP, DnOP, DiALP, DisoDP and DPP. This last one (DPP) is used as internal standard, because, according to INRS [25], it is absent from the environmental matrices and could help us determine the recovery percentage of each of the compounds in the analyzed samples. For the development of the HPLC/DAD analysis methodology, a Standard Reference Material (SRM) was prepared by dissolving known weights of authentic molecules of these compounds in a known volume of MilliQ water; this last one is a water purified by the MilliQ system with electrical conductivity of 18 MΏ/cm [25]. These reference molecules, with 99.5% - 99.99% purity, are provided by the German company Sigma-Aldrich. The standard reference sample contains in ng / L: DMP (112), DEP (85), DNP (100); DiALP + DisoDP (210); DEHP (115) and DPP (96).
Extraction and reconcentration of the reference sample extract
Prior to extraction step, different standard working solutions were prepared by dissolving reference compounds in HPLC-grade methanol at 1 μg/10mL mean concentration. The prepared reference sample was kept in the darkness at 4°C, and the extraction process took place within 48 hours after preparation.
Conveniently, a 500 mL volume of SRM sample is collected using a graduated 1L test tube and poured into a 1L separatory funnel. To this, 20 μl of DPP solution (2mg/mL concentration) and then 50 mL of the n-C6/CH2Cl2 mixture (85/15: v/v) were added. Indeed, according to our previous tests in this study, dichloromethane used alone as extraction solvent gave a recovery percentage of 80±7%, while n-C6/CH2Cl2 mixture (85/15) has a lower rate which is about 72±4%. However, for the continuation of our extraction work, we opted for this mixture, because of its lower toxicity and the low variability of its extraction rate ([25] and [26]). The mixture of water sample -with n-C6/CH2Cl2 (85/15 v/v) is then carefully stirred for 20 minutes, and after decantation the organic phase is recovered. The extraction operation is repeated twice, and the 3 fractions of the total extract are gathered in a Pyrex flask and evaporated to a volume of 10 mL by means of a Büchi-type rotary evaporator equipped with a vacuum pump (at 30°C for heating temperature and 350 mbars for pressure).
Reconcentration and purification of the organic extract After stripping the water traces of the total extract by adding a few pinches of anhydrous sodium suphate, the evaporation was continued to a volume of about 5 mL; which extract is then purified on an open column of silica with 20 ml of toluene, and then reconcentrated to 1 ml before being evaporated to dryness under a stream of controlled nitrogen gas. The dry residue is taken up in 1 mL of methanol and then stored in a refrigerator at 4°C, protected from light, until the fractionation and assay phase by HPLC/DAD.
Analytical conditions of the column used and the elution gradient
We used a VWR-Hitachi HPLC type equipped with a UV-DAD HITACHI VWR detector Nr. 5430, a 100 μL loop injection valve and a HITACHI VWR No. 5260 automatic sampler. A C18 Zorbax column (3μm, 250mm x 4.6mm) was used for the separation of phtalates at molecular scale. Table 1. Summary of analytical methods used for the determination of phthalates.
Phthalate analytes Analyticl techniqus
Eluent Eluent
flowrate (mL/min)
Analytical column Detector References
DBP HPLC CH3CN/H20 (90/10) 1 C18 UV [18] DEP HPLC CH3CN/H20 (90/10) 0,5 C 18 UV [19] DMP, DEP, BBP, DBP HPLC CH3CN/H20 (95/5) 0,2 C 8 MS [20] DMP, DBP, et DEHP HPLC CH3OH/H2O (80/20) 1 C 18 UV [21]
DMP, DBP, BBP et DEHP GC Azote 1,5 Capillary column (HP
Ultra 2)
MS [22]
DEP metabolite by-products GC Helium 1,5 Capillary column (HP-5) MS [23]
DMP, DEP, DBP, BBP, et DE HP
GC Helium 1 Capillary column
(RTX-5 MS)
MS [24]
DMP, DEP, DnBP, BBP, DE HP et DnOP
GC Helium 1 Inert silica pre-column
and column (SGE HT8)
ECD [24]
Source : Ferreira de Oliveira et al. (2011). GC : Gas Chromatography
MS : Mass Spectrometry ECD : Electron Capture Detector
A Computer DELL Optiplex 7010 computer equipped with Microsoft Windows 7 Enterprise, placed downstream of the HPLC / DAD chromatograph makes it possible to integrate the chromatogram peaks corresponding to the desired compounds and the acquisition of the data. For the analyzes, the oven temperature is set at 30 °C using a HITACHI VWR Nr 5310 brand thermostat. The DAD detector is attached at the 230 nm wavelength, at which most of phthalates absorb.
The eluent, pumped at a flow rate of 1.0 mL/min using a HITACHI VWR HPLC pump No. 5160, is subjected to an elution gradient system whose programming of methanol/water solvents is presented according to the scheme of the Fig.1 which is as follows [17]:
methanol/ water (50/50 v/v: 0 to 13 min); methanol / water (70/30 v/v: 15 min); methanol / water (85/15 v/v: 22 min) and methanol / water (100/0 v/v: 30 min). It should be noted that each analysis was preceded by HPLC eluent degasing by ultrasonicating process for about 30 minutes.
This elution program was performed after stabilization of the Vydac column by continuous elution with the MeOH/H2O (50:50) isocratic mixture which results in stabilization of the baseline (evidence that there is no impurity both in elution solvents and on the detector).
Results and discussion
Analysis of the authentic reference mixture for the calibration curve plot
The analysis of the standard solution of each phthalate compound followed by that of the artificial mixture of the eight molecules studied allows to identify each compound by its absolute and relative retention time with respect to the first peak (peak of the solvent or first phthalate peak).The chromatogram obtained is as follows as in Fig. 2.
Figure 2. Chromatogram of the mixture of authentic phthalate molecules by HPLC / DAD.
The mixture of the seven authentic reference molecules and their concentrations are presented in Table 3. This mixture is chromatographed according to the elution gradient indicated in Fig.2, by injection of 10 μL of solution using a 10μL capacity microsyringe.
The resulting chromatogram showed a good separation of the majority of phthalates which are clearly distinguishable from the internal standard (Fig. 3). Only the molecules of DisoDP and DALP coelute, and any attempt during our study to separate them by decreasing the flowrate of the eluent or reducing the methanol in the eluent unnecessarily lengthens theanalysistime
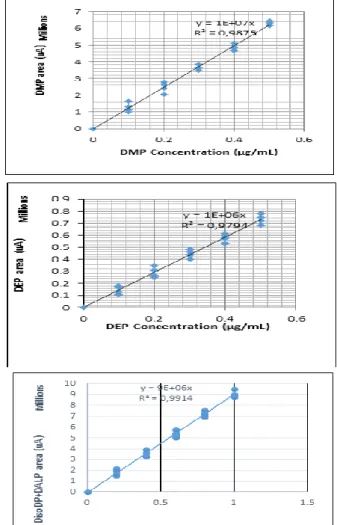
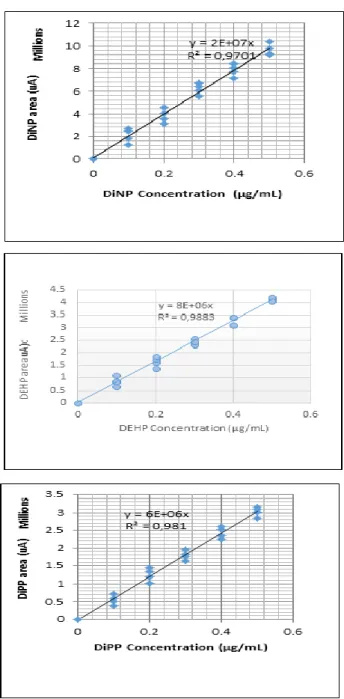
These separations obtained here are almost similar to those obtained under the same operating conditions by [17] with C8 Zorbax (3 μm, 150 × 4.6 mm) and C18 Zorbax (3 μm, 250 × 4.6 mm) columns. The calibration curve was then plotted for each phthalate compound. For this, we used diluted working solutions whose phthalate contents are indicated in Table 3.
These diluted solutions are analyzed by HPLC/DAD according to the protocol described above. A representation of the areas of the peaks as a function of the different concentrations of each compound allowed to draw median lines representing the calibration curves with a good coefficients of correlation: R2≥97% (see Fig. 3).
By comparing our calibration results with those of other authors, we make the following observations: i) they are to compare with those obtained in HPLC / UV at 228 nm on an apolar C18 column eluted with an isocratic CH3CN/MilliQ water mixture (70/30), which made it possible to obtain a calibration curve with a good correlation coefficient (R2= 99.99%); ii) in comparison with those
obtained, on one side by[17] from the GC/MS analytical technique (with R2≥88%), and on the other side
[25] with 95% ≤ R2 ≤ 99.99%, our correlation coefficients appear slightly higher.
Consequently, we could conclude, according to standard NF T 90-210 of May 2009 [26], that the calibration curves established in the present study can be used to characterize phthalate molecules in the water samples.
Table 2. Composition of a concentrated phthalate mixture solution in methanol.
Phthalate standard molecules
DMP DEP DNP DiALP DisoDP DEHP DPP* Concentrations (ng/L) 116 111 96 109 95 97 102
Figure 3. Calibration Curves for phthalate concentration measurements.
Evaluation of the performances of the developed analysis method
It was carried out from the characteristic quantities such as the average recovery coefficient r (%) obtained for each phthalate compound using method of metered additions, the limit of detection (LD), the limit of quantification (LOQ) and the coefficient of variation CV(%) [25], with:
LD = 3(Abn /Astd) xCe
LOQ = 3,33.LD ; CV = ( / M) x100. Abn: Chromatogram background noise area Astd : Area of standard molecule
: Standard deviation
M: Mean area of peaks at different concentrations.
Table 4 summarizes the values of these performance evaluation parameters of the analytical method. From the data in Table 4, we could make the following observations: - The recovery percentages (ie efficiency) for all phthalates are ranging from 60 to 71%, with an average value around 65%;
- The detection limits (LD) of the phthalates vary from one compound to another, namely in ng/L): DMP (1.35); DEP (24); DisoDP + DiALP (29); DPP (6.51); DNP (40); DEHP (1.13);
- The limits of quantification (LOQ) range from 3.75 ng/L (for DEHP) to 134 ng / L (for DNP) with an average value around 57ng/L and coefficients of variation (CV) lower than 10 %.
In comparison with the results of previous studies made by other authors, our performance data corroborate those of the investigations made by Blanchard et al. [25] and Bergé et al. [26] who showed overall coefficients of variation (CV) lower than 10% for the quantification limits. We could conclude to the probable existence of correlation between the physico-chemical properties of the phthalate molecules and their behaviors in HPLC analysis.
To ensure the quality of the analytical results, it was necessary to constantly evaluate the quality of the results and the effectiveness of the analytical protocol. To do this, we conducted the main activities that consisted in quality control and validation of results.
Table 3. Values of the method performance parameters.
Phthalates r (%) LD (ng/L) LOQ (ng/L) CV(%) DMP 71 1,35 4,5 3,69 DEP 70 24 80 7,86 DisoDP+DiALP 60 29 97 4,66 DPP 65 6,51 21,68 3,32 DNP 62 40 134 6,18 DEHP 61 1,13 3,75 6,15
Establishment of quality control charts for the determination of phthalates
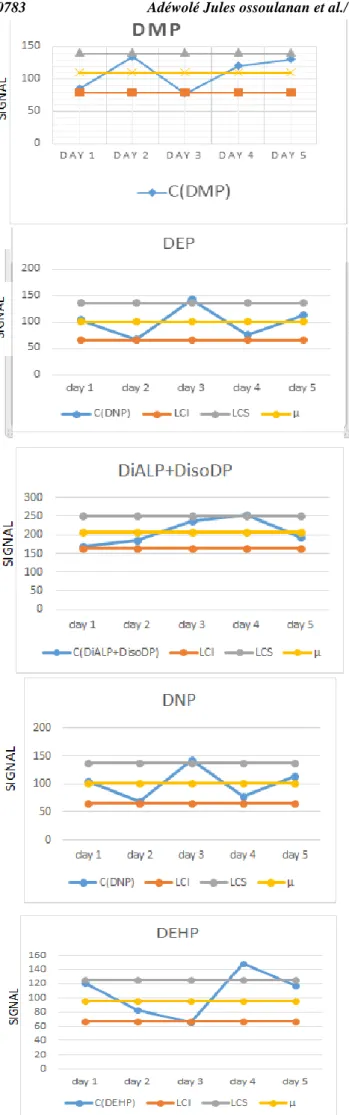
It is practically the last step in the validation of the method which includes the implementation of a follow-up of the so-called "routine" analysis method. This follow-up consisted of analyzing, from time to time during the study period, for five consecutive days, control solutions at different known concentrations of phthalates, such as [27] experimented with it during their studies on phthalates. This quality control is made from standard reference material (SRM) prepared in the laboratory and presented above in the "Materials and Methods" section. The sample of milli-Q water doped with the desired phthalates is then analyzed by HPLC/DAD. The levels measured per day and for each phthalate over a period of five (05) days are used to plot the control chart (in blue color) based on the work of [28].
The lower control limit (LCL) and upper limit (UCL) values of the quality control chart are located at 3 standard deviations on each side of the mean μ concentration (in ng/L) of each phthalate, such as show their respective formulas:
UCL = µ + (3/N), LCL = µ - (3/N) with:
μ: Average of the population of the measured values; : Standard deviation of the population of the measured values; N: Number of measurements obtained for each sample during the control period (here N = 5). UCL and LCL are an area within which the probability of finding a phthalate concentration measurement is 99.7%. The average values of the phthalate concentrations are: DMP (μ = 109 ng/L), DEP (μ = 83 ng/L), DNP (μ = 101 ng/L); DisoDP + DiALP (μ = 207 ng/L); DEHP (μ = 115 ng/L) and DPP (μ = 96 ng/L).
Figure 4. Quality control sharts for the phthalate concentration measurements by HPLC/DAD. Validation of the analytical results
The analysis of the evolution of each of the graphs in Fig. 4 shows that, in almost of measurements, the concentration values measured for each phthalate during the control period (5 days) are located between LCL and UCL. In the DEHP graph, if DEHP has a concentration at the 4th day of measurement above UCL, its concentration, however, at the fifth day immediately returns to the control zone. This shows that the HPLC/DAD phthalate assay protocol developed in this study is under statistical control and demonstrates sustainable efficiency and reliability. So, the HPLC/DAD protocol developed here could be used for monitoring the quality of drinking water relative to phthalates.
Conclusion
This study has developed a phthalate analysis methodology in water, constituted with liquid-liquid extraction phase, followed by a step of separation, identification and quantification at molecular scale using a HPLC/DAD system. The extraction solvent, such as hexane/dichloromethane mixture (85/15; v / v), gives a recovery rate about 72 ± 4% compared with dichloromethane which, despite its extraction rate about 80 ± 7%, was discarded due to its higher toxicity.
HPLC/DAD technique using MeOH/H2O solvent gradient on a Zorbax column (3 µm; 250mm x 4.6mm) allowed a good separation for individual phthalates, except DisoBP and DiALP that could not be separated from each other (coelution) but which have however been measured. In addition to the performance characteristics quantities (such as detection limits, quantification limits and coefficients of variation) of the analytical protocol used in this study, quality control sharts plots reveal that the developed analytical methodology is efficient and reliable, and that it can be applied for the monitoring of phthalates in waters. Acknowledgements
The authors are addressing their thanks to the researchers of the University laboratories (such as LERCA/UREEQ and LCA AM in Benin) for their contribution to the data collection and laboratory analysis. They are grateful to Professor Jacques POUPAERT from the "Université Catholique de Louvain" (Belgium), for his help in purchasing phthalate reference reagents from Europe. References
[1] U. Heudorf, V. Mersch-Sundermann, J. Angerer, Phthalates toxicology and exposure, Int. J. Hyg. Environ. Health, 210, 2007, pp.623 - 634.[2] W. J. G. M. Peijnenburg, J. Struijs, Occurrence of phthalate esters in the
environment of the Netherlands, Ecotoxicol Environ. Safe, 63, 2006, pp. 204 – 215.
[3]A. Bergé, J. Gasperi, V. Rocher, A. Coursimault, R. Moilleron, Phthalate and alkylphenol removal within wastewater treatment plants using physicochemical lamellar clarification and biofiltration, In: Weissex Institute, (ed) Water Pollution XI, New Forest, United Kingdom, 2012, pp. 357‐369.
[4]M.S. Fountoulakis, K. Stamatelatou, D.J. Bastone, G. Lyberatos, Simulation of DEHP biodegradation and sorption during the anaerobic digestion of secondary sludge. Water Science & Technology 54, 2006, pp.119-128.
[5] K. Rakkestad, C. Dy,. Phthalate levels in Norvegian indoor air related to particle size fraction. Journal of Environmental Monitoring 9, 2007, pp.1419-1425.
[6]R.A. Rudel, D.E. Camann, J.D. Spengler, L.R. Korn, J.G. Brody, Phthalates, alkylphenols, pesticides, polybrominated diphenyl ethers, and other endocrine-disrupting compounds in indoor air and dust. Environmental Science & Technology 37, 2003, pp.4543-4553.
[7]J.J. Adibi, R.M. Whyatt, P.L. Williams, A.M. Calafat, D. Camann, R. Herrick, H. Nelson, H.K. Bhat, F.P. Perera, M.J. Silva, R. Hauser. Characterization of phthalate exposure among pregnant women assessed by repeat air and urine samples. Environ Health Perspect, 116, 2008, 467 - 473. [8] M. Vitali, M. Guidotti, G. Maclienti, C. Cremisini, Phthalate esters in freshwaters as markers of contamination sources, A site study in Italy, Environ Int, 23, 1997, pp.337 - 347.
[9] H. Fromme, H. Lahrz, M. Piloty, H. Gebhart, A. Oddoy, H. Rüden, occurrence of phthalates and musk fragrances in indoor air and dust from apartments and kindergartens in Berlin (Germany). Ind Air, 14, 2004, pp.188-195.
[10] A. Thüren, P. Larsson, Phthalate esters in the Sweedish atmosphere, Environmental Science and Technology 24, 1990, pp.554-559.
[11]P.C. Huang, C.J. Tien, Y.M. Sun, C.Y. Hsieh, C.C. Lee. Occurrence of phthalates in sediment and biota relationship to aquatic factors and the biota- sediment accumulation factor, Chemosphere 73, 2008, pp.539 – 544.
[12] C.S. Liao, J.H. Yen, Y.S. Wang, Growth inhibition in Chinese cabbage (Brassica rapavar. chinensis) growth exposed to di-n-butyl phthalate. Journal of Hazardous Materials 163, 2009, pp.625-631separation science, pp. 3409-3415.
[13]E. Cortazar, O. Zuloaga, J. Sanz, J.C. Raposo, N. Etxebarria, L.A. Fernandez, Multisimplex optimisation of the solid-phase microextraction-gas chromatographic-mass spectrometric determination of polycyclic aromatic hydrocarbons, polychlorinated biphenyls and phthalates from water samples. J Chromatogr A, 978, 2002, pp.165 - 175.
[14]A.D. Vethaak, J. Lahr, S.M. Schrap, A.G. Belfroid, G.B.J. Rijs, An integrated assessment of oestrogenic contamination and biological effects in the aquatic environment of the Netherlands. Chemosphere 2, 59, 2005, pp.511 - 524.
[15] Tatianne Ferreira de Oliveira, Olivier Chedeville, Henri Fauduet, Benoît Cagnon, Use of Ozone/activated carbon coupling to remove diethyl phthalate from water: influence
of activated carbon textural and chemical properties, Desalination 276 (1, 3), 2011, pp.359-365.
[16]C. Dargnat, M. Blanchard, Marie J. Teil, Marc Chevreuil, contamination of atmospheric deposits by PVC plasticying : phthalates 38, 2007, pp.143-154.
[17]H.Y. Shen, H.L. Jiang,H.L. Mao, G. Pan, L. Zhou, Y.F. Cao, S ultaneous determination of seven phthalates and four parabens in cosmetic products using HPLC-DAD and GC-MS methods. Journal of Separation Science 30, 2007, pp. 48-54im
[18] H.Y. Li, J.H. Qu, H.J. Liu, Removal of a type of endocrine disruptors –di-n-butyl phtalate from water by ozonation, Journal of Environmental Sciences 18, 2006, pp.845-851.
[19]Mohan S. V, Shailaja S., Krishna M. R., Sarma P. N., Adsorptive removal of phthalate ester (Di-ethyl phthalate) from aqueous phase by activated carbon: A Kinetic study, Journal of
Hazardous Materials 146, 2006, pp.278-282.
[20] C. Pérez Feas, M.C. Barciela Alonso, E. Pena-Vasquez, P. Herbello Hermello, P. Bermejo-Barrera, Phthalates determination in physiological saline solutions by HPLC-ES-MS, Talanta 75, 2008, pp.1184-1189.
[21] J.C. Salim, H. Liu, F.J. Kennedy, Comparative study of the adsorption on chitosan beads of phthalate esters and their degradation products, Carbohydrate Polymers 81, 2010, pp.640-644.
[22] P. Roslev, K. Vorkamp, J. Aarup, K. Frederiksen, P.H. Nielsen, Degradation of phthalate esters in an activated sludge wastewater treatment plant, Water Research 41, 2007,pp.969-976.
[23] B. Xu, G. Nai-Yun, S. Xiao-Feng, X. Sheng-Jin, R. Min, M. Simonnot, C. Causserand, J. Jain-Fu, Photochemical degradation of diethyl phthalate with UV/H2O2, Journal of Hazourd Materials B 139, 2007, pp. 132-139.
[24] M. Del Carlo, A. Pepe, G. Sacchetti, D. Compagnone, D. Mastrocola, A. Cichelli, Determination of phthalate esters in wine using solid-phase extraction and gas chromatography-mass spectrometry, Food Chemistry 111, 2008, pp.771-777.
[25] M. Blanchard, Marie J. Teil, C. Dargnat, F. Alliot, Marc Chevreuil, Assessment of adult human explosure to phthalate esters in the urban center of Paris ( France), Bulletin of Environmental contamination and toxicology 90, 2013, pp.91-93.
[26]A. Bergé, M. Cladière, J. Gasperi, A. Coursimault, B. Tassin, R. Moilleron, Metaanalysis of Environmental Contamination by Phthalates, Environmental Science and Pollution Research. https://hal-enpc.archives-ouvertes.fr/00845814, 2013.
[27]A. Bergé, J. Gasperi, V. Rocher, A. Coursimault, R. Moilleron, Occurrence and fate of phthalates in urban area: case of Parisian sewer network and wastewater treatment plant (in French). Technics, Sciences and Methods 4, 2012, pp. 21-29.
[28]H.W. Zwanziger et C. Sarbu, Anal, Validation of analytical methode using a regression…. Determination of nafcillin by room temperature 70, 1998, pp. 1277.