www.clim-past.net/8/337/2012/ doi:10.5194/cp-8-337-2012
© Author(s) 2012. CC Attribution 3.0 License.
Climate
of the Past
Precessional and half-precessional climate forcing of Mid-Devonian
monsoon-like dynamics
D. De Vleeschouwer1, A. C. Da Silva2, F. Boulvain2, M. Crucifix3, and P. Claeys1
1Earth System Sciences and Department of Geology, Vrije Universiteit Brussel, 1050 Brussels, Belgium 2P´etrologie s´edimentaire, B20, Universit´e de Li`ege, Sart Tilman, 4000 Li`ege, Belgium
3Centre de recherche sur la Terre et le climat Georges Lemaˆıtre, Earth and Life Institute,
Universit´e catholique de Louvain, 1348 Louvain-la-Neuve, Belgium Correspondence to: D. De Vleeschouwer ([email protected]) Received: 2 April 2011 – Published in Clim. Past Discuss.: 2 May 2011
Revised: 10 January 2012 – Accepted: 11 January 2012 – Published: 27 February 2012
Abstract. A Devonian magnetic susceptibility (MS) record obtained on limestones ranging from the Uppermost-Eifelian to the Lower-Givetian and located on the southern border of the Dinant Synclinorium in Belgium was selected for time-series analysis. In these carbonate ramp and platform de-posits, spectral analyses highlight persistent, high-frequency cycles in both the MS-signal and the microfacies curve, re-flecting environmental and climate changes. These metre-scale variations in the MS-signal are interpreted as changes in the flux of magnetic minerals towards the marine sys-tem, most likely controlled by monsoon rainfall-intensity. By combining chrono- and biostratigraphic information with theoretical knowledge of sedimentation rates in different de-positional environments, these cycles are interpreted as as-tronomically driven and dominated by precession. It is hypothesized that during precession minima (longitude of the perihelion ≈270◦) the trans-equatorial pressure gradi-ent reaches a maximum and intensifies the northeasterly monsoonal circulation. The consequent increase in mois-ture transport towards the continent leads to enhanced pre-cipitation and runoff, which, in turn, induces a higher flux of detrital material – including magnetic minerals responsi-ble for the MS-signal – towards the marine system. More-over, this unique high-resolution climate signal reveals half-precessional cycles. These cycles suggest that during preces-sion maxima (longitude of the perihelion ≈90◦) southeast-erly monsoonal circulation strengthened due to an increased inter-hemispheric pressure gradient.
1 Introduction
It is only since the late seventies that variations in the Earth’s orbit were accepted as the pacemaker of the Quaternary ice ages (Hays et al., 1976). To leave the sphere of controversy, the theory needed several well-established feedback mecha-nisms and assumptions about the nonlinear responses of ice sheets to the applied astronomical forcings. In an extreme hot, greenhouse world, without any major ice sheets, ice-related feedback mechanisms and nonlinearities do no longer apply. Consequently, other mechanisms must explain the am-plification of subtle variations in the Earth’s orbital parame-ters into global climate and environmental changes. Except for the important positive water-vapour feedback mecha-nisms (Rind et al., 1991; Flohn et al., 1992) or the vegetation and soil feedback mechanism (Kutzbach et al., 1996; Dekker et al., 2007), a clear understanding of how this amplification occurred in an ice-free hot greenhouse world is lacking.
The Greenhouse Devonian Period (418–361 Ma; Kauf-mann, 2006) is characterised by climate boundary conditions that differ completely from those of the Quaternary: atmo-spheric CO2concentration was up to 10 times higher
com-pared to today’s value (Berner, 2006), continents were con-centrated in the Southern Hemisphere (SH), global temper-atures and sealevel were high and vast shallow epicontinen-tal seas allowed reefs to develop at high latitudes, reaching 65◦N–55◦S during the Middle-Devonian (Copper, 2002). Moreover, the Devonian is a key period in the evolution of life on Earth with, for example, the fish-tetrapod transition occurring during the early Middle-Devonian (Niedzwiedzki
et al., 2010) and the invasion of the continents by land plants. The latter development influenced climate significantly by altering continental albedo, roughness, thermal properties, potential evaporation and CO2consumption (Le Hir et al.,
2011). Therewithal, enhanced pedogenesis resulted in inten-sified continental weathering and export of its breakdown-products to seas and oceans (Berner, 1997; Algeo et al., 2001). In this study, the mathematical techniques of time-series analysis were applied to a well-documented 85 m-thick Eifelian/Givetian (Middle-Devonian) section from South-ern Belgium (Mabille and Boulvain, 2007; Boulvain et al., 2010). The studied section, characterised by a high accu-mulation rate and high sampling resolution, contains a cli-mate signal that is highly suitable to study the influence of Milankovi´c (eccentricity, obliquity and precession) and sub-Milankovi´c cycles on the Middle-Devonian climate of the Rhenohercynian Basin. The main objective of this study is to reveal the finger print of these cycles in the section, in or-der to obtain a better insight into the response to astronomical forcing of an extremely hot Greenhouse climate.
2 Geological setting
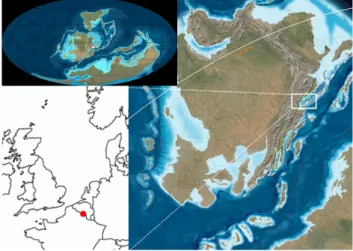
The Eifelian-Givetian “La Couvinoise” quarry is located along the southern flank of the Dinant Synclinorium, in southern Belgium (Fig. 1), which is part of the Rhenoher-cynian fold-and-thrust belt. The studied section corresponds to a mixed carbonate-siliciclastic ramp, located in the Rheno-hercynian basin, on the southern margin of the Avalonian mi-crocontinent (Cocks et al., 1997). This basin was limited by the Euramerican Old Red Continent to the north and by the Normannian and Mid-German highs to the south (Ziegler, 1990). The apparent polar wander paths of Avalonia and Eu-ramerica are well established (Torsvik et al., 1993; Mac Nio-caill and Smethurst, 1994). Torsvik et al. (1993) estimated the paleolatitude of Southern Britain at 389 Ma to be 6.9◦S. During the Middle-Devonian, the studied section and South-ern Britain were only a few hundred kilometres apart (Cocks et al., 1997) and consequently this value serves as a good estimate for the paleolatitude of the section.
The section has been subdivided in different microfa-cies corresponding to two main depositional settings: open marine at the base of the section and fore-reef at the top (Fig. 2; Mabille and Boulvain, 2007). Open marine fa-cies correspond to a succession of argillaceous mudstones and packstones carbonates with crinoids and brachiopods. Rudstones with stromatoporoids debris, tabulate and rugose corals, followed by packstones and grainstones with peloids characterise the overlying fore-reef carbonate facies (Mabille and Boulvain, 2007). 20 Figures 1 2 3
Figure 1. Mid-Devonian paleogeography (after Ron Blakey, Northern Arizona University 4
Geology) and present-day situation of the “La Couvinoise” section. 5
6
Fig. 1. Mid-Devonian paleogeography (after Ron Blakey, Northern
Arizona University Geology) and present-day situation of the “La Couvinoise” section.
3 Materials and methods
3.1 Magnetic Susceptibility as a climate proxy
Magnetic Susceptibility (MS) represents the degree of mag-netization of a material in response to an applied magnetic field. It quantitatively measures the amount of magnetic min-erals in a sample. The MS of a sediment forms a proxy for the rate of supply of the magnetic susceptible lithogenic or detrital fraction to the marine system (Ellwood et al., 2000). The MS measurements were made on a KLY-3 Kappabridge device. Three measurements were made on each sample and the average MS was taken to construct the record. Sam-ples were weighted with a precession of 0.01 g (detailed de-scription of methodology in Da Silva and Boulvain, 2006). In the studied section, large-scale MS variations can be as-cribed to relative sea-level changes (Mabille and Boulvain, 2007; Da Silva et al., 2009). On a shorter time-scale, cli-mate, through the intensity of wind and precipitation, plays a decisive role in respectively determining the eolian and river-ine flux of magnetic mriver-inerals to the marriver-ine system (Ellwood et al., 2000; Hladil et al., 2006; Riquier et al., 2010) as it was, in this case, the Rheic Ocean (Fig. 1). For the Eifelian and Givetian in the southern border of the Dinant Synclinorium, diagenesis did not obliterate the primary signal, as the MS re-mains strongly related to depositional environment. Also, an estimate of detrital quartz content in the thin section demon-strates a strong correlation between the abundance of detrital quartz and MS values (Fig. 9 in Mabille and Boulvain, 2007). While the detrital quartz does not carry the MS signal, it is a good indicator of the detrital input. It appears, thus, that MS is likely correlated to detrital input and not entirely con-trolled by diagenesis (Mabille and Boulvain, 2007). More-over, MS revealed itself as a powerful tool to establish ac-curate stratigraphic correlations between the studied section
21 1
2
Figure 2. The “La Couvinoise” section: Magnetic Susceptibility and facies belts (modified 3
after Boulvain et al., 2010). Key to facies numbers: Open marine facies: 1 = Argillaceous 4
mudstone; 2 = Argillaceous bioclastic wackestone; 3 = Brachiopods-crinoids argillaceous 5
packstones; Fore-reef facies: 4 = Floatstones and rudstones with reefal debris; 5 = 6
Stromatoporoids bindstones; 6 = Peloidal packstones-grainstones; 7 = Peloidal-crinoidal 7
grainstones. 8
Fig. 2. The “La Couvinoise” section Magnetic Susceptibility
and facies belts (modified after Boulvain et al., 2010). Key to facies numbers: open marine facies: 1 = Argillaceous mud-stone; 2 = Argillaceous bioclastic wackemud-stone; 3 = Brachiopods-crinoids argillaceous packstones; Fore-reef facies: 4 = Floatstones and rudstones with reefal debris; 5 = Stromatoporoids bind-stones; 6 = Peloidal packstones-grainbind-stones; 7 = Peloidal-crinoidal grainstones.
and a contemporaneous section, a few kilometres to the west, which is characterised by a major divergence in terms of sed-imentary dynamics (Mabille and Boulvain, 2007). There-fore, the MS signal used for time-series analyses can be con-sidered primary and robust to lateral sedimentological and facies variations.
In today’s world, the response of different tropical mon-soon systems to orbital, Milankovi´c forcing is clearly demon-strated (e.g., Kutzbach, 1981; Kutzbach and Liu, 1997; Tuenter et al., 2003). In comparison, the Devonian tropi-cal climate potentially exhibited an even more intense mon-soonal circulation (Streel et al., 2000), characterised by sea-sonally wet-and-dry climates (Cecil, 1990). As early as 1916, Joseph Barrell interpreted the red sandstones, shales and conglomerates of the Devonian system in the British Isles as “fluviatile in origin; laid down over river flood plains
by streams in times of flood, exposed to air in times of drought. They record in this way the existence of an alterna-tion of seasons of rainfall and drought -a climate with an arid season, but not an arid climate. [...] Sediment was brought into these basins by rivers from the bordering uplands and from the more distant regions to the northwest. The excess beyond what was laid down by the rivers in time of flood to maintain their grade across the sinking basins was carried through to the shallow sea which lay on the surface of the continent to the southwest”. As the studied section is lo-cated in this shallow sea of the Rhenohercynian basin, the flux of detrital material into this depositional environment will reproduce the seasonal pattern. Ever since Barrell’s in-terpretation (1916), paleoclimatic indicators confirmed this view (e.g., Woodrow et al., 1973; Heckel and Witzke, 1979; Woodrow, 1985; Witzke and Heckel, 1988; Sageman et al., 2003; Cressler, 2006; Cressler et al., 2010), and a consensus on the seasonal wet-and-dry climate model for the Devonian of the Euramerican coastal plains exists. The paleolatitude combined with the proximity of large continental areas (as well Euramerica as Gondwana) play an important role in de-termining the potential for an intense monsoonal circulation over Euramerica (Witzke, 1990). Given the significant influ-ence of astronomical forcing on modern monsoonal systems, it is highly probable that also during the Devonian period, Milankovi´c cycles influenced the climatic factors controlling the detrital inputs to the Rhenohercynian basin (i.e., wind and precipitation) and/or of carbonate productivity, both affecting the MS signal (Riquier et al., 2010).
3.2 Time-series analysis procedure
The frequency composition of the magnetic susceptibility signal is analysed via spectral analysis, using the multita-per method (MTM; Thomson, 1982), as implemented in the SSA-MTM Toolkit (Ghil et al., 2002). Before the imple-mentation of MTM spectral analysis, long-term trends were removed from the MS data by subtracting the continuous linear trend. A constant spacing (in depth) between sam-ple points in the series was generated by linear interpolation at intervals approximating the average sample spacing. The MTM-method was performed using 3 tapers to compromise between resolution and sidelobe reduction. Small variations in the accumulation rate behave like phase modulations and introduce erroneous spectral peaks (Muller and MacDonald, 2000). The MTM-method is selected because it averages these sidelobes into the main peak and, thereby, gives a su-perior estimate of the true spectral power. Noise in paleocli-mate signals is frequently “1/f noise” or “red noise”, which means that the power spectrum of the background shows a strong enhancement at the low frequency end (Muller and MacDonald, 2000). The 90 % and 99 % confidence limits (CLs) are calculated to visualize the most significant devia-tions from the null hypothesis of red noise (robust AR(1) es-timation, median smoothing window width = (101t )−1, Log Fit, fNyquist= 2/1t).
The microfacies curve is obtained by digitizing the mi-crofacies log, resulting in square wave data. The step-like changes in microfacies can only be represented us-ing multiple additional sine and cosine components durus-ing a Fourier transformation, polluting the spectrum (Proakis and Menolakis, 1996; Weedon, 2003). Therefore, spectral analysis on the microfacies curve was carried out using the Walsh and Blackman-Tukey (BT) method for spectral anal-ysis. Walsh power spectra are based on the use of square waves instead of sine and cosine waves. The equivalent of a Fourier Transform can be generated using the Walsh trans-form (Beauchamp, 1975; Weedon, 1989). The Blackman-Tukey method is based on the Fourier transform as part of the autocovariance sequence. The autocovariance sequence contains the same frequency oscillations as the microfacies series, but is no longer characterised by step-like changes.
Frequency-selective filters or band-pass filters isolate a specific range of frequencies from a signal. Consequently, it is an excellent device to assess the behaviour of a specific range of frequencies in a studied signal. The Analyseries software is used to calculate the filtered signals (Paillard et al., 1996).
The analysis of amplitude modulations (AM) constitutes a useful tool in cyclostratigraphy: the astronomical theory states that the amplitude of the precession parameter is modulated by eccentricity. To examine possible amplitude modulations in the studied signal, the precession parame-ter was first extracted from the signal by band-pass filparame-ter- filter-ing. Subsequently, its amplitude envelope was extracted by complex demodulation, based on the Hilbert transform (Bloomfield, 2004).
3.3 Possible distortions of the astronomical frequencies When interpreting cyclic sedimentary alternations as a con-sequence of periodic changes in the orbital parameters of the Earth, one should be aware of the fact that the assumption of a 1:1 recording of astronomical signals in carbonate sed-iments is questionable (Westphal et al., 2004). The origi-nal astronomical sigorigi-nal can be altered by the climatic sys-tem, responding in a nonlinear way to the applied forcing. Moreover, a sediment column recording climatic changes never represents these temporal changes in a linear manner. For example, variations in sedimentation rate, bioturbation, differential compaction and pressure dissolution can be re-sponsible for distortions of the orbital frequencies in sedi-mentary records. To account for these possible overprint-ing factors, some assumptions and restrictions must be re-spected. On carbonate platforms and ramps, sediment pro-duction rate is above other factors, a function of carbonate productivity. The main trend is a decrease in the carbon-ate productivity with increasing depth, with maximum car-bonate production in the reefal environments (Da Silva et al., 2009). Therefore, the two main sedimentary environ-ments represented in the “La Couvinoise” section (Fig. 2) are
characterised by significantly different accumulation rates. A significantly higher accumulation rate characterises the fore-reef environment compared to the open marine environment (Da Silva et al., 2009). In depositional environments with different accumulation rates, cycles of equal duration will be expressed by sediment packages of different thickness. This phenomenon could render the application of spectral analysis on a distance-series including different depositional settings impossible. However, if one assumes that accumulation rate within the same sedimentary environment is semi-constant, MTM-spectral analysis can be carried out separately for the two main sedimentary environments of the “La Couvinoise” section. For the “La Couvinoise” section, no indications for hiatuses or for differential compaction within a sedimentary environment are found.
4 Results and discussion
4.1 Recognition and identification of astronomical cycles
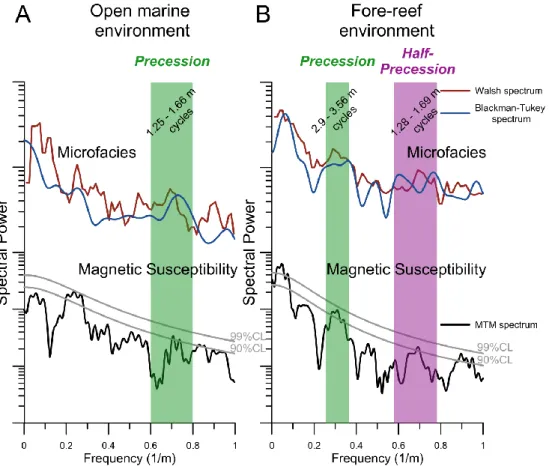
For the open marine environment, the Walsh and BT spectral plots of the microfacies data are characterised by an elevated spectral power, around frequency 0.7 (Fig. 3a). Moreover, an increased spectral power that extends above the 90 %CL can be found at the same frequency on the MTM spectral plot of the MS data. In the fore-reef environment, the Walsh and BT spectral plots of the microfacies-data (Fig. 3b) exhibit three significant spectral peaks: around frequency 0.05 m−1,
around 0.3 m−1and around 0.7 m−1. Remarkably, the MTM spectral plot of the MS data reveals the exact same pattern (Fig. 3b). A similar spectrum for magnetic susceptibility and microfacies indicates that microfacies and MS record the same environmental variations. Therefore, common indi-cations for astronomical forcing are more credible, whereas differences between both proxies call for a critical evalua-tion of the extent to which astronomical forcing influenced environmental changes.
The only time-constraint available in the studied section is the existing biostratigraphy and more precisely the delin-eation of the ensensis conodont biozone between the bottom of the section and 33.75 m. The hemiansatus conodont zone cannot be used as a time-constraint because its top does not occur in the “La Couvinoise” section. In well-studied sec-tions from the Eifel region, the ensensis biozone covers about 8 % of the duration of the Eifelian (Weddige, 1977; Bul-tynck et al., 1988; Kaufmann, 2006). As the Eifelian lasted for 3.8 ± 6 Myr (Kaufmann, 2006), the ensensis biozone has a duration of 304 ± 480 kyr. Therefore, one of the 23 ob-served cycles in the ensensis biozone (1.25–1.66 m thick) lasted for 13.2 ± 20.9 kyr. Despite the huge spread in these values, the observed persistent cyclicity can most probably be assigned to the ∼18-kyr Middle-Devonian precession cy-cle (with quasiperiods of 16 824 and 19 886 kyr; Berger and
22 1
2
Figure 3. Spectral analyses on the different depositional environments of the “La Couvinoise” 3
section separately. A: Spectral analyses on the microfacies series and Magnetic Susceptibility 4
series of the lower part of the section (open marine environment). B: Spectral analyses on the 5
microfacies series and Magnetic Susceptibility series of the upper part of the section (fore-reef 6
environment). CL = Confidence Limit. 7
8
Fig. 3. Spectral analyses on the different depositional environments of the “La Couvinoise” section separately. (A): spectral analyses on the
microfacies series and Magnetic Susceptibility series of the lower part of the section (open marine environment). (B): spectral analyses on the microfacies series and Magnetic Susceptibility series of the upper part of the section (fore-reef environment). CL = Confidence Limit.
Loutre, 1989; Berger et al., 1992). One can note that the ∼33 kyr period of the obliquity cycle lies at the uppermost end of the error bar, but it can almost certainly be excluded as a driving force of the observed cycles since the influence of obliquity on seasonal insolation at low latitudes is very small compared to the precession effect and ice-related tele-connections to higher latitudes are negligible. The interpre-tation of the distinguished cyclicity as precession cycles im-plies a duration of ∼414 kyr for the ensensis biozone and an astronomically calibrated average accumulation rate of 8.15 cm kyr−1for this biozone in the studied section. Taking into account the superior sedimentation rate in a fore-reef de-positional setting compared to an open-marine environment, it is expected that sedimentary cycles related to precession are thicker in the fore-reef environment, compared to the open marine environment (Da Silva et al., 2009). Therefore, in the upper part of the section, the 2.9–3.56 m cycles are interpreted as the result of precession. The 1.28–1.69 m cy-cles in this part of the section have a period that is about half the precessional period. If this interpretation is correct, the average sedimentation rate in the fore-reef part of the sec-tion lies around 18 cm kyr−1. The astronomically derived
sedimentation rates (8.15 cm kyr−1 in the open marine
en-vironment and 18 cm kyr−1in the fore-reef environment) are in the same order of magnitude as the average sedimenta-tion rate calculated for the whole Givetian for the paleolo-cation of Southern Belgium (i.e., 10.5 cm kyr−1; Boulvain et al., 2010) or as the estimates of accumulation rate made for a contemporaneous (Mid-Eifelian to basal-Givetian) section in the nearby Eifel region (Rhenish Massif): 12.53 cm ka−1
(Weddige, 1977; Bultynck et al., 1988; Kaufmann, 2006). The two latter average sedimentation rates, extracted from literature, were calculated over different depositional envi-ronments, ranging from open marine to internal platform. The fact that these average values fall right in the middle between our astronomically derived sedimentation rates for the open marine and fore-reef environment can be seen as a strong indication that the correct astronomical interpretation was made.
In the open marine environment 1.25–1.66 m cycles were interpreted as the imprint of precession, while in the fore-reef environment precession is depicted in the form of 2.9–3.56 m cycles. These interpretations render possible the transforma-tion of the magnetic susceptibility distance-series into a time-series (Fig. 4). The precessional cycles are extracted from the distance-series by band-pass filtering the lower part of the
23 1
2
Figure 4. From distance-series to time-series. A: Magnetic Susceptibility series of the “La 3
Couvinoise” section plotted against a distance-axis (black) and band-pass filtered Magnetic 4
Susceptibility signal at the frequencies of precession (green, band-pass filtered between 1.25-5
1.66m in the lower part and between 2.9-3.56m in the upper part of the section). B: Magnetic 6
Susceptibility series of the “La Couvinoise” section plotted against a time-axis (black) and 7
band-pass filtered Magnetic Susceptibility signal at the frequency of precession (band-pass 8
filtered between 15 and 23 kyr; green) + amplitude envelope of the precessional signal 9
(brown). 10
Fig. 4. From distance-series to time-series. (A): Magnetic Susceptibility series of the “La Couvinoise” section plotted against a distance-axis
(black) and band-pass filtered Magnetic Susceptibility signal at the frequencies of precession (green, band-pass filtered between 1.25–1.66 m in the lower part and between 2.9–3.56 m in the upper part of the section). (B): Magnetic Susceptibility series of the “La Couvinoise” section plotted against a time-axis (black) and band-pass filtered Magnetic Susceptibility signal at the frequency of precession (band-pass filtered between 15 and 23 kyr; green) + amplitude envelope of the precessional signal (brown).
section between frequencies 0.6 and 0.8 m−1 (1.25–1.66 m periodicity) and by filtering the upper part of the section be-tween frequencies 0.28 and 0.35 m−1(2.9–3.56 m periodic-ity; Fig. 4a). By counting the precessional cycles and mul-tiplying them by the period of precession (i.e., ∼18 kyr), the MS-series can be rescaled relative to a time-axis (Fig. 4b). On Fig. 4, 41.3 precessional cycles can be counted in the “La Couvinoise” section. This implies that the section was deposited in ∼744 kyr. When the constructed time-series is band-pass filtered at the frequency of precession (between 0.043 and 0.067 kyr−1, i.e., 15–23 kyr periodicity), a ∼100-kyr cyclicity is observed in the amplitude envelope of the pre-cessional cycles (Figs. 4b and 5a). This observation strongly suggests the amplitude modulation of the precessional cycles by eccentricity.
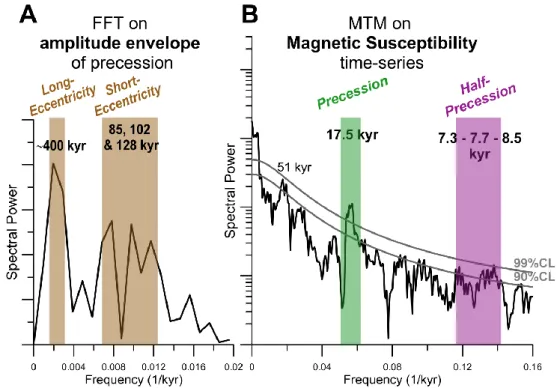
Using the constructed time-series (Fig. 4b) instead of the distance-series, spectral analysis is again carried out on the MS data (Fig. 5b). The reenactment of spectral analysis brings two significant improvements: first, the “La Couvi-noise” section is considered as a whole, rather than in two different parts, so that the continuity of the cycles can be bet-ter tested. Second, the problem of accumulation rate varia-tions within a depositional environment is bypassed. The re-sulting spectral plot (Fig. 5b) shows a very strong peak at the frequency of precession (17.5 kyr). Of course, the magnitude of this spectral peak is partly conditioned by the procedure of time-axis composition. For this reason, no further conclu-sions can be drawn from the magnitude of this spectral peak. However, there is no reason to doubt the statistical signifi-cance of this peak as the time-axis composition is based on
24 1
2
Figure 5. Spectral analyses on the MS series of the “La Couvinoise” section as a whole. A: 3
Fast Fourier Transform (FFT) periodogram of the amplitude envelope of the precessional 4
signal. A linear “spectral power” axis is chosen to give an immediate sense of how much of 5
the variance comes from each cycle. B: Multitaper method (MTM) power spectrum of the “La 6
Couvinoise” MS data as a time-series. A logarithmic “spectral power” axis is chosen to make 7
the statistical significance of peaks evident, particularly for small high-frequency peaks. CL = 8
Confidence Limit. 9
10
Fig. 5. Spectral analyses on the MS series of the “La Couvinoise” section as a whole. (A): fast Fourier Transform (FFT) periodogram of
the amplitude envelope of the precessional signal. A linear “spectral power” axis is chosen to give an immediate sense of how much of the variance comes from each cycle. (B): multitaper method (MTM) power spectrum of the “La Couvinoise” MS data as a time-series. A logarithmic “spectral power” axis is chosen to make the statistical significance of peaks evident, particularly for small high-frequency peaks. CL = Confidence Limit.
a robust spectral analysis of the MS signals of the different sedimentary environments (Fig. 3). Also, Fig. 5b allows to explore the influence of other astronomical parameters than precession: one would expect a spectral peak around 0.03 and 0.01 kyr−1 if respectively obliquity and 100-kyr eccen-tricity would influence the MS signal of the “La Couvinoise” section (Berger et al., 1992). At these frequencies no out-standing spectral peak can be found, advocating that obliq-uity and eccentricity do not strongly influence the MS signal in a direct way. To test for the indirect effect of eccentricity-forcing, Fig. 5a shows the spectral plot (Fast Fourier Trans-formation, FFT) of the amplitude envelope of the precession cycles that contains strong peaks at periodicities 128, 102 and 85 kyr. These peaks correspond well to the theoretical periods of short-eccentricity (i.e., 125 and 95 kyr). How-ever, it should be noted that the double peak associated with short-eccentricity can also be the result of slightly varying sedimentation rates, behaving as phase modulations. Also in Fig. 5a, a low-frequency spectral peak occurs between fre-quency 0.002 and 0.003, which can be related to long 405-kyr eccentricity. These results demonstrate that the ampli-tude envelope of the precession signal is modulated by ec-centricity. The recognition of the amplitude modulation of the precession cycles by eccentricity can be considered as an independent confirmation of the accuracy of the time-series construction.
Moreover, on Fig. 5b, another cluster of spectral peaks can be observed between frequencies 0.12 and 0.14 kyr−1(7.3– 8.5 kyr periodicity). At periodicity 7.3 kyr the spectral peak even exceeds the 99 % CL. This pattern seems to suggest the presence of half-precessional cycles recorded in the MS stratigraphy of the “La Couvinoise” section.
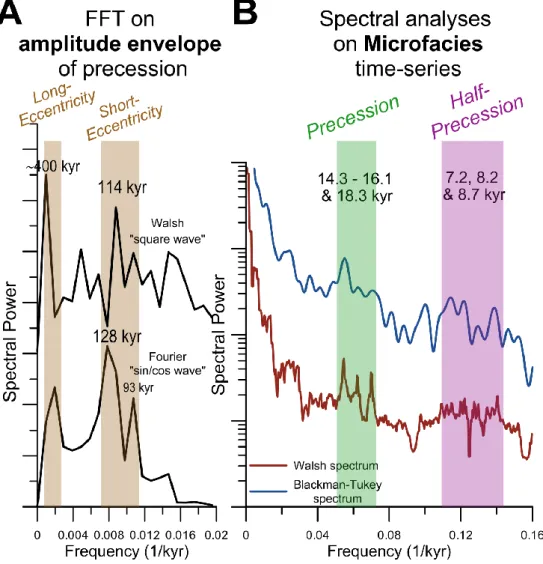
In Fig. 6a, the microfacies curve is rescaled and plot-ted against a time-axis, based on the same procedure as for the MS series. Both the Walsh transform (Fig. 6b) as the Fourier transform (Fig. 6c) were used as the basis for cal-culating a band-pass filter centred on the frequency of pre-cession (between 15 and 23 kyr). Both filters demonstrate that a large fraction of the microfacies variation in the stud-ied section happens on a precessional time-scale. Moreover, an important amplitude modulation of the precessional sig-nal becomes clear (Fig. 6b and c), characterised by a strong 93 to 128 kyr period (Fig. 7a). This amplitude modulation is interpreted as the influence of the short-eccentricity cy-cle. Analogous to the MS data, the constructed microfacies time-series (Fig. 6) is used instead of the distance-series to reenact spectral analysis on the “La Couvinoise” section as a whole. The resulting spectral plots (Fig. 7b) all exhibit a sig-nificant spectral peak at frequency 0.0547 kyr−1(18.3 kyr pe-riod) that can be related to precession. The Walsh spectrum shows additional precession-related peaks at periods of 14.3 and 16.1 kyr. In the frequency range, where half-precessional
25
1
Figure 6. A: Microfacies series of the “La Couvinoise” section plotted against a time-axis. B:
2
Band-pass filtered microfacies signal at the frequency of precession (filtered between 15 and
3
23 kyr; green) based on the Walsh Transform + amplitude envelope (brown). C: Band-pass
4
filtered microfacies signal at the frequency of precession (15-23 kyr; green) based on the
5
Fourier Transform + amplitude envelope (brown). D: Band-pass filtered MS signal at the
6
frequency of precession (15-23 kyr; green) based on the Fourier Transform + amplitude
7
envelope (brown). E: MS signal of the “La Couvinoise” section plotted against a time-axis.
8
Purple triangles indicate those precessional cycles within which the half-precessional cycles
9
are well developed.
10
11
Fig. 6. (A): microfacies series of the “La Couvinoise” section plotted against a time-axis. (B): band-pass filtered microfacies signal at the
frequency of precession (filtered between 15 and 23 kyr; green) based on the Walsh Transform + amplitude envelope (brown). (C): band-pass filtered microfacies signal at the frequency of precession (15–23 kyr; green) based on the Fourier Transform + amplitude envelope (brown).
(D): band-pass filtered MS signal at the frequency of precession (15–23 kyr; green) based on the Fourier Transform + amplitude envelope
(brown). (E): MS signal of the “La Couvinoise” section plotted against a time-axis. Purple triangles indicate those precessional cycles within which the half-precessional cycles are well developed.
cycles are expected, i.e., between 0.10 and 0.14 kyr−1 (be-tween 7 and 10 kyr periodicity), the BT and Walsh spectrum suggest 3 or 4 spectral peaks. Although not very extensive, these peaks seem to confirm the presence of an important half-precessional cycle. On Fig. 6a, the stratigraphic posi-tions where half-precessional cycles are well developed in the microfacies curve are indicated by purple triangles.
Obviously, the amplitude modulation for both MS and microfacies must exhibit a similar pattern throughout the section to justify the interpretation of these modulations as eccentricity-forced. Therefore, the MS precessional cycles and their amplitude envelope (Fig. 6d) are plotted next to the microfacies precessional cycles and their amplitude envelope (Fig. 6b and c). The comparison of the two amplitude en-velopes shows that they indeed show a similar development throughout the section and gives rise to the delineation of five full short-eccentricity cycles. The period of these eccentric-ity cycles between 108 and 131 kyr is in quite good agree-ment to the theoretical periods of short-eccentricity (i.e., 95 and 125 kyr).
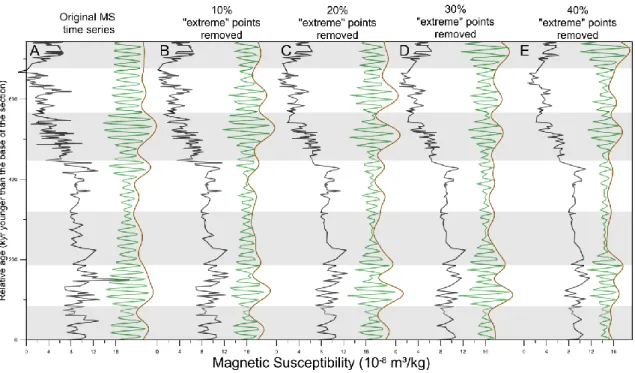
So far, the amplitude modulation of the precession signal by eccentricity is seen as a confirmation of the astronomical interpretation. However, it is equally crucial to test the ro-bustness of the amplitude modulation itself. In order to test if the amplitude modulation depends on few extreme MS val-ues, or if it is truly the expression of amplitude-changes of precession-related MS variations, following procedure was carried out. The magnetic susceptibility time-series consists of 236 points (Fig. 8a). The time-series was divided into 11 intervals of 20 points and an interval of 16 points. Of each interval, the maximal and minimal MS values were removed. In other words, 12 times 2 MS measurements were taken out of the time-series. The result is a time series with 212 points (i.e., 10 % less than the original time-series; Fig. 8b). This process, in which 12 times 2 points are deleted, was repeated to obtain a time-series with 188 points (i.e., 20 % less than the original time-series; Fig. 8c). In an analo-gous way, time-series consisting of 164 points (i.e., 30 % less than the original time-series; Fig. 8d) and 140 points (i.e., 40 % less than the original time-series; Fig. 8e) were created. The elimination of 10 % extreme points from the
26 1
2
Figure 7. Spectral analyses on the microfacies series of the “La Couvinoise” section as a 3
whole. A: FFT periodogram of the amplitude envelope of the precessional signal. Upper: 4
based on Walsh Transform (Fig. 6B); Lower: based on Fourier Transform (Fig. 6C). A linear 5
“spectral power” axis is chosen to give an immediate sense of how much of the variance 6
comes from each cycle. B: MTM power spectrum of the “La Couvinoise” microfacies curve 7
as a time-series. A logarithmic “spectral power” axis is chosen to make the statistical 8
significance of peaks evident, particularly for small high-frequency peaks. CL = Confidence 9
Limit. 10
Fig. 7. Spectral analyses on the microfacies series of the “La Couvinoise” section as a whole. (A): FFT periodogram of the amplitude
envelope of the precessional signal. Upper: based on Walsh Transform (Fig. 6b); Lower: based on Fourier Transform (Fig. 6c). A linear “spectral power” axis is chosen to give an immediate sense of how much of the variance comes from each cycle. (B): MTM power spectrum of the “La Couvinoise” microfacies curve as a time-series. A logarithmic “spectral power” axis is chosen to make the statistical significance of peaks evident, particularly for small high-frequency peaks. CL = Confidence Limit.
time-series influences the amplitude modulation to a limited extent, and would lead to a similar delineation of the 100-kyr eccentricity cycles. When 20 % or more extreme points are removed, amplitude modulation is hardly observable in parts of the section that are characterised by a relatively low sampling resolution. Still, in high-resolution intervals, the removal of extreme points does not obliterate the amplitude modulation pattern. Therefore, Fig. 8 clearly demonstrates that the amplitude modulation is not the result of a few ex-treme MS values, but of a true amplitude modulation of the precession-related cyclicity by eccentricity.
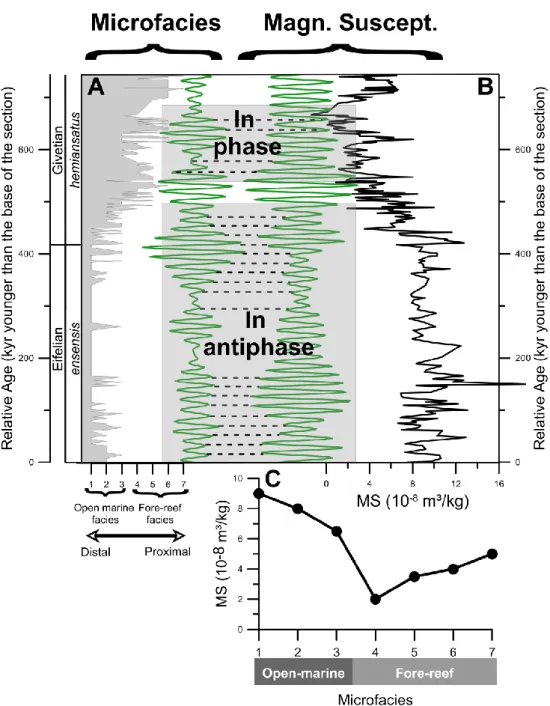
When the precessional variations in microfacies and MS are compared, it is clear that in the lower part of the section, these variations are in antiphase with each other (Fig. 9). In this part of the section, more proximal microfacies
cor-respond to MS minima. To the contrary, in the upper part of the section, the precessional variations in the microfa-cies curve are in phase with precessional variations in the MS curve and thus proximal microfacies correspond to MS maxima (Fig. 9). This observation can be explained by the evolution of mean MS values on relative proximity transects (Fig. 9c; Da Silva et al., 2009). In the lower part of the section, deposition occurred in an open marine environment. In such a setting, a shift to a more proximal environment is characterised by a higher carbonate productivity (diluting the MS signal) and water agitation (preventing the deposition of magnetic minerals). In the upper part of the section, depo-sition occurred in a fore-reef environment. Here, shifts to a more proximal environment usually encompass the occur-rence of peloidal pack- and grainstones. These microfacies,
27
1
Figure 8. Robustness-test of the amplitude modulation of the precessional signal in the MS
2
time-series. A: Origninal MS time-series (black), its precessional signal (green) and the
3
amplitude envelope of the precessional singal (brown). B - C - D - E: MS time-series of which
4
the 10% - 20% - 30% - 40% most extreme MS values are removed (black) and its
5
precessional signal (green).
6
7
8
Fig. 8. Robustness-test of the amplitude modulation of the precessional signal in the MS time-series. (A): origninal MS time-series (black),
its precessional signal (green) and the amplitude envelope of the precessional singal (brown). (B, C, D, E): MS time-series of which the 10 %–20 %–30 %–40 % most extreme MS values are removed (black) and its precessional signal (green).
which are indicative of a more restricted environment, are characterised by a higher MS compared to the more distal fore-reef microfacies (Fig. 9c; Da Silva et al., 2009). 4.2 Palaeoclimatological interpretation
The cycles driven by the astronomical parameters cannot be used as a geological metronome without an understand-ing of the way astronomical cycles influence the ferromag-netic minerals delivery processes towards the basin. The precessional forced MS variations in the “La Couvinoise” section are interpreted as the expression of variations in monsoon-circulation intensity. Here, it is hypothesized that the monsoon-circulation, rainfall intensity and the continen-tal detricontinen-tal sediment flux all depend on precession.
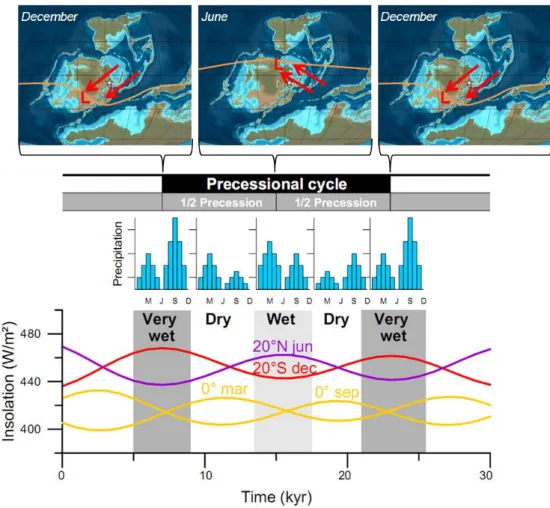
In Fig. 10, the monsoonal circulation on the east Euramer-ican continent is schematically illustrated and is based on the understanding of present monsoonal circulation. During Southern Hemispheric (SH) summer, a strong low-pressure cell develops above the Euramerican continent, allowing the Intertropical Convergence Zone (ITCZ) to cross the conti-nent. Under such a configuration, the eastern part of the con-tinent is dominated by a northeastern wind flow. During SH winter, the ITCZ zone is positioned in the Northern Hemi-sphere and the eastern part of the continent is dominated by the southeasterly trade winds.
Strong paleoclimate evidence from Africa, Australia, the Mediterranean and the Indian Ocean shows that today’s monsoonal circulation is intensely controlled by precession
(Clemens et al., 1991, 2010; deMenocal et al., 1993; Beau-fort et al., 2010; Dickson et al., 2010; Ziegler et al., 2010). Most likely, similar mechanisms are responsible for the pre-cessional cycles found in the studied “La Couvinoise” sec-tion. During a precession minimum (longitude of the perihe-lion ≈270◦), the Earth is situated near the perihelion (close to the sun) during austral summer solstice. This astronomi-cal configuration causes a significant increase in the amount of insolation that reaches the southern subtropics during SH summer. The additional heat results in an intensified ris-ing of warm air from the surface of the Euramerican conti-nent. Consequently, a significantly deeper low-pressure cell develops above the continent pushing the ITCZ southwards compared to a “normal” Southern Hemispheric Summer. Consequently, the transequatorial pressure gradient between the continental low-pressure cell and the subtropical high-pressure cell in the north increases and causes an intensified monsoonal circulation. In other words, the intensified zonal pressure gradient during a precession minimum enhances wind velocity and enables an increased moisture transport to-wards the continent, leading to enhanced precipitation. More precipitation leads to increased runoff that in turn leads to an increased flux of detrital material from the continent to the marine system and consequently, to a maximum in magnetic susceptibility. Therefore, precessional forcing of the amount of precipitation appears as an important forcing factor in the subtropical climate during the Devonian.
1
Figure 9. Precessional microfacies variation vs. precessional Magnetic Susceptibility
2
variation. A: Microfacies curve plotted against a time-axis and band-pass filtered microfacies
3
curve at the frequency of precession (between 15 and 23 kyr; left). B: Magnetic Susceptiblity
4
series plotted against a time-axis and band-pass filtered MS series at the frequency of
5
precession (between 15 and 23 kyr; right). C: Evolution of mean MS values on a relative
6
proximity transect (after Da Silva et al., 2009). The reversal of the slope of the MS evolution
7
on a relative proximity transect explains why precession-scale variations of microfacies and
8
MS are in antiphase in the lower part of the section and in phase in the upper part of the
9
section.
10
Fig. 9. Precessional microfacies variation vs. precessional Magnetic Susceptibility variation. (A): microfacies curve plotted against a
time-axis and band-pass filtered microfacies curve at the frequency of precession (between 15 and 23 kyr; left). (B): Magnetic Susceptibility series plotted against a time-axis and band-pass filtered MS series at the frequency of precession (between 15 and 23 kyr; right). (C): evolution of mean MS values on a relative proximity transect (after Da Silva et al., 2009). The reversal of the slope of the MS evolution on a relative proximity transect explains why precession-scale variations of microfacies and MS are in antiphase in the lower part of the section and in phase in the upper part of the section.
However, the MS stratigraphy of the “La Couvinoise” sec-tion also revealed cyclicity at the frequency of half a pre-cession cycle (∼9.8 kyr). Berger et al. (2006) demonstrated the presence of an 11-kyr period in modern equatorial inso-lation. This sub-Milankovi´c period, which is a harmonic of precession, is claimed to occur in paleoclimate archives of modern monsoonal systems (Hagelberg et al., 1994; Trauth
et al., 2003; Turney et al., 2004; Sun and Huang, 2006; Ver-schuren et al., 2009). Several mechanisms were suggested to explain how the 11-kyr astronomical cycle is transferred to climate: an amplified response of tropical precipitation and temperature to changes in maximum summer insolation in both hemispheres (Hagelberg et al., 1994), atmospheric and oceanic teleconnections (Turney et al., 2004), low-latitude
29 1
Figure 10. Monsoon-like circulation in eastern Euramerica during the Mid-Devonian 2
(Paleogeographic map from Ron Blakey, Northern Arizona University Geology). Intertropical 3
Convergence Zone (ITCZ) in orange. Important trade winds are indicated by red arrows. L: 4
Low pressure cell. A white stare indicates paleogeographic position of the study site. The 5
schematic representations of the monthly precipitation pattern illustrate the dependence of 6
precipitation intensity on precession. Insolation pattern is based on Berger et al. (1992) and 7
insolation strength is estimated considering a 5% lower solar luminosity. 8
9 10
Fig. 10. Monsoon-like circulation in eastern Euramerica during the Mid-Devonian (Paleogeographic map from Ron Blakey, Northern Arizona
University Geology). Intertropical Convergence Zone (ITCZ) in orange. Important trade winds are indicated by red arrows. L: Low pressure cell. A white stare indicates paleogeographic position of the study site. The schematic representations of the monthly precipitation pattern illustrate the dependence of precipitation intensity on precession. Insolation pattern is based on Berger et al. (1992) and insolation strength is estimated considering a 5 % lower solar luminosity.
insolation forcing of monsoon-intensity (Short et al., 1991; Sun and Huang, 2006; Verschuren et al., 2009). More-over, a coupled atmosphere/ocean/vegetation model demon-strated variations at periods of about 10 kyr in the monsoonal runoff, caused by the dynamic response of vegetation to pre-cessional forcing (Tuenter et al., 2007). In this study, the observed half-precession cyclicity demonstrates far-reaching analogies with the half-precessional cycles found in lacus-trine sediments of the past 25 000 yr in East-Africa (Ver-schuren et al., 2009). Both sedimentary archives are located in the ITCZ migration belt at almost the same latitude, both archives are positioned on the eastern coast of a large con-tinent and, thus, influenced by a northeastern and southeast-ern monsoon. Consequently, the forcing mechanism of the half-precessional cycles in the studied Middle-Devonian sec-tion can be interpreted in a similar way. Figure 10 shows that every ∼9 kyr the summer insolation peaks in either the northern or the southern tropics. As a consequence, every ∼9 kyr, the inter-hemispheric insolation gradient is at a
max-imum and either the southeasterly or northeasterly monsoon is intensified. Moreover, low March or September insola-tion weakens the corresponding rainy season (Berger et al., 2006; Verschuren et al., 2009). In the tropical paleoenvi-ronment of the studied section, this means that the flux of detrital material not only exhibits maxima during precession minima, but that it is also intensified during precession max-ima. More detailed climate study, involving climate mod-elling, will be needed to fully understand the relationship be-tween the half-precession period in equatorial insolation and its consequences in tropical and monsoonal climates.
5 Conclusions
Time series analyses of a high-resolution magnetic suscepti-bility signal from the Uppermost Eifelian and Lower Give-tian of Southern Belgium indicates that astronomical forcing affects detrital input into the Rhenohercynian Basin. During
the Uppermost Eifelian and Lower Givetian, the studied “La Couvinoise” magnetic susceptibility signal exhibits the di-rect influence of a 9.8-kyr half-precessional cycle and an 18-kyr-precessional cycle. Obliquity and eccentricity do not seem to strongly influence the MS signal, at least in a direct way. However, the amplitude-envelope of the precessional signal in MS and microfacies clearly demonstrates a ∼100-kyr variation that can be attributed to short 100-∼100-kyr eccen-tricity. Since this is the expected pattern according to astro-nomical theory, the interpretation of the observed cyclicity as precession-dominated can be considered reliable.
Over the last 3 Myr, low-latitude climate variability was closely intertwined with the onset and development of high-latitude continental ice-sheets, dominated by a ∼41 kyr and ∼100 kyr rhythm. In the studied Middle-Devonian climate record, these periodicities are completely absent. There-fore, it is suggested that in the Devonian extreme greenhouse world, without large continental ice sheets, millennial-scale tropical climate variability is dominated by precession and is not (or to a very limited extent) linked to high-latitude cli-mate variability. Most probably, changes in precession af-fected the transequatorial pressure gradient, its consequent monsoonal dynamics, rainfall intensity and the input of de-trital material in the Rheic Ocean. The recognition of a half-precessional cycle suggests the importance of the inter-hemispheric pressure gradient in the steering of monsoonal intensity. The role of the big Euramerican continent that stretches along both sides of the equator is undoubtedly very important in the development of a double monsoon-intensity maximum per precession cycle.
Acknowledgements. This study was made possible thanks to a
Ph.D. fellowship of the Research Foundation – Flanders (FWO) awarded to D. De Vleeschouwer. A.-C. Da Silva acknowledges the FRS-FNRS (Fond National de la Recherche Scientifique) for a post-doctoral position. Ph. Claeys thanks the VUB research fund as well as FWO (project G.A078.11) for support. Special thanks to Christian Zeeden (Utrecht University, The Netherlands) and two anonymous reviewers, whose thoughtful comments helped improve the manuscript significantly. This paper is part of the UNESCO International Geoscience Program (IGCP-580), entitled “Application of magnetic susceptibility as a paleoclimatic proxy on Paleozoic sedimentary rocks and characterization of the magnetic signal”.
Edited by: D.-D. Rousseau
References
Algeo, T. J., Scheckler, S. E., and Maynard, J. B.: Effects of the Middle to Late Devonian spread of vascular land plants on weathering regimes, marine biota, and global climate, in: Plants Invade the Land: Evolutionary and Environmental Approaches, edited by: Gensel, P. G. and Edwards, D., Columbia Univ. Press, New York, 213–236, 2001.
Barrell, J.: Dominantly Fluviatile Origin Under Seasonal Rainfall of the Old Red Sandstone, Proc. Natl. Acad. Sci. USA., 2, 498– 499, 1916.
Beauchamp, K. G.: Applications of Walsh and Related Functions, with an Introduction to Sequency Theory, Academic Press, New York, 1975.
Beaufort, L., van der Kaars, S., Bassinot, F. C., and Moron, V.: Past dynamics of the Australian monsoon: precession, phase and links to the global monsoon concept, Clim. Past, 6, 695–706, doi:10.5194/cp-6-695-2010, 2010.
Berger, A. and Loutre, M. F.: Pre-Quaternary Milankovitch fre-quencies, Nature, 342, 133, doi:10.1038/342133b0, 1989. Berger, A., Loutre, M. F., and Laskar, J.: Stability of the
Astro-nomical Frequencies over the Earth’s History for Paleoclimate Studies, Science, 255, 560–565, 1992.
Berger, A., Loutre, M. F., and M´elice, J. L.: Equatorial insolation: from precession harmonics to eccentricity frequencies, Clim. Past, 2, 131–136, doi:10.5194/cp-2-131-2006, 2006.
Berner, R. A.: Paleoclimate – The rise of plants and their effect on weathering and atmospheric CO2, Science, 276, 544–546, 1997.
Berner, R. A.: GEOCARBSULF: A combined model for Phanero-zoic atmospheric O2and CO2, Geochim. Cosmochim. Ac., 70,
5653–5664, doi:10.1016/j.gca.2005.11.032, 2006.
Bloomfield, P.: Fourier Analysis of Time Series: An Introduction, Wiley, New York, 288 pp., 2004.
Boulvain, F., Mabille, C., Poulain, G., and Da Silva, A. C.: A mag-netic susceptibility curve for the Devonian limestone from Bel-gium, Geol. Belg., 13, 113–117, 2010.
Bultynck, P., Dreesen, R., Groessens, E., Struwe, W., Weddige, K., Werner, R., and Ziegler, W.: Field Trip A. 1st International Senckenberg Conference and 5th European Conodont Sympo-sium (ECOS V), Contributions I, Guide to Field Trips, Courier Forschungsinsitut Senckenberg, Frankfurt, Germany, 1988. Cecil, C. B.: Paleoclimate Controls on Stratigraphic Repetition of
Chemical and Siliciclastic Rocks, Geology, 18, 533–536, 1990. Clemens, S. C., Prell, W. L., Murray, D., Shimmield, G., and
Wee-don, G.: Forcing mechanisms of the Indian Ocean monsoon, Na-ture, 353, 720–725, doi:10.1038/353720a0, 1991.
Clemens, S. C., Prell, W. L., and Sun, Y. B.: Orbital-scale timing and mechanisms driving Late Pleistocene Indo-Asian summer monsoons: Reinterpreting cave speleothem delta O-18, Paleo-ceanography, 25, PA4207, doi:10.1029/2010pa001926, 2010. Cocks, L. R. M., McKerrow, W. S., and vanStaal, C. R.: The
mar-gins of Avalonia, Geol. Mag., 134, 627–636, 1997.
Copper, P.: Silurian and Devonian reefs: 80 million years of global greenhouse between two ice ages, Soc. Econ. Pa., 72, 181–238, 2002.
Cressler, W. L.: Plant palaeoecology of the Late Devonian Red Hill locality, north-central Pennsylvania, an Archaeopteris-dominated wetland plant community and early tetrapod site, in: Wetlands trough time, edited by: Greb, S. F., and DiMichele, W. A., 399, Geol. S. Am. S., Boulder, CO, 79–102, 2006.
Cressler, W. L., Daeschler, E. B., Slingerland, R., and Peterson, D. A.: Terrestrialization in the Late Devonian: a palaeoecological overview of the Red Hill site, Pennsylvania, USA, in: The Ter-restrialization Process: Modelling Complex Interactions at the Biosphere-Geosphere Interface, edited by: Vecoli, M., Cl´ement, G., and Meyer-Berthaud, B., 339, Geol. Soc. SP., London, 111– 128, 2010.
Da Silva, A. C. and Boulvain, F.: Upper Devonian carbon-ate platform correlations and sea level variations recorded in magnetic susceptibility, Palaeogeogr. Palaeocl., 240, 373–388, doi:10.1016/j.palaeo.2006.02.012, 2006.
Da Silva, A. C., Mabille, C., and Boulvain, F.: Influence of sedi-mentary setting on the use of magnetic susceptibility: examples from the Devonian of Belgium, Sedimentology, 56, 1292–1306, 2009.
Dekker, S. C., Rietkerk, M., and Bierkens, M. F. P.: Coupling microscale soil water and macroscale vegetation-precipitation feedbacks in semiarid ecosystems, Glob. Chang. Biol., 13, 671–678, 2007.
deMenocal, P. B., Ruddiman, W. F., and Pokras, E. M.: Influences of High-Latitude and Low-Latitude Processes on African Ter-restrial Climate – Pleistocene Eolian Records from Equatorial Atlantic-Ocean Drilling Program Site-663, Paleoceanography, 8, 209–242, 1993.
Dickson, A. J., Leng, M. J., Maslin, M. A., and Rohl, U.: Oceanic, atmospheric and ice-sheet forcing of South East At-lantic Ocean productivity and South African monsoon inten-sity during MIS-12 to 10, Quaternary Sci. Rev., 29, 3936–3947, doi:10.1016/j.quascirev.2010.09.014, 2010.
Ellwood, B. B., Crick, R. E., El Hassani, A., Benoist, S. L., and Young, R. H.: Magnetosusceptibility event and cyclostratigraphy (MSEC) in marine rocks and the question of detrital input versus carbonate productivity, Geology, 28, 1135–1138, 2000. Flohn, H., Kapala, A., Knoche, H. R., and Maechel, H.: Water
vapour as an amplifier of the greenhouse effect, Meteorol. Z., 1, 122–138, 1992.
Ghil, M., Allen, M. R., Dettinger, M. D., Ide, K., Kondrashov, D., Mann, M. E., Robertson, A. W., Saunders, A., Tian, Y., Varadi, F., and Yiou, P.: Advanced spectral methods for climatic time series, Rev. Geophys., 40, 1–41, doi:10.1029/2000RG000092, 2002.
Hagelberg, T. K., Bond, G., and deMenocal, P.: Milankovitch Band Forcing of Sub-Milankovitch Climate Variability during the Pleistocene, Paleoceanography, 9, 545–558, 1994.
Hays, J., Imbrie, J., and Shackleton, N.: Variations in the Earth’s Orbit: Pacemaker of the Ice Ages, Science, 194, 1121–1132, 1976.
Heckel, P. H. and Witzke, B. J.: Devonian world paleogeogra-phy determined from distribution of carbonates and related lithic paleoclimatic indicators, in: The Devonian System, edited by: House, M. R., Scrutton, C. T., and Bassett, M. G., 23, Spec. Pap. Palaeontol., London, 99–123, 1979.
Hladil, J., Gersl, M., Strnad, L., Frana, J., Langrova, A., and Spisiak, J.: Stratigraphic variation of complex impurities in plat-form limestones and possible signi?cance of atmospheric dust: a study with emphasis on gamma-ray spectrometry and mag-netic susceptibility outcrop logging (Eifelian-Frasnian, Moravia, Czech Republic), Int. J. Earth Sci., 95, 703–723, 2006.
Kaufmann, B.: Calibrating the Devonian Time Scale – a synthesis of U-Pb ID-TIMS ages and relative, time-linear conodont stratigraphy, Earth-Sci. Rev., 76, 175–190, doi:10.1016/j.earscirev.2006.01.001, 2006.
Kutzbach, J. E.: Monsoon Climate of the Early Holocene – Climate Experiment with the Earths Orbital Parameters for 9000 Years Ago, Science, 214, 59–61, 1981.
Kutzbach, J. E. and Liu, Z.: Response of the African monsoon to
orbital forcing and ocean feedbacks in the middle Holocene, Sci-ence, 278, 440–443, 1997.
Kutzbach, J. E., Bonan, G., Foley, J., and Harrison, S. P.: Vegeta-tion and soil feedbacks on the response of the African monsoon to orbital forcing in the early to middle Holocene, Nature, 384, 623–626, 1996.
Le Hir, G., Donnadieu, Y., Godd´eris, Y., Meyer-Berthaud, B., Ram-stein, G., and Blakey, R. C.: The climate change caused by the land plant invasion in the Devonian, Earth. Planet. Sc. Lett., 310, 203–212, doi:10.1016/j.epsl.2011.08.042, 2011.
Mabille, C. and Boulvain, F.: Sedimentology and magnetic suscep-tibility of the Upper Eifelian – Lower Givetian (Middle Devo-nian) in southwestern Belgium: insights into carbonate platform initiation, in: Palaeozoic Reefs and Bioaccumulations: Climatic and Evolutionary Controls, edited by: Alvaro, J. J., Aretz, M., Boulvain, F., Munnecke, A., Vachard, D., and Vennin, E., 275, Geol. Soc. SP., London, 109–124, 2007.
Mac Niocaill, C. and Smethurst, M. A.: Paleozoic Paleogeography of Laurentia and Its Margins – a Reassessment of Paleomagnetic Data, Geophys. J. Int., 116, 715–725, 1994.
Muller, R. A. and MacDonald, G. J.: Ice ages and astronomical causes. Data, Spectral Analysis and Mechanisms, Springer, Lon-don, 318 pp., 2000.
Niedzwiedzki, G., Szrek, P., Narkiewicz, K., Narkiewicz, M., and Ahlberg, P. E.: Tetrapod trackways from the early Middle Devo-nian period of Poland, Nature, 463, 43–48, 2010.
Paillard, D., Labeyrie, L., and Yiou, P.: Macintosh program performs time-series analysis, Eos Trans. A. G. U., 77, 379, doi:10.1029/96EO00259, 1996.
Proakis, J. G. and Menolakis, D. G.: Digital Signal Processing, Principles, Algorithms and Applications, Prentice Hall, London, 1996.
Rind, D., Chiou, E. W., Chu, W., Larsen, J., Oltmans, S., Lerner, J., McCormkk, M. P., and McMaster, L.: Positive water vapour feedback in climate models confirmed by satellite data, Nature, 349, 500–503, 1991.
Riquier, L., Averbuch, O., Devleeschouwer, X., and Tribovillard, N.: Diagenetic versus detrital origin of the magnetic susceptib-lity variations in some carbonate Frasnian-Famennian boundary sections from Northern Africa and Western Europe: implications for paleoenvironmental reconstructions, Int. J. Earth Sci., 99, 57– 73, 2010.
Sageman, B. B., Murphy, A. E., Werne, J. P., Straeten, C. A. V., Hollander, D. J., and Lyons, T. W.: A tale of shales: the relative roles of production, decomposition, and dilu-tion in the accumuladilu-tion of organic-rich strata, Middle-Upper Devonian, Appalachian basin, Chem. Geol., 195, 229–273, doi:10.1016/S0009-2541(02)00397-2, 2003.
Short, D. A., Mengel, J. G., Crowley, T. J., Hyde, W. T., and North, G. R.: Filtering of Milankovitch Cycles by Earths Geography, Quaternary Res., 35, 157–173, 1991.
Streel, M., Caputo, M. V., Loboziak, S., and Melo, J. H. G.: Late Frasnian-Famennian climates based on palynomorph analyses and the question of the Late Devonian glaciations, Earth-Sci. Rev., 52, 121–173, 2000.
Sun, J. M. and Huang, X. G.: Half-precessional cycles recorded in Chinese loess: response to low-latitude insolation forcing during the Last Interglaciation, Quaternary Sci. Rev., 25, 1065–1072, doi:10.1016/j.quascirev.2005.08.004, 2006.
Thomson, D. J.: Spectrum Estimation and Harmonic-Analysis, P. Ieee, 70, 1055–1096, 1982.
Torsvik, T. H., Trench, A., Svensson, I., and Walderhaug, H. J.: Pa-leogeographic Significance of Mid-Silurian Paleomagnetic Re-sults from Southern Britain – Major Revision of the Apparent Polar Wander Path for Eastern Avalonia, Geophys. J. Int., 113, 651–668, 1993.
Trauth, M. H., Deino, A. L., Bergner, A. G. N., and Strecker, M. R.: East African climate change and orbital forcing dur-ing the last 175 kyr BP, Earth Planet. Sc. Lett., 206, 297–313, doi:10.1016/S0012-821x(02)01105-6, 2003.
Tuenter, E., Weber, S. L., Hilgen, F. J., and Lourens, L. J.: The response of the African summer monsoon to remote and local forcing due to precession and obliquity, Global Planet. Change., 36, 219–235, 2003.
Tuenter, E., Weber, S. L., Hilgen, F. J., and Lourens, L. J.: Simulat-ing sub-Milankovitch climate variations associated with vegeta-tion dynamics, Clim. Past., 3, 169–180, 2007.
Turney, C. S. M., Kershaw, A. P., Clemens, S. C., Branch, N., Moss, P. T., and Fifield, L. K.: Millennial and orbital variations of El Nino/Southern Oscillation and high-latitude climate in the last glacial period, Nature, 428, 306–310, doi:10.1038/Nature02386, 2004.
Verschuren, D., Damste, J. S. S., Moernaut, J., Kristen, I., Blaauw, M., Fagot, M., and Haug, G. H.: Half-precessional dynamics of monsoon rainfall near the East African Equator, Nature, 462, 637–641, doi:10.1038/Nature08520, 2009.
Weddige, K.: Die Conodonten der Eifel-Stufe im Typusgebiet und in benachbarten faziesgebieten, Senckenbergiana Lethaea, 58, 271–419, 1977.
Weedon, G. P.: The Detection and Illustration of Regular Sedimen-tary Cycles Using Walsh Power Spectra and Filtering, with Ex-amples from the Lias of Switzerland, J. Geol. Soc. London, 146, 133–144, 1989.
Weedon, G. P.: Time-series analysis and cyclostratigraphy: exam-ining stratigraphic records of environmental cycles, Cambridge University Press, Cambridge, U.K.; New York, xiii, 259 p., 2003. Westphal, H., Bohm, F., and Bornholdt, S.: Orbital frequencies in the carbonate sedimentary record: distorted by diagenesis?, Fa-cies, 50, 3–11, doi:10.1007/s10347-004-0005-x, 2004.
Witzke, B. J.: Palaeoclimates contrains for Palaeozoic palaeolati-tudes of Laurentia and Euramerica, in: Palaeozoic Palaeogeogra-phy and BiogeograPalaeogeogra-phy, edited by: McKerrow, W. S. and Scotese, C. R., Geo. Soc. Mem., London, 57–73, 1990.
Witzke, B. J. and Heckel, P. H.: Paleoclimatic indicators and in-ferred Devonian paleolatitudes of Euramerica, in: Devonian of the World, edited by: McMillan, N. J., Embry, A. F., and Glass, D. J., 14, Canadian Society of Petroleum Geologists Memoirs, 49–63, 1988.
Woodrow, D. L.: Paleogeography, paleocimate, and sedimentary processess of the Late Devonian Catskill Delta, in: The Catskill Deltra, edited by: Woodrow, D. L. and Sevon, W. D., 201, Geol. S. Am. S., Boulder, CO, 51–63, 1985.
Woodrow, D. L., Fletcher, F. W., and Ahrnsbra.Wf: Paleogeography and Paleoclimate at Deposition Sites of Devonian Catskill and Old Red Facies, Geol. Soc. Am. Bull., 84, 3051–3063, 1973. Ziegler, M., Tuenter, E., and Lourens, L. J.: The precession phase of
the boreal summer monsoon as viewed from the eastern Mediter-ranean (ODP Site 968), Quaternary Sci. Rev., 29, 1481–1490, doi:10.1016/j.quascirev.2010.03.011, 2010.
Ziegler, P. A.: Geological Atlas of Western and Central Europe, Shell International Petroleum, Mijdrecht, 1990.