https://doi.org/10.5194/nhess-19-775-2019 © Author(s) 2019. This work is distributed under the Creative Commons Attribution 4.0 License.
A susceptibility-based rainfall threshold
approach for landslide occurrence
Elise Monsieurs1,2,3, Olivier Dewitte1, and Alain Demoulin2,3
1Royal Museum for Central Africa, Leuvensesteenweg 13, 3080 Tervuren, Belgium 2Department of Geography, University of Liège, Clos Mercator 3, 4000 Liège, Belgium 3F.R.S. – FNRS, Egmontstraat 5, 1000 Brussels, Belgium
Correspondence: Elise Monsieurs ([email protected]) Received: 26 October 2018 – Discussion started: 6 November 2018
Revised: 18 March 2019 – Accepted: 30 March 2019 – Published: 15 April 2019
Abstract. Rainfall threshold determination is a pressing is-sue in the landslide scientific community. While major im-provements have been made towards more reproducible tech-niques for the identification of triggering conditions for land-sliding, the now well-established rainfall intensity or event-duration thresholds for landsliding suffer from several lim-itations. Here, we propose a new approach of the frequen-tist method for threshold definition based on satellite-derived antecedent rainfall estimates directly coupled with landslide susceptibility data. Adopting a bootstrap statistical technique for the identification of threshold uncertainties at differ-ent exceedance probability levels, it results in thresholds expressed as AR = (α ± 1α) · S(β±1β), where AR is
an-tecedent rainfall (mm), S is landslide susceptibility, α and β are scaling parameters, and 1α and 1β are their uncer-tainties. The main improvements of this approach consist in (1) using spatially continuous satellite rainfall data, (2) giv-ing equal weight to rainfall characteristics and ground sus-ceptibility factors in the definition of spatially varying fall thresholds, (3) proposing an exponential antecedent rain-fall function that involves past daily rainrain-fall in the expo-nent to account for the different lasting effect of large versus small rainfall, (4) quantitatively exploiting the lower parts of the cloud of data points, most meaningful for thresh-old estimation, and (5) merging the uncertainty on landslide date with the fit uncertainty in a single error estimation. We apply our approach in the western branch of the East African Rift based on landslides that occurred between 2001 and 2018, satellite rainfall estimates from the Tropical Rain-fall Measurement Mission Multi-satellite Precipitation Anal-ysis (TMPA 3B42 RT), and the continental-scale map of
landslide susceptibility of Broeckx et al. (2018) and provide the first regional rainfall thresholds for landsliding in tropical Africa.
1 Introduction
Rainfall is widely recognized as an important trigger for landslides (Sidle and Bogaard, 2016), posing an increased threat to people and economies worldwide under climate change conditions (Gariano and Guzzetti, 2016). Rainfall thresholds, defined as the best separators for triggering and non-triggering known rainfall conditions (Crozier, 1997), are the most used instrument in landslide hazard assessment and early warning tools (Segoni et al., 2018). Whereas physi-cally based models require detailed geotechnical, hydrologi-cal, and environmental parameters, which is achievable only on a hillslope to small-basin scale, the empirical approach is adopted for local to global scales (Guzzetti et al., 2007).
The most common parameters used to define empiri-cal thresholds are the combinations of rainfall intensity-duration, rainfall event-intensity-duration, and antecedent rainfall-conditions (Guzzetti et al., 2007). Standard approaches for the definition of the first two combinations of parameters are on the rise (e.g. Segoni et al., 2014; Vessia et al., 2014, 2016; Robbins, 2016; Rossi et al., 2017; Melillo et al., 2018) as substitutes for the formerly used subjective expert-judgement approaches (Aleotti, 2004; Brunetti et al., 2010). Conversely, no unanimous definition of triggering antecedent rainfall (AR) conditions is currently achieved. This is related to the complexity and process dependence of environmental
factors that influence the impact of AR on a slope (Sidle and Bogaard, 2016), yet it is regrettable because of AR physi-cal relation with soil shear strength and thus landslide poten-tial (Ma et al., 2014; Hong et al., 2018). AR has been taken into account by combining the rainfall accumulation periods identified as most significant for landslide triggering in the study area, varying up to 120 d depending on landslide type (Guzzetti et al., 2007). In some cases, an AR function convo-luting rainfall over the selected period is defined with the aim of reflecting the decaying effect of rainfall on soil moisture status (e.g. Crozier, 1999; Glade et al., 2000; Capparelli and Versace, 2011; Ma et al., 2014).
Once the triggering rainfall conditions of landslides have been quantitatively described, thresholds are determined through more and more refined techniques claiming objec-tivity and reproducibility (Segoni et al., 2018). Because the transition between triggering and non-triggering conditions for landslides cannot be sharply devised (Berti et al., 2012; Nikolopoulos et al., 2014), statistical approaches including probabilistic and frequentist methods have replaced a deter-ministic approach of the threshold definition. Probabilistic methods such as Bayesian inference (Guzzetti et al., 2007; Berti et al., 2012; Robbins, 2016) are based on relative fre-quencies, considering information on triggering and non-triggering rainfall conditions. Criticisms of this method are based on the biased prior and marginal probabilities related to the incompleteness of the landslide input data (Berti et al., 2012). Brunetti et al. (2010) proposed a frequentist method allowing threshold definition at different exceedance proba-bility levels, a method improved by Peruccacci et al. (2012) for the estimation of uncertainties associated with the thresh-old through a bootstrap statistical technique (Gariano et al., 2015; Melillo et al., 2016, 2018; Piciullo et al., 2017). A lim-itation of the frequentist approach is the dependency on a large and well-spread data set in order to attain significant results (Brunetti et al., 2010; Peruccacci et al., 2012). Other, less influential, threshold identification approaches are re-viewed by Segoni et al. (2018).
Regional ground conditions, but also the progressive ad-justment of landscapes to the governing climatic parameters, affect the meteorological conditions required for landsliding (Ritter, 1988; Guzzetti et al., 2008; Peruccacci et al., 2012; Parker et al., 2016). For this reason, thresholds gain in effi-ciency when rainfall regimes are accounted for through rain-fall normalization (e.g. Guzzetti et al., 2008; Postance et al., 2018) and when the input data are partitioned according to homogeneous predisposing ground conditions or failure pro-cesses (Crosta, 1998; Crosta and Frattini, 2001; Peruccacci et al., 2012; Sidle and Bogaard, 2016). Yet, to the authors’ knowledge no threshold mapping involving landslide sus-ceptibility as a proxy integrating the causative ground fac-tors has been proposed to date beyond local-scale physically based models (e.g. Aristizábal et al., 2015; Napolitano et al., 2016). Conversely, landslide early warning tools aim at coupling primary landslide susceptibility data and thresholds
based on rainfall characteristics, demonstrating the impor-tance of their combination for landslide prediction at regional to global scales (Piciullo et al., 2017; Kirschbaum and Stan-ley, 2018).
Though being identified as a pressing issue in the scien-tific community, rainfall threshold research is almost nonex-istent in Africa (Segoni et al., 2018) despite high levels of landslide susceptibility and hazard, especially in mountain-ous tropical Africa, characterized by intense rainfall, deep weathering profiles, and high demographic pressure on the environment (Aristizábal et al., 2015; Jacobs et al., 2018; Migo´n and Alcántara-Ayala, 2008; Monsieurs et al., 2018a). The lack of scientific investigation in this area is most likely related to the dearth of data on timing and location of land-slides (Kirschbaum and Stanley, 2018). However, the other fundamental data for threshold analysis, namely rainfall data, have been globally freely available through satellite rain-fall estimates (SREs) since the 1990s. Even if their use in threshold analysis remains limited (Brunetti et al., 2018; Segoni et al., 2018), SREs have many advantages in sparsely gauged areas such as tropical Africa. A review paper by Brunetti et al. (2018) reveals that, to date, the most recur-ring SRE products used for research on landslide trigger-ing conditions come from the Tropical Rainfall Measurtrigger-ing Mission (TRMM) (e.g. Liao et al., 2010; Kirschbaum et al., 2015; Cullen et al., 2016; Robbins, 2016; Nikolopoulos et al., 2017; Rossi et al., 2017).
The main objective of this paper is to devise an improved version of the frequentist method of rainfall threshold def-inition that goes beyond the sole aspect of rainfall charac-teristics and will be applicable in regions with limited rain-fall gauge data such as, for example, tropical Africa. Con-sequently, it will rely on the use of TRMM satellite rainfall data. Directly operational thresholds and threshold maps are expected from several methodological improvements regard-ing the definition of an elaborate AR function, the integration of climatic and ground characteristics (through landslide sus-ceptibility) into a 2-D trigger–cause graph, and a better focus on the information delivered by landslide events associated with low AR values. The western branch of the East African Rift (WEAR, Fig. 1) serves as a suitable study area prone to landsliding (Maki Mateso and Dewitte, 2014; Jacobs et al., 2016; Monsieurs et al., 2018a; Nobile et al., 2018), in which recent efforts have been made to collect information on landslide occurrence (Monsieurs et al., 2018a) and vali-date TRMM products (Monsieurs et al., 2018b).
2 Setting and data
2.1 Landslides in the WEAR
The study area extends over ∼ 350 000 km2 in the WEAR (Fig. 1). High seismicity (Delvaux et al., 2017), intense rain-fall (Monsieurs et al., 2018b), deeply weathered substrates
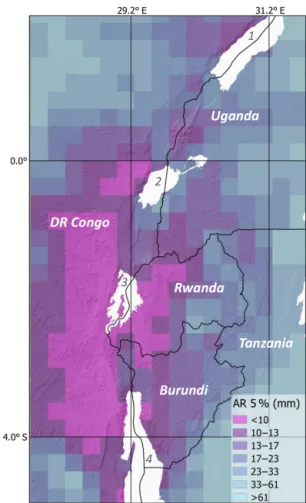
Figure 1. (a) Landslide susceptibility at 0.25◦resolution, derived from the map of Broeckx et al. (2018), and distribution of landslides in the western branch of the East African Rift, comprising 29 landslides in mining areas (triangles) and 145 landslides outside mining areas (dots) of which the red dots are landslides associated with antecedent rainfall less than 5 mm. Only the black dots (143 landslides) are used for calibrating the rainfall thresholds. (b) Spatial pattern of mean annual precipitation (MAP) based on 18 years (2000–2018) of TMPA (3B42 RT) data, and thus affected by significant underestimation (Monsieurs et al., 2018b). Numbers in the lakes are as follows. 1: Lake Albert; 2: Lake Edward; 3: Lake Kivu; 4: Lake Tanganyika. Background hillshade Shuttle Radar Topography Mission (90 m).
(e.g. Moeyersons et al., 2004), and steep slopes with an elevation range of 600 m at Lake Albert to 5109 m in the Rwenzori Mountains (Jacobs et al., 2016) are all predispos-ing factors renderpredispos-ing the area highly prone to landslidpredispos-ing (Maki Mateso and Dewitte, 2014; Broeckx et al., 2018; Mon-sieurs et al., 2018a; Nobile et al., 2018).
We updated the currently most extensive database exist-ing over the WEAR from Monsieurs et al. (2018a), which formerly contained information on the location and date of 143 landslide events that occurred between 1968 and 2016. New information on landslide occurrence was added through an extensive search of online media reports and to a lesser extent information from local partners. Only landslides with location accuracy better than 25 km and for which the date of occurrence is known with daily accuracy are included, with Monsieurs et al. (2018a) stressing that a residual uncer-tainty on landslide date especially affects landslides having occurred overnight. Information on the timing of the land-slide within the day of occurrence is rarely reported. Omit-ting pre-2000 events so as to adjust to the temporal coverage of the satellite rainfall data, the updated inventory comprises a total of 174 landslide events that occurred between 2001 and 2018 located with a mean accuracy of 6.7 km. Their
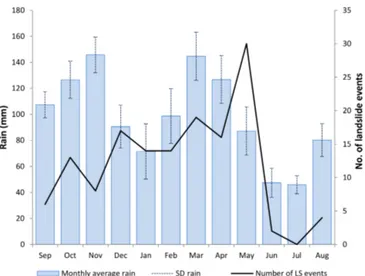
spa-tial distribution is limited in the longitude axis (Fig. 1) be-cause of data collection constraints related to the remote and unstable security conditions (Monsieurs et al., 2017). The landslide temporal pattern shows that most of them occurred after the second rainy season from March to May, with al-most no landslides being reported in the following dry sea-son (June–August) (Fig. 2). Daily rainfall distributions per month are provided in the Supplement.
A distinction is made for landslides mapped in mining ar-eas, counting 29 out of the 174 events. As media reports gen-erally lack scientific background and insights into the land-slide process, we discard these events because of the possibil-ity of anthropogenic interference in their occurrence. We also acknowledge that the rest of the inventory may encompass a wide range of landslide processes, from shallow to deep-seated landsliding (Monsieurs et al., 2018a), and that another important bias in the WEAR data set highlighted by field observations is the non-recording of many landslide events (Monsieurs et al., 2017, 2018a). Therefore we claim neither catalogue completeness nor ascertained identification of the conditions determinant for landsliding.
Figure 2. Monthly distribution of 174 landslide events (LS) in the WEAR and mean monthly rainfall based on 20 years (1998–2018) of TMPA (3B42 RT) daily data, downloaded from http://giovanni. sci.gsfc.nasa.gov (last access: 14 April 2019).
2.2 Rainfall data
Owing to the absence of a dense rain gauge network in the WEAR over the study period (Monsieurs et al., 2018b), we use SRE from the TRMM Multisatellite Precipitation Anal-ysis 3B42 Real-Time product, version 7 (hereafter spelled TMPA-RT). While the TRMM satellite is no longer oper-ating, the multisatellite TMPA product has continued to be produced by combining both passive microwave and infrared sensor data (Huffman et al., 2007). TMPA-RT is available at a spatio-temporal resolution of 0.25◦×0.25◦ and 3 h for the period from 2000 to present, over 50◦N–50◦S, provided by NASA with 8 h latency. Compared to the TMPA Re-search Version product, TMPA-RT shows lower absolute er-rors and was found to overall perform better in the WEAR for higher rainfall intensities (Monsieurs et al., 2018b). Yet, average rainfall underestimations of the order of ∼ 40 % and a low probability of detecting high rainfall intensities as such have to be taken into account. We maintain TMPA-RT’s na-tive spatial resolution, while aggregating the 3-hourly data to daily resolution, in accordance with the landslide inven-tory temporal resolution. Based on 18 years (2000–2018) of TMPA-RT data, Fig. 1 shows the spatial pattern of mean annual precipitation in the study area, which results from a complex system of climate drivers in equatorial Africa (Dez-fuli, 2017).
2.3 Susceptibility data
As we want to introduce ground factors directly within the frequentist estimation of rainfall thresholds, we make use of susceptibility data as a proxy for the joint effect of ground characteristics on spatial variations in thresholds. We adopt here the landslide susceptibility model from Broeckx et
al. (2018). Calibrated for all landslides regardless of type and covering the African continent at a spatial resolution of 0.0033◦, this model has been produced through logistic
re-gression based on three environmental factors, namely to-pography, lithology and peak ground acceleration. Suscep-tibility is expressed as the spatial probability of landslide occurrence in each pixel. As the values of these probabil-ity estimates scale with the ratio between the numbers of landslide (L) and no-landslide (NL) pixels used in the model calibration (King and Zeng, 2001), we stress that Broeckx et al. (2018) applied a ∼ 4 : 1 L / NL ratio. Interestingly, as their susceptibility map covers the whole of Africa, this model characteristic will not contribute to mar potential ex-trapolations of our calculated thresholds to similar analyses elsewhere in the continent. Finally, when resampling the sus-ceptibility data to the coarser 0.25◦ resolution of the SRE used in the threshold analyses, we assigned to each TMPA pixel a value corresponding to the 95th percentile of the original values in order to reflect the behaviour of the most landslide-prone sub-areas within the pixel.
3 A novel approach of the frequentist method 3.1 Conceptual framework
In order to overcome the limitations of the current frequen-tist approach of rainfall thresholds related to, for example, the variable definition of triggering rainfall events and non-consideration of ground conditions, we feel that the gener-ally used rainfall characteristics (intensity-duration or cumu-lative rainfall event-duration) should be lumped into a single metric, thus allowing space for introducing other parameters in the frequentist analysis. This has also been suggested by Bogaard and Greco (2018), who advocate a combination of meteorological and hydrological conditions into a “trigger– cause” framework of threshold definition where short-term rainfall intensity would represent the meteorological trigger. The main limitation thereof is however the limited avail-ability of information about the other variable, namely the causative hydrological status of slopes. Here, we propose an alternative concept where an AR function describes the pro-gressive build-up of the landslide trigger, and the set of de-termining causes, mostly related to ground conditions, is ac-counted for by landslide susceptibility. Said otherwise, we substitute for the trigger–cause framework proposed by Bo-gaard and Greco (2018) the coupling of a dynamic meteo-rologically based variable (trigger) and a static indicator of the spatially varying predisposing ground conditions (cause). In this way, we obtain rainfall (AR) thresholds as functions of susceptibility, which enables us to associate threshold mapping with susceptibility maps. We show below how this new approach furthermore includes the definition of a more meaningful AR function and the use of subsets of the land-slide data set in the threshold function estimation. Analyses
are performed in the R open-source software, release 3.4.3 (http://www.r-project.org, last access: 14 April 2019). The source code is provided in the Supplement.
3.2 A new antecedent rainfall function
Though various expressions of the AR function have been proposed (see an overview in Capparelli and Versace, 2011), most authors calculate AR for any day i by convolving the time series of daily (or any other length) rainfall rk with
a filter function in the form of an exponential function of time t , over a period empirically fixed to the preceding n d (e.g. Langbein et al., 1990; Crozier, 1999; Glade et al., 2000; Melillo et al., 2018): ARi= i−n X k=i e−a·(ti−tk)·r k. (1)
Such a function, which attempts to reflect the time-decaying effect of past rainfall on the soil water status, has two weak-nesses. The first one is that, a being a constant, AR does not vary the time constant for decay with daily rainfall amount. Yet, one may expect that, even though higher percentages are drained for larger rainfall (Dunne and Dietrich, 1980), the quantity of water infiltrating deeper and remaining in the soil from a large rainfall will most frequently be higher than that from a small rainfall. Observation that interception by the canopy, transpiration and evaporation rapidly increase with diminishing rainfall intensity, especially in equatorial areas, also supports this assumption (Schellekens et al., 2000). We take this into account by also introducing daily rainfall rkin
the filter function and expressing AR as
ARi= i−n X k=i e −a·(ti −tk) rbk ·r k, (2)
where the dimension of a is T−(1+b)Lb, with T here ex-pressed in days and L in millimetres. The b power of rk in
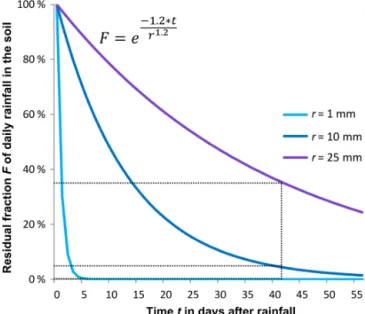
the exponential function allows us to tune the gradient of de-cay time with daily rainfall. We empirically determined that a =1.2 and b = 1.2 provide decay curves that realistically contrast the decay rate of different rainfall in the soil and comply with the duration of their effect on soil moisture ex-pected in the WEAR (e.g. McGuire et al., 2002) (Fig. 3).
As for the second weakness of the usual AR formulation, related to the length of the period of time to be used for AR calculation, we stick so far to the simplest solution of relying on expert knowledge to select it depending on the re-gional environmental conditions. Two observations from the landslide temporal distribution are taken into account for the choice of an appropriate accumulation period: (1) landslide frequency progressively increases during the long rainy sea-son (hardly interrupted by a short drier period centred on Jan-uary) and peaks at its end in May, suggesting that the length of the preceding period of wet conditions indeed controls
Figure 3. Decay curves for three daily rainfalls of 1, 10 and 25 mm according to the expression of the exponential filter function in Eq. (2), with a = 1.2 and b = 1.2. The black dotted lines show that 0 %, 4.2 % and 34.7 % of the respective original rainfall values are still contributing to the accumulated antecedent rainfall function (Eq. 2) after 42 d (6 weeks).
landslide frequency, and (2) the abruptly decreasing number of landslides as soon as the dry season starts in June indicates that the period of useful AR should not exceed a few weeks (Fig. 2). As a trade-off, we choose to calculate AR over a pe-riod of 6 weeks, or 42 d. Using such a fairly long pepe-riod is also required because all landslide types are included in the data set, including large-scale and deep rotational slope fail-ures that often occur only after a long rainy period (Zêzere et al., 2005; Fuhrmann et al., 2008; Robbins, 2016). A 6-week period is also consistent with studies having estimated the soil water mean residence time to about 2 months for two watersheds in the mid-Appalachians of central Pennsylvania, USA (McGuire et al., 2002), and they showed that the best fit between creep rate on the Parkfield segment of the San Andreas Fault (California, USA) and rainfall is obtained for a time constant of about 1 month (Roeloffs, 2001), the latter being however probably affected by specific conditions of in-filtration in the damage zone of the fault. Finally, we note in passing that another advantage of basing AR on a long pe-riod of time is that the effect of rainfall events missed by the satellite TMPA-RT data due to time gaps between satellite microwave observations (Monsieurs et al., 2018b) is reduced. 3.3 Definition of AR thresholds for landslides
Owing to the variables we employ to construct the frequentist graph, the rainfall thresholds will be given as AR values in function of susceptibility, or landslide-predisposing ground factors. Hereby we avoid regionalizing the input data
accord-Figure 4. Log–log plot of antecedent rain (mm) vs. ground susceptibility to landsliding for the recorded landslides, with their associated sampling probability: 0.67 at the reported landslide date; 0.17 at the days prior to and after the reported landslide date. The black curve is the regression curve obtained from the whole data set; the green and red curves are the AR thresholds at 5 % and 10 % exceedance probability levels respectively, along with their uncertainties shown as shaded areas.
ing to individual variables such as lithology, land cover, or topography and getting into problems of data subsetting in regions with limited data (Peruccacci et al., 2012). However, the use of these variables brings us to change the statisti-cal way of threshold statisti-calculation, which leads to conceptual improvements in the threshold definition and might also be fruitfully applied to threshold estimation based on rainfall intensity-duration or event-duration data.
The first steps of the analysis follow the procedure devised by Brunetti et al. (2010) and Peruccacci et al. (2012). We first plot the landslide data points in the 2-D AR suscepti-bility (S) space (Fig. 4). Only the 145 landslides unrelated to mining conditions are considered, from which two landslides associated with AR < 5 mm are further discarded, as they can barely be said to have been triggered by rainfall in such con-ditions. While such low AR values cannot be ascribed to er-rors in the TMPA-RT rainfall estimates, due to the length of the period of AR calculation, they might result from gross errors of landslide location or date identification, or possi-bly the intrinsic evolution of hillslopes with time-dependent strength degradation of the slope material resulting in slope failures without apparent trigger (Dille et al., 2019). The re-tained 143 landslides occurred between 2001 and 2018 and are located in 58 different TMPA and susceptibility pixels.
The threshold function is then approached through a power-law regression of AR against S (equivalent to a lin-ear regression in the log–log space) in the form
AR = (α ± 1α) · S(β±1β), (3)
which appeared to work best.
The uncertainties 1α and 1β associated with the α and β scaling parameters are obtained using a bootstrap statis-tical technique (Efron, 1979) where we generate 5000 se-ries of randomly selected events (with replacement) from the data set. The parameter values and their uncertainties corre-spond to the mean and the standard deviation, respectively, of their 5000 estimates. Peruccacci et al. (2012) applied this technique in order to get the fit uncertainty on the estimated parameters α and β. Here, we first produce a derived data set that must allow the merge of the fit uncertainties with those upon the data themselves into the error estimates pro-vided by the bootstrap process. Data uncertainties relate to the accuracy of landslide location and date identification. As the mean location accuracy of 6.7 km is much better than the ∼ 28 km pixel size, we decided to neglect this type of uncertainty. However, the dating uncertainty is more of an issue. Uncertainty on the date most frequently arises from landslides having occurred during the night. Beyond the fact that reports do not always mention it, it is also generally
un-sure whether any nightly landslide has been assigned to the day before or after the night. In terms of uncertainty, this im-plies that a reported landslide may have occurred randomly at any time over a 36 h period centred on the reported day. To account for this randomness, we associate each landslide with three weighted dates, the reported day having a weight of 24/36 (∼ 0.67) and the previous and next days each a weight of 6/36 (∼ 0.17) corresponding to the first half of the preceding night and the second half of the following night, respectively. We then simply expand, according to the day weights, the original 143-event data set to a set of 858 de-rived events of the same 0.17 probability (in which, for each landslide, day 0 is represented four times whereas only one occurrence of days −1 and +1 is present). The date uncer-tainty is therefore incorporated in the expanded data set and thus will also be included in the 1α and 1β uncertainty es-timates from the bootstrapping, with each bootstrap iteration randomly sampling 858 independent events out of this data set, for a probability sum of (∼ 0.17) · 858 = 143. Note that a close but less practical alternative might have consisted in using the intermediate data set of 429 (= 3 · 143) weighted events and requiring every bootstrap iteration to randomly sample a variable number of events for a total sum of weights of 143. In order to satisfy the requirement of the frequentist method for the largest possible data set, we used the entire set of landslide events for the calibration of the new method, leaving aside a validation of our results based on updates of the WEAR data set or on landslide sets of neighbouring re-gions for the near future.
In each iteration of the bootstrap procedure, once the best fit parameters of Eq. (3) have been obtained by least-square approximation, the residuals of the regression are calculated and subsets of their largest negative values are selected ac-cording to the exceedance probabilities of the thresholds we want to calculate. Brunetti et al. (2010) use for this a Gaus-sian fit to the probability density function of the population of residuals and take the residual value δ that limits the low-est x % of this fit to define the x % exceedance probability threshold as a line parallel to the global regression line (in the log(AR) − log(S) space), i.e. with an unchanged β parame-ter, and simply translated toward lower α by a distance δ (see their Fig. 2). Here, we prefer to put more weight on the dis-tribution of the data points in the lower part of the cloud of points as the most meaningful part of the data set for thresh-old identification. Once the residuals have been computed, we take the subset of their x % largest negative values and regress AR against S only for the corresponding data points, obtaining a new regression line with not only a lower α but also a modified β parameter that better follows the lower limit of the cloud of points. Running through the middle of the x % lowest data points, this new curve is thus taken as the threshold curve for the (x/2) % exceedance probability. In this way, the whole data set is used to calculate the trend that allows meaningful sampling of subsets of low-AR points before the emphasis is put on the subsets to obtain curves
better reflecting the actual threshold information contained in the data set. Note also that we select a subset of actual data points to estimate the threshold, whereas the approach of Brunetti et al. (2010) relies on a Gaussian approximation of the residual distribution.
4 AR threshold estimates
The range of AR values associated with the landslide events extends from 5.7 to 164.4 mm for landslides that occurred in areas displaying a range of susceptibility (expressed as prob-abilities) from 0.38 to 0.97. As a first result, the fit to the (AR, S) pairs of the whole set of landslide events was ex-pressed as (Fig. 4)
AR = (36.5 ± 1.2) · S(−0.41±0.09), (4) showing a stable solution of the bootstrap with fairly small (date + fit) uncertainties on α and β but a rather small βvalue indicating a weak dependence of AR on S, confirmed by the very low determination coefficient R2=0.02 even though the fitted trend is significant (df = 856, r = 0.14 > rcrit(95 %) = 0.08). We then selected two subsets of 10 %
and 20 % of all data points with the most negative residu-als with respect to the above-calculated trend in order to ob-tain the threshold curves for the 5 % and 10 % probabilities of exceedance, respectively, on which power-law regressions yielded (Fig. 4)
AR(5 %) = (9.2 ± 0.6) · S(−0.95±0.14), (5) AR(10 %) = (13.1 ± 0.7) · S(−0.66±0.15). (6) A 5 % exceedance probability, for instance, means that any landslide occurring in the field has a 0.05 probability of be-ing triggered by an antecedent rainfall AR lower than that defined by the threshold curve, with about weighted 5 % of the data points effectively lying below the curve. A first observation is that the two threshold curves present signif-icantly higher β values than the previously calculated gen-eral trend, thus enhancing the susceptibility-dependent gra-dient of AR threshold. The maximum β value is obtained for the lowest threshold, which targets most sharply the data points of interest, while larger subsets yield values progres-sively closer to that of the general trend and thus less mean-ingful. Again, the bootstrap-derived uncertainties are rather low, even though the β uncertainties appear slightly higher than previously, owing to smaller sample size and narrower range of represented S values. At the 5 % exceedance prob-ability, the AR threshold amounts to 22 and 9.2 mm for sus-ceptibilities of 0.4 and 1, respectively, making an AR dif-ference of ∼ 13 mm between weakly and highly susceptible ground conditions. At the same time, the goodness of fit of the regressions on the subsets of data significantly increases, with an average R2=0.27 (r = 0.52 > rcrit(95 %) = 0.18)
for the 10 % curve and with quasi all single bootstrap it-erations providing significant α and β parameters for both thresholds, showing that there exists a true correlation be-tween susceptibility and rainfall threshold as soon as one fo-cuses on the data points really pointing to the minimum AR required for landsliding to start. Though fairly small, these R2values have proved best among not very different linear, exponential and power-law fits. Better coefficients are prob-ably hampered mainly by inhomogeneities in the subset data distribution within the susceptibility range, with very poor information for S < 0.7 (Fig. 4). This is also why the thresh-old curves of Fig. 4 have not been extrapolated over the entire possible range of susceptibility because the relation between susceptibility lower than 0.38 and triggering AR conditions is uncertain as long as it cannot be empirically tested. At the continental scale, pixels with a susceptibility ≤ 0.38 are ranked in any case as low- and very low-susceptibility ar-eas (Broeckx, oral communication). In the WEAR, the only landslides that were recorded in areas with S < 0.38 are all related to mining activity.
5 Discussion
Having proposed a new approach of the frequentist method of rainfall threshold determination for landsliding, we have applied it with encouraging results in the WEAR despite the difficulties of the context (limited size of the landslide set, heterogeneity of the study area with respect to ground con-ditions, coarse spatial resolution of the rainfall data, coarse temporal resolution of the landslide inventory). We want now to review every new element of the method and have a look at their advantages, implications and limitations, especially from the point of view of the added value for the landslide scientific community.
1. A key point of our approach is the introduction of ground characteristics as one variable of the 2-D fre-quentist graph, with the aim of directly associating the climatic trigger of landslides and the determining (static) ground conditions in the threshold analysis. In-deed, in the current way of treating this problem, sep-arately examining the effect on thresholds of various ground variables (e.g. lithology, topography) has the drawbacks that (1) partitioning the study area on the ba-sis of categories of any variable may entail that some subsets of data become too small for a significant anal-ysis (Peruccacci et al., 2012) and (2) the combined ef-fect of the variables cannot be investigated. In order to put everything at once in the frequentist graph, we thus needed to use two variables synthesizing the cli-matic and ground characteristics. While the clicli-matic trigger issue was fixed by proposing a refined AR func-tion (see point 2 below), we found that susceptibility to landsliding is an ideal single indicator integrating all ground characteristics that significantly determine
the hillslope sensitivity to rainfall accumulation. Con-versely, we could cite the fact that no single raw vari-able is explicitly stated in this approach, and especially the soil water status of slopes. But the main point is that using susceptibility values from pre-existing studies im-plies knowing how they were estimated. This is not a real issue for a regional study but becomes relevant if thresholds obtained somewhere were to be compared with those of other regions where the susceptibility data would have been calculated in a different way. In the fre-quent case that susceptibility is modelled through logis-tic regression for example, the probabilities that quan-tify susceptibility have no absolute meaning, depend-ing on the ratio between the landslide and no-landslide sample sizes used in the modelling. Such information should thus always be specified when susceptibility data are exploited for threshold determination.
2. AR functions are a common tool to lump daily rainfall and antecedent rainfall into a single measure. In gen-eral, they either simply use cumulated rainfall over em-pirically determined significant periods or take into ac-count the decaying effect of rainfall on the soil water status. With respect to the intensity-duration or cumu-lated rainfall event-duration descriptions of rain charac-teristics, they replace the difficulty of objectively defin-ing rainfall events by that of choosdefin-ing a relevant period of meaningful antecedent rainfall and, if a filter func-tion is used, of parameterizing it. The latter also offers a better proxy for the time-varying soil moisture content (Hong et al., 2018; Melillo et al., 2018). However, no AR function has so far considered a non-linear depen-dence of the decay time constant on daily rainfall and, thus, soil wetting. Here, we have applied this idea by introducing daily rainfall in the filter function of AR as a scaling factor of the time constant (Eq. 2). In addition to the usual virtue of this AR function type of assigning full weight to the rainfall of the current day, this allows a better contrast between the intensity-dependent lasting effect of different past rainfall, with more weight put on high-intensity rainfall.
Another facet of the AR issue is that we used remotely sensed rainfall data from the TMPA-RT products (e.g. Hong et al., 2006; Robbins, 2016). In the WEAR case, this was required anyway because the existing rain gauge network in the area is neither dense nor installed soon enough to adequately cover the study area and pe-riod. Moreover, using TMPA-RT data is advantageous in that the information is spatially continuous (Rossi et al., 2017; Postance et al., 2018) and freely available with a global coverage in near-real time (Hong et al., 2006; Kirschbaum and Stanley, 2018). The rather coarse spa-tial resolution of TMPA-RT data may also turn into an advantage because of their higher spatial representative-ness compared to gauge point observations of very local
meaning in areas with pronounced topography (Marra et al., 2017; Monsieurs et al., 2018b). However, one has to cope with the typical bias of SRE, which systemat-ically underestimates rainfall amounts with respect to ground observations (Brunetti et al., 2018; Monsieurs et al., 2018b). As stated by Brunetti et al. (2018), this does not affect the performance of threshold determination as long as the bias is spatially and temporally homoge-neous, which is to some extent the case in the WEAR. Based on the estimation by Monsieurs et al. (2018b) that average SRE underestimation amounts to ∼ 40 % in this area, we calculate an approximate first-order cor-rection of the AR thresholds. For instance the calcu-lated ∼ 13 mm difference in 5 % AR threshold between low- and very high-susceptibility areas of the WEAR becomes ∼ 21 mm after correction for SRE underesti-mation, with corrected 5 % AR thresholds of 36.6 and 15.3 mm in areas with S = 0.4 and 1, respectively. How-ever, Monsieurs et al. (2018b) also highlight how SRE underestimation increases with rainfall intensity, reach-ing an average 80 % for daily rainfall around 30 mm. This means that, even after correction, the thresholds, in which high daily rainfall have the highest weight, are still underestimated, and thus only indicative.
3. Another characteristic of our approach lies in the fash-ion of determining thresholds by focusing on the data points with the lowest AR. Though this is not quite new (Althuwaynee et al., 2015; Lainas et al., 2016; Segoni et al., 2018), it is carried out here in a statisti-cally rigorous manner so as to exploit the part of the data most meaningful for threshold appreciation. This methodological change was needed initially because, contrary to the obvious strong relation between rain-fall intensity or event rainrain-fall and duration (Guzzetti et al., 2007), the intuitively expected relation between ground susceptibility and rainfall threshold was hardly expressed in the data, with a bare 2 % of the variance of landslide-triggering AR explained by susceptibility. Many reasons potentially contribute to the noise that ob-scures such a relation among the (AR, S) landslide data, relating to (i) probably chiefly the mixing of all types of landslides in our data set (Flageollet et al., 1999; Si-dle and Bogaard, 2016; Monsieurs et al., 2018a); (ii) the spatial, temporal and rain-intensity-dependent inhomo-geneity of TMPA-RT underestimation, with local bias caused, for example, by high percentages of water ar-eas within a pixel or by topographic rainfall (Monsieurs et al., 2018b); (iii) determining factors of landsliding important in the WEAR region but not accounted for in the continental-scale prediction of susceptibility by Broeckx et al. (2018), such as slope aspect, thickness of the weathering mantle, deforestation and other human-related factors; (iv) the occurrence of landslides in less susceptible areas of a pixel classified as highly
suscep-tible; (v) the probability of landslides having occurred in the very first hours of a day with 24 h long high rain-fall, inducing artificially swollen pre-landslide AR. By contrast, focusing on subsets of landslides with low-AR residuals leads to a better data fit and thresholds with higher β values more closely reflecting the vi-sually outstanding lower bound of the cloud of data points and the AR threshold dependence on suscepti-bility. Working with independent regressions on subsets strongly reduces the data noise and thus better captures the true threshold shape. In this scheme, many of the actual landslide events associated with AR much higher than the calculated threshold might be viewed as “quasi false positives” that, for any reason, required much more rainfall than predicted before at last occurring.
4. Another issue of this new method (and of most stud-ies based on the frequentist approach) is that it explic-itly deals only with “false negatives” (hereafter FNs, i.e. landslides having occurred for AR values below the de-fined threshold) and thus evaluates only the type II error. However, using thresholds that minimize this error, the amplitude of the type I error (“false positives” – FPs, i.e. AR values above the threshold that nevertheless did not lead to landsliding) is proportionately increased. For example, for a randomly chosen pixel of the study area, which underwent six landslide events during the 2000– 2018 period, the 5 % and 10 % thresholds involve no FN but cause 4715 (70 % of the AR time series of the pixel) and 4242 (63 %) FPs, respectively. There are however several reasons why these high numbers of FPs are nei-ther reliable nor really problematic. Firstly, it is impor-tant to note that the landslide data set used for thresh-old calculation is far from complete and that a lot of landslides occurring in remote areas are de facto unre-ported and may even go easily unnoticed on satellite imagery if they occurred in regions with fast vegeta-tion regrowth or land reclamavegeta-tion or in places with poor temporal satellite coverage. Most of these unreported events, if associated with above-threshold AR values, imply many “false false positives”, i.e. ignored true pos-itives. Moreover, once one or several consecutive high daily rainfalls have occurred and AR has jumped to val-ues largely above the threshold, causing one landslide event, the subsequent construction-dependent slow re-turn of the index to below-threshold values frequently lasts for days or weeks without further landsliding. Said otherwise, the tail of a period of above-threshold AR (after a landslide event) is generally much longer than its head (before the event) and one can barely call false positives all these days with high AR that follow the event. The true rate of FPs is therefore much lower than it may seem at first glance. Furthermore, even the large number of remaining FPs should not necessarily be deemed an issue because it actually constitutes the
essence of early warning. By definition, flagging a day as hazardous does not mean that a landslide will occur on that day but only that there is an increased probabil-ity of an event and people should be prepared to face it. Even more, when a landslide prediction turns into a true positive, with a few landslides occurring in the pixel, most people living in this ∼ 28 × 28 km area may nonetheless consider it a false positive because the land-slides have affected only a tiny part of the total pixel area. Finally, it is also worth noting that, in contrast to most other methods, this susceptibility-based approach allows the distribution of the warnings (and possible false alarms) temporally and spatially, thus reducing the number of warnings in any individual pixel.
5. A main requirement for a widely usable method of threshold calculation is an automated threshold pro-cedure, ideally made available online, in order to en-hance reproducibility of analysis and promote world-wide comparison of results (Segoni et al., 2018). Steps towards this goal are achieved through the following.
a. Using TMPA-RT data, a freely available, spatially homogeneous product covering the 50◦N–S lati-tude range. This ensures that the results of other re-gional analyses using the same data may be safely compared with ours. The RT (Real-Time Version of the product has intentionally been preferred to the more elaborated Research Version calibrated against gauge-based Global Precipitation Climatol-ogy Centre rainfall data (Huffman et al., 2007) be-cause the inhomogeneous distribution of the refer-ence gauges worldwide, and especially in the trop-ics, introduces a spatially variable bias into the residual underestimation of the latter data (Mon-sieurs et al., 2018b).
b. Reduction of the number of adjustable parameters in the definition of the climatic characteristics lead-ing to landslidlead-ing. Here, only the constant coeffi-cient and the exponent on daily rainfall in the filter function have to be fixed, along with the length of the period over which AR is calculated. A dedicated statistical study of their best values (e.g. Stewart and McDonnell, 1991; McGuire et al., 2002) might perhaps somewhat improve those we empirically defined but, in any case, the AR time series calcu-lated from our empirical tests have shown that this formulation of AR is not much sensitive to moder-ate changes in the parameter values.
c. Drawing attention onto the effect on the calculated thresholds of the way the used susceptibility data have been obtained. In particular, it is possible to correct the threshold results for differences in the ratio between the landslide and no-landslide
sam-ple sizes used with the widely recognized logistic regression model of susceptibility.
d. Improving the evaluation of uncertainty. All sources of uncertainties (here, there are uncertain-ties in date and fit but location uncertainty may be treated as similar) are merged into a single error es-timation in a bootstrap procedure randomly taking from a weighted data set samples that have the same size in terms of the sum of the weights (or probabil-ities) of the selected events rather than in the num-ber of events.
e. Providing our source code in the Supplement. 6. In addition to method development, this study has
yielded new valuable regional information in the form of AR threshold-susceptibility relations and a threshold map at 0.25◦×0.25◦resolution (Fig. 5). These results
are immediately usable for early warning of landslide hazard in the WEAR. Depending on the local suscepti-bility, thresholds at 5 % exceedance probasuscepti-bility, which we consider the best operational measure, range from AR = ∼ 15.3 mm (corrected for SRE underestimation) in the highest-susceptibility areas to 38.4 mm in the least susceptible pixels (S = 0.38) that recorded land-slides during the 2001–2018 period. While this, as a matter of fact, is unquestionable, its geomorphic mean-ing is hard to discuss because a smean-ingle AR value may cover very different 6-week-long time series of daily rainfall, from more or less continuous moderate- to high-intensity rainfall over weeks causing deep rota-tional landslides to very high-intensity rainfall of short duration just before the occurrence of extended shal-low landsliding and debris fshal-low. We also observed that a significant percentage (∼ 40 %) of the landslide events did not occur on the day when then highest rainfall was recorded but 1 or 2 d later. As it seems unlikely that all of these landslides would have been wrongly dated, this fact might betray a particular hydrological behaviour of slopes or be related to specific landslide processes (Montgomery and William, 2002; Lollino et al., 2006). Meaningful hypotheses about the interplay between slope physics and rainfall characteristics in this setting will however require in-depth analysis of the 6-week rainfall time series associated with the landslide events. Meanwhile, although this is not straightforward, we can at least attempt a comparison with the results of the many studies based on intensity-duration (ID) or event-duration (ED) analysis of rain gauge data. Extrap-olating their ED or ID curves towards a duration of 42 d, many published 5% exceedance probability thresholds fall in the range of 75–150 mm over this time length in, for example, NW Italy (Melillo et al., 2018), NE Italy (Marra et al., 2017), central Italy (Perucacci et al., 2012; Rossi et al., 2017), Sicily (Gariano et al., 2015) and the NW USA (Seattle area, Chleborad et al., 2006).
Moreover, many landslides that actually occurred after rainfall events of shorter duration were associated with lower cumulated rainfall. The 75–150 mm range is thus an upper bound in these areas and we tentatively sug-gest an average 50–75 mm cumulated rainfall as repre-sentative for antecedent rainfall of landslide events. The reasons why these figures are still significantly, though not irreducibly, higher than those we obtained in the WEAR are as follows. On the one hand most of these studies (except that of Melillo et al., 2018) do not ap-ply a decay function to past rainfall. On the other hand, this might also be related to the poor approximation of SRE underestimation in the WEAR by Monsieurs et al. (2018b) due to the non-linear dependence of un-derestimation on rainfall intensity and the weak repre-sentativeness of limited gauge data of very local sig-nificance with respect to ∼ 28 km × 28 km pixels. An-other reason might be related to the specific conditions of this tropical climate that could influence the weather-ing conditions of the hillslope material and increase the sensitivity to failure; this however remains hypothetical at this stage and calls for further analysis (beyond the scope of this research). Interestingly, in a tropical re-gion similar to the WEAR, namely Papua New Guinea, Robbins (2016) used cumulative rainfall to calculate thresholds based on TMPA data and selected event dura-tions. For an antecedent time length of 40 d, she derived thresholds amounting to ∼ 25 and ∼ 175 mm for short-and long-duration lshort-andslide events, respectively. Tak-ing into account that no decay function was involved in her antecedent rainfall calculation, these values are fully consistent with our data, where short-duration events of shallow landsliding probably prevail in determining the 5 % threshold of ∼ 9–22 mm (uncorrected for SRE underestimation) in the WEAR whereas long-duration events triggering larger and deeper landslides would make the bulk of noisy high-AR (∼ 40–120 mm) data points. Likewise, 5 % thresholds estimated in central Italy by Rossi et al. (2017) based on SRE data are of the order of 30 mm of cumulative rainfall over an extrapo-lated duration of 42 d, again fairly similar to our uncor-rected ∼ 9–22 mm 5 % thresholds if we take account of the absence of decay function in their calculations. We also note that our AR values are in the range of observed values compiled by Bogaard and Greco (2018), while Guzzetti et al. (2007) even reported extreme values as low as < 10 mm. However, Bogaard and Greco (2018) point to the difficulty of interpreting long-duration rain-fall measures in terms of average rainrain-fall intensity and their trigger role for shallow landslides and debris flows. To this extent, another added value of our approach lies in the complex decay filter function used in AR, which mixes triggering recent rain and predisposing rain of the past weeks in such a way that the index is meaningful for both shallow and deep-seated landslides.
Although our results offer first insights into rainfall thresholds in the WEAR, they still need refinement be-fore becoming transposable into an operational early warning system. Significant improvement is expected in the near future from more regionally focused suscep-tibility maps and higher-resolution SREs coming soon with the IMERG product, which shows better perfor-mance for rainfall detection (Gebregiorgis et al., 2018; Xu et al., 2017). Together, higher-resolution, better-quality rainfall and susceptibility data should produce a more robust correlation between both variables for land-slide events and, as a corollary, predictions should in-volve fewer false positives. In parallel, the number of false positives will have to be further reduced through appropriate filtering of above-threshold AR data fol-lowing landslide events. A larger database of correctly described and dated landslide events will also allow threshold validation and, once sufficiently large subsets of data are available for particular landslide types, the calculation of adapted thresholds.
6 Conclusion
In this study, we propose a new rainfall threshold approach fundamentally different from previous research and based on the relation between antecedent rainfall and landslide suscep-tibility through a modified frequentist approach with boot-strapping. This method has the main advantage of directly mappable susceptibility-dependent rainfall thresholds. The 6-week-long antecedent rainfall is calculated based on satel-lite rainfall estimates from TMPA 3B42 RT. It uses an expo-nential filter function with a time constant scaled by a power of daily rainfall accounting for the dependence on rainfall intensity of the decaying effect of rain water in the soil. Sus-ceptibility data come from a study by Broeckx et al. (2018) based on logistic regression and a continental-scale data set of landslides in Africa. Using this method, we identify the first rainfall thresholds for landsliding in the western branch of the East African Rift, based on a landslide inventory of 143 landslide events over the 2001–2018 period. The ob-tained AR thresholds are physically meaningful and range, without correction for SRE underestimation, from 9.5 mm for the most susceptible areas of the WEAR (S = 0.97) to 23.1 mm in the least susceptible areas (S = 0.38) where land-slides have been reported, for an exceedance probability of 5 %. We conclude that the proposed new threshold approach forms an added value to the landslide scientific community, while future improvements are expected from applying the method to larger data sets and using satellite rainfall esti-mates with higher spatial (and temporal) resolution and in-creased rain detection efficiency.
Figure 5. Antecedent rainfall (AR) threshold map (0.25◦ res-olution) at 5 % exceedance probability (see Eq. 5). Depending on the local landslide susceptibility (from Broeckx et al., 2018, Fig. 1) threshold values range from AR = 9.5 mm in the highest-susceptibility areas (S = 0.97) to AR = 23.1 mm in the least suscep-tible pixels (S = 0.38), having recorded landslides during the 2001– 2018 period. Numbers in the lakes are as follows. 1: Lake Albert; 2: Lake Edward; 3: Lake Kivu; 4: Lake Tanganyika. Background hillshade SRTM (90 m).
Data availability. Data sets can be accessed at https://disc-beta. gsfc.nasa.gov/ (Huffman, 2016).
Supplement. The supplement related to this article is available online at: https://doi.org/10.5194/nhess-19-775-2019-supplement.
Author contributions. AD conceived the new aspects of the method, with input from EM and OD to its development. EM col-lected the data, implemented the source code and made all calcula-tions. AD, EM and OD contributed to the discussion of the results. EM and AD jointly wrote the paper, with contribution from OD. OD coordinated and designed this collaborative study in the frame of the RESIST project.
Competing interests. The authors declare that they have no conflict of interest.
Acknowledgements. We thank the Investigative Reporting Project Italy research institute and their code developers for publically sharing open-source codes for landslide hazard studies. Special thanks go to our partners at Centre de Recherche en Sciences Na-turelles de Lwiro (DR Congo) and Université Officielle de Bukavu (DR Congo), who facilitated fieldwork in the study area and pro-vided information on landsliding. We are grateful for the fruitful discussions with Thom Bogaard with regard to the antecedent rain-fall equation and constraints in threshold calibration. The authors acknowledge the NASA Goddard Earth Sciences Data and Infor-mation Services Center for providing full access to the precipita-tion data sets exploited in this study. We also thank Jente Broeckx, who provided the landslide susceptibility model for Africa. Fi-nancial support came from BELSPO for the RESIST (SR/00/305) and AfReSlide (BR/121/A2/AfReSlide) research projects (http:// resist.africamuseum.be/, last access: 14 April 2019; http://afreslide. africamuseum.be/, last access: 14 April 2019), and an F.R.S. – FNRS PhD scholarship for Elise Monsieurs.
Review statement. This paper was edited by Mario Parise and re-viewed by two anonymous referees.
References
Aleotti, P.: A warning system for rainfall-induced shallow failures, Eng. Geol., 73, 247–265, https://doi.org/10.1016/j.enggeo.2004.01.007, 2004.
Althuwaynee, O., Pradhan, B., and Ahmad, N.: Estimation of rain-fall threshold and its use in landslide hazard mapping of Kuala Lumpur metropolitan and surrounding areas, Landslides, 12, 861–875, https://doi.org/10.1007/s10346-014-0512-y, 2015. Aristizábal, E., García, E., and Martínez, C.: Susceptibility
as-sessment of shallow landslides triggered by rainfall in tropical basins and mountainous terrains, Nat. Hazards, 78, 621–634, https://doi.org/10.1007/s11069-015-1736-4, 2015.
Berti, M., Martina, M.L.V., Franceschini, S., Pignone, S., Simoni, A., and Pizziolo, M.: Probabilistic rainfall thresholds for land-slide occurrence using a Bayesian approach, J. Geophys. Res.-Earth, 117, 1–20, https://doi.org/10.1029/2012JF002367, 2012. Bogaard, T. and Greco, R.: Invited perspectives: Hydrological
perspectives on precipitation intensity-duration thresholds for landslide initiation: Proposing hydro-meteorological thresholds, Nat. Hazards Earth Syst. Sci., 18, 31–39, https://doi.org/10.5194/nhess-18-31-2018, 2018.
Broeckx, J., Vanmaercke, M., Duchateau, R., and Poesen, J.: A data-based landslide susceptibility map of Africa, Earth-Sci. Rev., 185, 102–121, https://doi.org/10.1016/j.earscirev.2018.05.002, 2018.
Brunetti, M. T., Peruccacci, S., Rossi, M., Luciani, S., Valigi, D., and Guzzetti, F.: Rainfall thresholds for the possible occurrence of landslides in Italy, Nat. Hazards Earth Syst. Sci., 10, 447–458, https://doi.org/10.5194/nhess-10-447-2010, 2010.
Brunetti, M.T., Melillo, M., Peruccacci, S., Ciabatta, L., and Brocca, L.: How far are we from the use of satellite rainfall products in landslide forecasting?, Remote Sens. Environ., 210, 65–75, https://doi.org/10.1016/j.rse.2018.03.016, 2018.
Capparelli, G. and Versace, P.: FLaIR and SUSHI: Two mathemat-ical models for early warning of landslides induced by rainfall, Landslides, 8, 67–79, https://doi.org/10.1007/s10346-010-0228-6, 2011.
Chleborad, A., Baum, R., and Godt, J.: Rainfall thresholds for fore-casting landslides in the Seattle, Washington, area – Exceedance and probability, US Geological Survey Open-File Report 2006, US Geological Survey, Reston, Virginia, USA, 1–31, 2006. Crosta, G. B.: Regionalization of rainfall thresholds-an aid to
landslide hazard evaluation, Environ. Geol., 35, 131–145, https://doi.org/10.1007/s002540050300, 1998.
Crosta, G. B. and Frattini, P.: Rainfall thresholds for triggering soil slips and debris flow, edited by: Mugnai, A., Guzzetti, F., and Roth, G., in: Proceedings of the 2nd EGS Plinius Conference on Mediterranean Storms, Siena, Italy, 463–487, 2001.
Crozier, M. J.: The climate-landslide couple: a southern hemisphere perspective, in: Rapid Mass Movement as a Source of Climatic Evidence for the Holocene, edited by: Matthews, J. A., Bruns-den, D., Frenzel, B., Gläser, B., and Weiß, M., Gustav Fischer, Stuttgart, 333–354, 1997.
Crozier, M. J.: Prediction of rainfall-triggered landslides: A test of the antecedent water status model, Earth Surf. Proc. Land., 24, 825–833, https://doi.org/10.1002/(SICI)1096-9837(199908)24:9<825::AID-ESP14>3.0.CO;2-M, 1999. Cullen, C. A., Al-Suhili, R., and Khanbilvardi, R.: Guidance index
for shallow landslide hazard analysis, Remote Sensing, 8, 1–17, https://doi.org/10.3390/rs8100866, 2016.
Delvaux, D., Mulumba, J.-L., Ntabwoba Stanislas Sebagenzi, M., Fiama Bondo, S., Kervyn, F., and Havenith, H.-B.: Seismic hazard assessment of the Kivu rift segment based on a new sismo- tectonic zonation model (Western Branch, East African Rift system), J. Afr. Earth Sci., 134, 831–855, https://doi.org/10.1016/j.jafrearsci.2016.10.004, 2017.
Dezfuli, A. K.: Climate of western and central equatorial Africa, in: Climate science, Oxford Research Encyclopedias, Oxford, https://doi.org/10.1093/acrefore/9780190228620.013.511, 2017. Dille, A., Kervyn, F., Mugaruka Bibentyo, T., Delvaux, D., Ganza Bamulezi, G., Ilombe Mawe, G., Moeyersons, J., Mon-sieurs, E., Smets, B., Kervyn, M., and Dewitte, O.: Question-ing causes and drivers of slope instability in a tropical context – insights from the Ikoma Landslide (DR Congo), Geophys. Res. Abstr., 21, EGU2019-7680-1, 2019.
Dunne, T. and Dietrich, W. E.: Experimental study of Horton over-land flow on tropical hillslopes, J. Geomorphol., 35, 40–59, 1980.
Efron, B.: Bootstrap methods: Another look at jackknife, Ann. Stat., 7, 1–26, 1979.
Flageollet, J. C., Maquaire, O., Martin, B., and Weber, D.: Land-slides and climatic conditions in the Bracelonnette and Vars basins (Southern French Alps, France), Geomorphology, 30, 65– 78, https://doi.org/10.1016/S0169-555X(99)00045-8, 1999. Fuhrmann, C., Konrad II, C., and Band, L.: Climatological
per-spectives on the rainfall characteristics associated with land-slides in western north California, Phys. Geogr., 29, 289–305, https://doi.org/10.2747/0272-3646.29.4.289, 2008.
Gariano, S. L. and Guzzetti, F.: Landslides in a changing climate, Earth-Sci. Rev., 162, 227–252, https://doi.org/10.1016/j.earscirev.2016.08.011, 2016.
Gariano, S. L., Brunetti, M. T., Iovine, G., Melillo, M., Peruc-cacci, S., Terranova, O., Vennari, C., and Guzzetti, F.: Calibration and validation of rainfall thresholds for shallow landslide fore-casting in Sicily, southern Italy, Geomorphology, 228, 653–665, https://doi.org/10.1016/j.geomorph.2014.10.019, 2015. Gebregiorgis, A. S., Kirstetter, P. E., Hong, Y. E.,
Gour-ley, J. J., Huffman, G. J., Petersen, W. A., Xue, X., and Schwaller, M.R .: To What Extent is the Day 1 GPM IMERG Satellite Precipitation Estimate Improved as Compared to TRMM TMPA-RT?, J. Geophys. Res.-Atmos., 123, 1694–1707, https://doi.org/10.1002/2017JD027606, 2018.
Glade, T., Crozier, M., and Smith, P.: Applying probability deter-mination to refine landslide-triggerin rainfall thresholds using an emporical “Antecedent Daily Rainfall Model”, Pure Appl. Geo-phys., 157, 1059–1079, https://doi.org/10.1007/s000240050017, 2000.
Guzzetti, F., Peruccacci, S., and Rossi, M.: Rainfall thresh-olds for the initiation of landslides in central and south-ern Europe, Meteorol. Atmos. Phys., 98, 239–267, https://doi.org/10.1007/s00703-007-0262-7, 2007.
Guzzetti, F., Peruccacci, S., Rossi, M., and Stark, C. P.: The rainfall intensity-duration control of shallow landslides and debris flows: An update, Landslides, 5, 3–17, https://doi.org/10.1007/s10346-007-0112-1, 2008.
Hong, M., Kim, J., and Jeong, S.: Rainfall intensity-duration thresholds for landslide prediction in South Korea by consider-ing the effects of antecedent rainfall, Landslides, 15, 523–534, https://doi.org/10.1007/s10346-017-0892-x, 2018.
Hong, Y., Adler, R., and Huffman, G.: Evaluation of the po-tential of NASA multi-satellite precipitation analysis in global landslide hazard assessment, Geophys. Res. Lett., 33, L22402, https://doi.org/10.1029/2006GL028010, 2006.
Huffman, G.: TRMM (TMPA-RT) Near Real-Time Precipi-tation L3 3 hour 0.25 degree × 0.25 degree V7, edited by: MacRitchie, K., Goddard Earth Sciences Data and In-formation Services Center (GES DISC), Greenbelt, MD, https://doi.org/10.5067/TRMM/TMPA/3H-E/7, 2016.
Huffman, G. J., Bolvin, D. T., Nelkin, E. J., Wolff, D. B., Adler, R. F., Gu, G., Hong, Y., Bowman, K. P., and Stocker, E. F.: The TRMM Multisatellite Precipitation Analy-sis (TMPA): Quasi-Global, Multiyear, Combined-Sensor Precip-itation Estimates at Fine Scales, J. Hydrometeorol., 8, 38–55, https://doi.org/10.1175/JHM560.1, 2007.
Jacobs, L., Dewitte, O., Poesen, J., Delvaux, D., Thiery, W., and Kervyn, M.: The Rwenzori Mountains, a landslide-prone re-gion?, Landslides, 13, 519–536, https://doi.org/10.1007/s10346-015-0582-5, 2016.
Jacobs, L., Dewitte, O., Poesen, J., Sekajugo, J., Nobile, A., Rossi, M., Thiery, W., and Kervyn, M.: Field-based landslide suscep-tibility assessment in a data-scarce environment: the populated areas of the Rwenzori Mountains, Nat. Hazards Earth Syst. Sci., 18, 105–124, https://doi.org/10.5194/nhess-18-105-2018, 2018. King, G. and Zeng, L.: Logistic regression in rare events data, Polit.
Anal., 9, 137–163, https://doi.org/10.1162/00208180152507597, 2001.
Kirschbaum, D. B. and Stanley, T.: Satellite-Based As-sessment of Rainfall-Triggered Landslide Hazard for Situational Awareness, Earth’s Future, 6, 505–523, https://doi.org/10.1002/2017EF000715, 2018.
Kirschbaum, D. B., Stanley, T., and Simmons, J.: A dynamic landslide hazard assessment system for Central America and Hispaniola, Nat. Hazards Earth Syst. Sci., 15, 2257–2272, https://doi.org/10.5194/nhess-15-2257-2015, 2015.
Lainas, S., Sabatakakis, N., and Koukis, G.: Rainfall thresh-olds for possible landslide initiations in wildfire-affected areas of western Greece, Bull. Eng. Geol. Environ., 75, 883–896, https://doi.org/10.1007/s10064-015-0762-5, 2016.
Langbein, J., Burford, R., and Slater, L.: Variations in fault slip and strain accumulation at Parkfield, California: Initial results using two-color geodimeter measurements, 1984–1988, J. Geophys. Res., 95, 2533–2552, https://doi.org/10.1029/JB095iB03p02533, 1990.
Liao, Z., Hong, Y., Wang, J., Fukuoka, H., Sassa, K., Karnawati, D., and Fathani, F.: Prototyping an experimental early warning system for rainfall-induced landslides in Indonesia using satellite remote sensing and geospatial datasets, Landslides, 7, 317–324, https://doi.org/10.1007/s10346-010-0219-7, 2010.
Lollino, G., Arattano, M., Allasia, P., and Giordan, D.: Time re-sponse of a landslide to meteorological events, Nat. Hazards Earth Syst. Sci., 6, 179–184, https://doi.org/10.5194/nhess-6-179-2006, 2006.
Ma, T., Li, C., Lu, Z., and Wang, B.: An effective antecedent pre-cipitation model derived from the power-law relationship be-tween landslide occurrence and rainfall level, Geomorphology, 216, 187–192, https://doi.org/10.1016/j.geomorph.2014.03.033, 2014.
Maki Mateso, J. and Dewitte, O.: Towards an inventory of landslide processes and the elements at risk on the Rift flanks west of Lake Kivu (DRC), Geo. Eco. Trop., 38, 137–154, 2014.
Marra, F., Destro, E., Nikolopoulos, E., Davide, Z., Creutin, J. D., Guzzetti, F., and Borga, M.: Impact of rainfall spa-tial aggregation on the identification of debris flow occur-rence thresholds, Hydrol. Earth Syst. Sci., 21, 4525–4532, https://doi.org/10.5194/hess-21-4525-2017, 2017.
McGuire, K., DeWalle, D., and Gburek, W.: Evaluation of mean residence time in subsurface waters using oxygen-18 fluctuations during drought conditions in the mid-Appalachians, J. Hydrol., 261, 132–149, https://doi.org/10.1016/S0022-1694(02)00006-9, 2002.
Melillo, M., Brunetti, M. T., Peruccacci, S., Gariano, S. L., and Guzzetti, F.: Rainfall thresholds for the possible land-slide occurrence in Sicily (Southern Italy) based on the auto-matic reconstruction of rainfall events, Landslides, 13, 165–172, https://doi.org/10.1007/s10346-015-0630-1, 2016.
Melillo, M., Brunetti, M. T., Peruccacci, S., Gariano, S. L., Roccati, A., and Guzzetti, F.: A tool for the automatic calculation of rain-fall thresholds for landslide occurrence, Environ. Model. Softw., 105, 230–243, https://doi.org/10.1016/j.envsoft.2018.03.024, 2018.
Migo´n, P. and Alcántara-Ayala, I.: Weathering and land-form development in a subtropical mountainous terrain, Veladero massif, Mexico, Z. Geomorphol., 52, 1–16, https://doi.org/10.1127/0372-8854/2008/0052-0001, 2008.
Moeyersons, J., Trefois, P., Lavreau, J., Alimasi, D., Badriyo, I., Mitima, B., Mundala, M., Munganga, D. O., and Nahimana, L.: A geomorphological assessment of landslide origin at Bukavu, Democratic Republic of the Congo, Eng. Geol., 72, 73–87, https://doi.org/10.1016/j.enggeo.2003.06.003, 2004.
Monsieurs, E., Kirschbaum, D., Thiery, W., van Lipzig, N., Kervyn, M., Demoulin, A., Jacobs, L., Kervyn, F., and Dewitte, O.: Con-straints on Landslide-Climate Research Imposed by the Reality of Fieldwork in Central Africa, in: 3rd North Am. Symp. Land-slides LandLand-slides Putt. Exp. Knowledge, Emerg. Technol. into Pract., 4–8 June 2017, Roanoke, Virginia, USA, 158–168, 2017. Monsieurs, E., Jacobs, L., Michellier, C., Basimike Tchangaboba, J., Ganza, G. B., Kervyn, F., Maki Mateso, J. C., Mu-garuka Bibentyo, T., Kalikone Buzera, C., Nahimana, L., Ndayisenga, A., Nkurunziza, P., Thiery, W., Demoulin, A., Kervyn, M., and Dewitte, O.: Landslide inventory for hazard assessment in a data-poor context: a regional-scale approach in a tropical African environment, Landslides, 15, 2195–2209, https://doi.org/10.1007/s10346-018-1008-y, 2018a.
Monsieurs, E., Kirschbaum, D. B., Tan, J., Maki Mateso, J.-C., Jacobs, L., Plisnier, P.-D., Thiery, W., Umutoni, A., Musoni, D., Bibentyo, T. M., Ganza, G. B., Mawe, G. I., Bagalwa, L., Kankurize, C., Michellier, C., Stanley, T., Kervyn, F., Kervyn, M., Demoulin, A., and Dewitte, O.: Evaluating TMPA rain-fall over the sparsely gauged East African Rift, J. Hydrometeo-rol., 19, 1507–1528, https://doi.org/10.1175/JHM-D-18-0103.1, 2018b.
Montgomery, D. R. and William, E. D.: Runoff generation in a steep, soil-mantled landscape, Water Resour. Res., 38, 1168, https://doi.org/10.1029/2001WR000822, 2002.
Napolitano, E., Fusco, F., Baum, R. L., Godt, J. W., and De Vita, P.: Effect of antecedent-hydrological conditions on rain-fall triggering of debris flows in ash-rain-fall pyroclastic mantled slopes of Campania (southern Italy), Landslides, 13, 967–983, https://doi.org/10.1007/s10346-015-0647-5, 2016.
Nikolopoulos, E. I., Crema, S., Marchi, L., Marra, F., Guzzetti, F., and Borga, M.: Impact of uncertainty in rainfall es-timation on the identification of rainfall thresholds for debris flow occurrence, Geomorphology, 221, 286–297, https://doi.org/10.1016/j.geomorph.2014.06.015, 2014. Nikolopoulos, E. I., Destro, E., Maggioni, V., Marra, F., and
Borga, M.: Satellite Rainfall Estimates for Debris Flow Pre-diction: An Evaluation Based on Rainfall Accumulation– Duration Thresholds, J. Hydrometeorol., 18, 2207–2214, https://doi.org/10.1175/JHM-D-17-0052.1, 2017.
Nobile, A., Dille, A., Monsieurs, E., Basimike, J., Bibentyo, T. M., d’Oreye, N., Kervyn, F., and Dewitte, O.: Multi-temporal DIn-SAR to characterise landslide ground deformations in a tropical urban environment: focus on Bukavu (DR Congo), Remote Sens-ing, 10, 626, https://doi.org/10.3390/rs10040626, 2018. Parker, R. N., Hales, T. C., Mudd, S. M., Grieve, S. W., and
Con-stantine, J. A.: Colluvium supply in humid regions limits the frequency of storm-triggered landslides, Sci. Rep., 6, 34438, https://doi.org/10.1038/srep34438, 2016.
Peruccacci, S., Brunetti, M. T., Luciani, S., Vennari, C., and Guzzetti, F.: Lithological and seasonal control on rainfall thresholds for the possible initiation of land-slides in central Italy, Geomorphology, 139–140, 79–90, https://doi.org/10.1016/j.geomorph.2011.10.005, 2012.