HAL Id: hal-00125080
https://hal.archives-ouvertes.fr/hal-00125080
Submitted on 17 Jan 2007HAL is a multi-disciplinary open access archive for the deposit and dissemination of sci-entific research documents, whether they are pub-lished or not. The documents may come from teaching and research institutions in France or abroad, or from public or private research centers.
L’archive ouverte pluridisciplinaire HAL, est destinée au dépôt et à la diffusion de documents scientifiques de niveau recherche, publiés ou non, émanant des établissements d’enseignement et de recherche français ou étrangers, des laboratoires publics ou privés.
Crystallisation and rheology of an hydrate slurry as
secondary two-phase refrigerant for air-conditioning
application
Myriam Darbouret, Michel Cournil, Jean-Michel Herri
To cite this version:
Myriam Darbouret, Michel Cournil, Jean-Michel Herri. Crystallisation and rheology of an hydrate slurry as secondary two-phase refrigerant for air-conditioning application. 2nd Phase Change Material and Slurry Workshop & 6th IIR Ice Slurry Workshop, 25 juin 2005, Jun 2005, Yverdon les Bains, Switzerland. �hal-00125080�
CRYSTALLISATION AND RHEOLOGY OF AN HYDRATE SLURRY AS
SECONDARY TWO-PHASE REFRIGERANT FOR AIR-CONDITIONING
APPLICATION
Myriam Darbouret, Michel Cournil, Jean-Michel Herri* Ecole Nationale Supérieure des Mines de Saint-Etienne
158 cours Fauriel 42 023 Saint-Etienne
France
ABSTRACT
Under atmospheric pressure condition and temperatures between 0°C and +12°C, Tetra-n-ButylAmmonium Bromide (TBAB) aqueous solutions crystallise into hydrate slurries. These slurries seems to be well appropriate for cold storage and transportation in the case of air-conditioning applications.
We focus here on the crystallisation and the rheological properties of TBAB hydrates slurries. Once the crystallisation conditions described, we propose an experimental analysis of their flow behaviour. The experimental device is made up of a brushed surface heat exchanger in which the hydrates slurry is generated, and of a measurement loop. The flow behaviour of the slurry is characterised through flow rates and pressure drops measurements. We obtain flow curves of hydrates slurries depending on the volume fraction of hydrate solid particles. In the range of shear rate investigated, hydrate slurries behave as Bingham fluids. We propose a method of determining their apparent viscosities and yield shear stress versus the volume fraction of hydrates.
Keywords : Rheology, Two-phase flow, Heat transportation, Air-conditioning
NOMENCLATURE
A: constant [Pa.m2]
D: diameter of the pipe [m] Dp: particle diameter [m]
L: length of the pipe [m] M: molecular weight [g.mol-1]
N: hydration number [-]
∆P: pressure drop [Pa] Q: volume flow rate [m3.s-1]
H
TBAB
x
x
,
: TBAB, Hydrate, mass fraction [-]γ
&,γ
&w : shear rate, wall shear rate [s-1]0
µ
,µ
l : Apparent, liquid viscosity [Pa.s]H
l
ρ
ρ
, : liquid, hydrate density [kg.m-3]w
τ
,τ
0: Wall and yield shear stress [Pa]m Φ
Φ, : mean, maximum volume fraction [-]
INTRODUCTION
In the context of the classical refrigerants phase out, phase change materials (PCM) arouse great interests. Indeed, for very low temperature application such as refrigeration, ice-slurries are spread as secondary refrigerants. Concerning hydrates, they have been used as PCM for cold storage for years. The challenge is now to extend this application to cold transportation in a secondary refrigerant loop. In Japan, JFE marketed the first hydrate slurry for air-conditioning.
The fluid studied is an aqueous solution of Tetra-ButylAmmonium Bromide ((C4H9)4NBr) (TBAB). At low
temperature this solution crystallises and forms a suspension of semi-clathrate hydrates. After a presentation of the physical properties of such hydrates, we propose hereafter a rheological study of theses TBAB hydrates slurries.
PHYSICAL PROPERTIES OF TBAB HYDRATES Thermodynamic properties
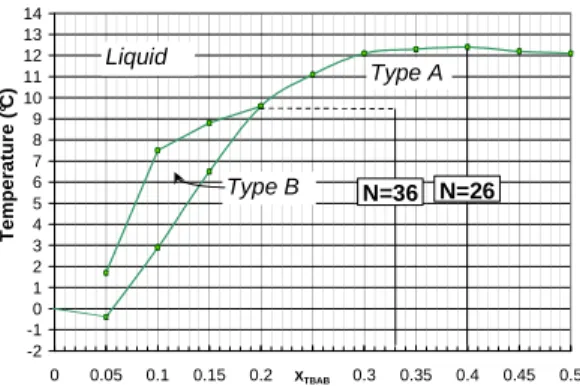
In a first time, the TBAB hydrates phase diagram was determined experimentally. The experiment consisted in measuring the melting temperature of TBAB hydrates for aqueous solutions of TBAB of different initial concentrations and at atmospheric pressure. Results are presented on figure 1 which represents the melting temperature of hydrates depending on the total concentration of TBAB. This figure highlights the existence of two different hydrate types, called Type A and Type B. These hydrates differ one from the other with their hydration numbers, i.e. with the number of water molecules per molecule of TBAB involved in the structure of the crystal. Tanasawa et al. [2] calculated these hydration numbers and gave respectively the values of 26 and 36 for Type A and type B hydrates.
-2 -1 0 1 2 3 4 5 6 7 8 9 10 11 12 13 14 0 0.05 0.1 0.15 0.2 X0.25TBAB 0.3 0.35 0.4 0.45 0.5 T e m p e ra tu re ( °C ) N=26 N=36 Type B Type A Liquid
Figure 1: Experimental equilibrium diagram
It is particularly interesting to underline the fact that, at atmospheric pressure, TBAB hydrates are stable for temperatures between 0°C and +12°C. Indeed, in current air-conditioning applications, the cold fluid enters the heat exchanger with a temperature close to +6°C and flow out at about +12°C. This hydrate is therefore a good candidate for air conditioning applications, from a thermodynamic point of view.
From the equilibrium diagram, assuming that the thermodynamics equilibrium is reached, one can deduced from temperature the TBAB mass fraction in the liquid phase. The so-called “moment law” (1), gives then a mean of calculating the hydrate mass fraction in the suspension when one knows the values of initial mass fraction of TBAB in the solution (x0), the mass fraction of TBAB in the liquid phase (xl) and the mass
fraction TBAB in the hydrate phase (xN).
l N l H
x
x
x
x
x
−
−
=
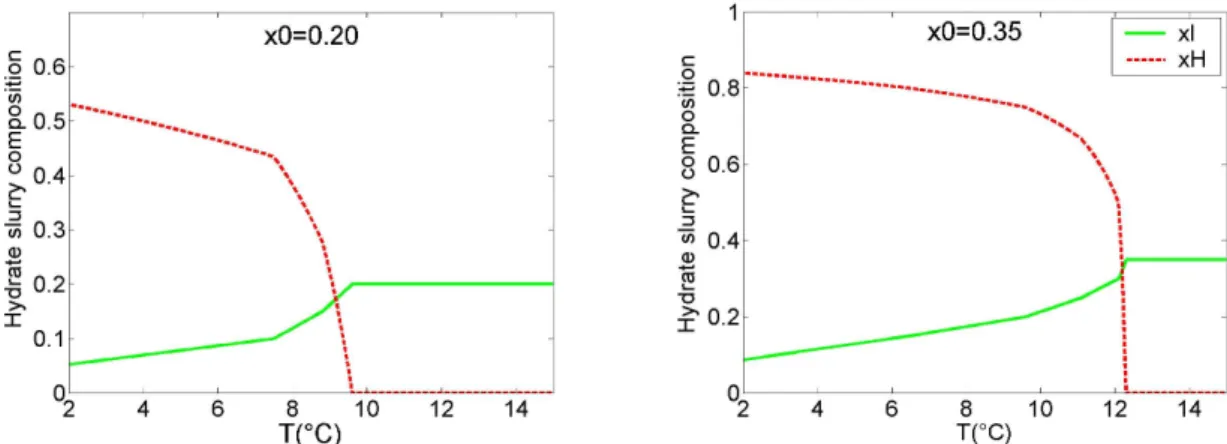
0 (1)Figure 2 presents an example of the evolution of the slurry composition versus temperature for aqueous solutions of 20% and 35% mass TBAB. The solid line represents the TBAB mass fraction in the liquid phase and the dashed line the hydrate mass fraction. Equations (2) and (3) give the exchange laws between liquid and solid phase for type A and type B TBAB hydrates.
) ( 2 2 26 26H O TBAB H Os TBAB+ → • (2) ) ( 2 2 36 36H O TBAB H Os TBAB+ → • (3)
Figure 2: Temperature dependence of the slurry composition x0=0.20 and x0=0.35. TBAB hydrates densities
In a second time, the densities of type A and type B hydrates were measured with a pycnometry method consisting in fully crystallising a known mass of TBAB solution. Once hydrates crystallised, hexane was added at the same temperature until the mixture had a precise volume of 10 ml. The mixture is weighted and the hexane volume calculated. The hydrates volume was obtained deducting the hexane volume added. The densities measured for each hydrate type are presented in Table 1. It also gives the mass fraction of TBAB in each hydrate crystal depending on its hydration number. Type B hydrate, with the highest hydration number, is the lightest.
Hydrate type Hydration number N (-) TBAB mass fraction in the hydrate xN (-) Density ρH (kg.m-3) A 26 0.41 1082 B 36 0.33 1067
Table 1: Physical properties of type A and type B hydrates.
Concerning the crystal structure, type A only is well determined and represented on Figure 3. Davidson [4] first gave a description of this clathrate structure. Then Shimada [3] published figure 3. It is a semi-clathrate hydrate as Nitrogen and Brome atoms replace some water molecules. The butyl chains are guests of four unclosed cavities : 3 tetrakaidecahedrons and one pentakaidecahedron. The dotted lines represent bonds which have disappeared from the classical hydrate structure.
Kinetics effects during TBAB hydrates crystallisation
Decreasing the temperature of TBAB aqueous solutions, hydrates crystals do not appear as soon as temperature reaches their crystallisation temperature : this is the supercooling phenomenon. Figure 4 presents the evolution with time of the temperature of a 20% mass TBAB aqueous solution flowing in the loop schemed on Figure 5. The three curves correspond to three points of temperature measurement (T1, T2 and T3). The lower temperature is observed in the brushed surface heat exchanger (T1). The successive apparitions of the two hydrate types are evidenced by two successive temperature increases. The slurry leaves then its metastable state for a stable one. On figure 4 are also represented the different fluid natures depending on time and temperature (liquid, type A or type B slurries). When type B hydrates appear, type A hydrates definitively disappear.
4 6 8 10 12 14 0 2 4 6 8 10 12 14 16 18 20 Temps (103s) Hydrate de
type I Hydrate de type II
Mélange Liquide Type A Hydrate Type B Hydrate
Liquid only Hydrate slurry
4 6 8 10 12 14 0 2 4 6 8 10 12 14 16 18 20 Temps (103s) Hydrate de
type I Hydrate de type II
Mélange Liquide 4 6 8 10 12 14 0 2 4 6 8 10 12 14 16 18 20 Temps (103s) Hydrate de
type I Hydrate de type II
Mélange Liquide Type A Hydrate Type B Hydrate
Liquid only Hydrate slurry
Type A Hydrate
Type B Hydrate
Liquid only Hydrate slurry
Figure 4: Evidence of the supercooling phenomena.
The magnitude of the supercooling defined as the difference between the theoretical temperature of crystallisation and the minimum temperature reached depends on many factors. For instance it is more likely to be great in a small reactor, or if there is no impurity in the fluid.
This supercooling phenomenon is to be avoided or minimized in an industrial context as it represents an additional energy consumption for slurry production. One technique used for example is seeding.
EXPERIMENTAL DEVICE Set-up description
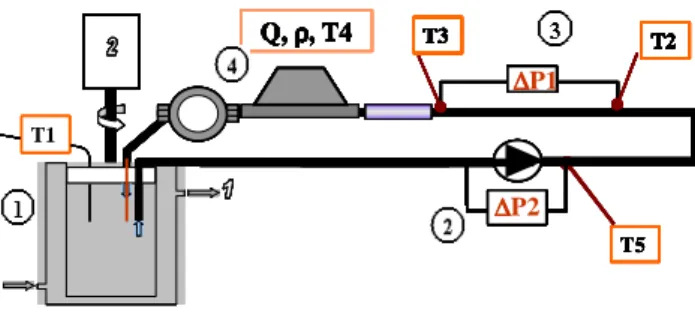
An “in-situ” experimental method is run here in order to avoid some difficulties due to “ex-situ” methods. It is an indirect method based on pressure drop and flow rate measurements. The matter of sliding at the wall still remains but we consider here the global apparent behaviour of the fluid which will be the same as in an industrial installation. The experimental set-up is shown in Figure 5. The hydrate slurry is generated in a brushed surface heat exchanger (1) and drained away with the aid of a gear pump (2) specially developed by GOTEC® for ice-slurry technology. After a 0.5 m long pipe, designed to reach an established hydrodynamic regime, the fluid flows through the “rheometer pipe” (3). This is a horizontal cylindrical pipe (L = 1 m; Dint = 1.6 10
-2
m) on which the pressure drop between the inlet and outlet is measured with a
differential pressure sensor from KELLER® [0-500 mbar] ± 0.1 mbar. The volumetric flow rate is given by
a Coriolis flowmeter (4) from MICRO MOTION® [0-500 l/h] (Accuracy : ± 0.5 %). The loop is also
equipped with temperature sensors Pt 100 from PROSENSOR (Accuracy : ± 0.1°C) , and with a transparent
section in order to observe the flow regime and the slurry appearance. The rotation frequency of the pump can span the range [10 Hz-50 Hz] by the use of a frequency controller.
T5 ∆ ∆ ∆ ∆P1 T1 T3 T2 ∆ ∆ ∆ ∆P2 Q, ρρρρ, T4 T5 T5 ∆ ∆ ∆ ∆P1 T1 T3 T2 ∆ ∆ ∆ ∆P2 Q, ρρρρ, T4 ∆ ∆ ∆ ∆P1 T1 T3 T2 ∆ ∆ ∆ ∆P2 Q, ρρρρ, T4 ∆ ∆ ∆ ∆ ∆P1 ∆ ∆ ∆ ∆P1 ∆ ∆ ∆P1 T1 T3 T2 ∆ ∆ ∆ ∆P2 Q, ρρρρ, T4 T3T3T3 T2T2T2 ∆ ∆ ∆ ∆P2 ∆ ∆ ∆ ∆P2 ∆ ∆ ∆ ∆P2 Q, ρρρρ, T4 Q, ρρρρ, T4 T5 ∆ ∆ ∆ ∆P1 T1 T3 T2 ∆ ∆ ∆ ∆P2 Q, ρρρρ, T4 T5 T5 ∆ ∆ ∆ ∆P1 T1 T3 T2 ∆ ∆ ∆ ∆P2 Q, ρρρρ, T4 ∆ ∆ ∆ ∆P1 T1 T3 T2 ∆ ∆ ∆ ∆P2 Q, ρρρρ, T4 ∆ ∆ ∆ ∆ ∆P1 ∆ ∆ ∆ ∆P1 ∆ ∆ ∆P1 T1 T3 T2 ∆ ∆ ∆ ∆P2 Q, ρρρρ, T4 T3T3T3 T2T2T2 ∆ ∆ ∆ ∆P2 ∆ ∆ ∆ ∆P2 ∆ ∆ ∆ ∆P2 Q, ρρρρ, T4 Q, ρρρρ, T4
Figure 5: Experimental set-up.
Procedure description
Experimental tests were performed on TBAB hydrate slurries to characterise their rheological behaviour. These tests aimed at determining the slurry apparent viscosity for different slurry temperatures, (i.e. for different hydrate contents). At a given temperature, the rotation speed of the pump motor is varied between
10 Hz and 50 Hz following regular steps. These steps are 5 Hz high and last about 30 s. Temperature,
volumetric flow rate Q and pressure loss ∆P are continuously recorded. The same procedure is repeated for
different slurry temperatures, as the hydrate content slowly increases as temperature decreases.
RHEOLOGICAL BEHAVIOUR OF HYDRATE SLURRIES
In this part we propose to study the rheological behaviour of TBAB hydrate slurries produced in the reactor (fig. 5). We first remind some useful tools for the rheological study and then present the results of the experiments.
Theoretical analysis
We consider a laminar and established flow in a horizontal cylindrical pipe. The pressure drop is linked to the wall shear stress through equation (4), derived from a momentum balance.
L P D w 4 ∆ =
τ
(4)Concerning the shear rate, it can be expressed introducing the volume flow rate thanks to the Rabinovitch relation. + = n n D Q w 4 1 3 32 3
π
γ
& with = 3 32 ln ) ln( D Q d d n wπ
τ
(5)In our case, curves representing pressure drop versus flow rate are straight lines which do not intercept the origin. That why, hereafter we describe the rheological behaviour of slurries through an extrapolated shear stress and an apparent viscosity. The behaviour law of such slurries is then similar to a Bingham fluid law :
−
=
0 03
4
1
8
τ
τ
µ
wD
U
(6)
<
=
>
=
−
0 0 0 0if
0
if
τ
τ
γ
τ
τ
γ
µ
τ
τ
&
&
(7)The actual existence of such a yield shear stress is not obvious, indeed, one can imagine a very rapid decrease of the viscosity with shear rate for very low shear rate. Nevertheless, in the range of mean velocities explored, the slurry behaves just as this yield stress did exist.
Results
Figure 6 presents some examples of flow curves (
γ
&
w,τ
w) obtained with TBAB hydrate slurries. These areproportional to the extrapolated or yield shear stress. Concerning the slope it is equal to the apparent viscosity of the slurry. This way, one can associate to each volume fraction of hydrate, an apparent viscosity and a yield shear stress.
It is to note that for initial mass concentration near 0.40, the hydrate phase diagram (Figure 1) is very flat. This implies that very low temperature variations correspond to significant changes of the hydrate mass fraction. On Figure 6 are represented the three flow curves TBAB hydrate slurries produced with a solution of 35% initial mass concentration of TBAB. With such a solution, the hydrate mass fraction is calculated with poor accuracy because of the temperature probe accuracy (±0.1°C).
τ0 = 0,016γ + 1,9 τ0 = 0,016γ + 1,9 τ0 = 0,016γ + 1,9 τ0 = 0,016γ + 1,9 τ0 = 0,044γ + 2,8 τ0 = 0,044γ + 2,8τ0 = 0,044γ + 2,8 τ0 = 0,044γ + 2,8 τ0 = 0,074γ + 5,2 τ0 = 0,074γ + 5,2τ0 = 0,074γ + 5,2 τ0 = 0,074γ + 5,2 0 2 4 6 8 10 12 14 16 18 20 0 50 1008U/D (s-1)150 200 250 D .D P /4 L ( P a ) T=12.1°C T=12.0°C T=11.8°C
Figure 6: Flow curves of hydrate slurries (x0=0.35) Apparent viscosity
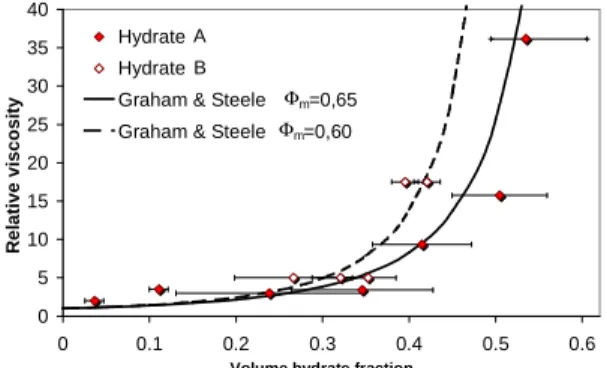
Figure 7 presents the evolution of the relative viscosity of the slurry (µr =µ0 µl) with hydrate volume fraction. This volume fraction is derived from the mass fraction thanks to equation (8).
1 1 1 + − = Φ H H l H x x
ρ
ρ
(8)The apparent viscosity of the slurry increases progressively with its load and tends to diverge as the volume fraction of hydrate approaches 60% mass. The apparent viscosity of slurries of type B hydrates seems to diverge for slightly lower mass fraction than type A hydrate.
0 5 10 15 20 25 30 35 40 0 0.1 0.2 0.3 0.4 0.5 0.6
Volume hydrate fraction
R e la ti v e v is c o s it y Hydrate I Hydrate II
Graham & Steele =0,65 Graham & Steele =0,60Φm
Φm
A B
Figure 7: Influence of the hydrate structure on viscosity
The experimental viscosities obtained are then compared with the Graham, Steele and Bird [5] model of viscosity which introduces a maximum packing fraction
Φ
m. When particles in the suspension reach thisvolume fraction
Φ
m, one can consider that all the particles are in contact in a more or less porous network.This maximum packing fraction depends on the shape of the crystals and their size distribution.
The expression of suspension viscosity proposed by Graham et al. considers an additional volume of the liquid phase V0 trapped by the particles which can form clusters.
2 1 2 0
1
1
1
1
Φ
Φ
−
Φ
−
−
Φ
+
=
m m mV
(9)The corresponding viscosity of the suspension is given by (10).
(
)
2,5 0 0=
µ
l1
−
V
Φ
−µ
(10)On Figure 7, the results given with this Graham et al. model for
Φ
m=
0
.
60
andΦ
m=
0
.
65
are superposed to the experimental values of apparent viscosity respectively for type A and type B hydrates slurries. It seems that type B hydrates form a suspension less compactable that type A hydrates. Consequently, the structure of the crystals seem to play an important role in the rheological behaviour of their slurries. To give an idea of what represent such maximum packing fractions, one can say that, with monodisperse spheres,Φ
m=
0
.
64
for a random stack andΦ
m=
0
.
61
is obtained with an hexagonal arrangement.EXTRAPOLATED SHEAR STRESS
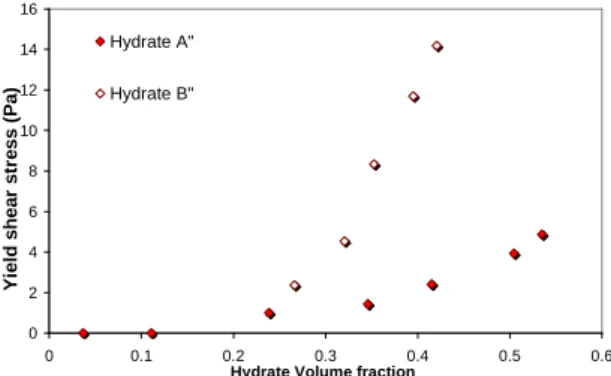
Figure 8 presents the dependence of the extrapolated shear stress with the volume hydrate fraction for the two hydrate types.
Once again type B hydrate slurries are less transportable as its yield stress are much higher than the ones of type A hydrate slurries.
0 2 4 6 8 10 12 14 16 0 0.1 0.2 0.3 0.4 0.5 0.6 Hydrate Volume fraction
Y ie ld s h e a r s tr e s s ( P a ) Hydrate A" Hydrate B"
Figure 8: Influence of the hydrate structure on yield shear stress
This yield shear stress is the minimum shear stress which leads to the flow of the fluid. In the case of suspensions it is interpreted as the stress necessary to overcome the interaction forces between particles and permit the flow of the suspension. Therefore, the higher volume fraction of particles, the higher yield stress; and the higher strength of interparticle interactions, the higher yield stress.
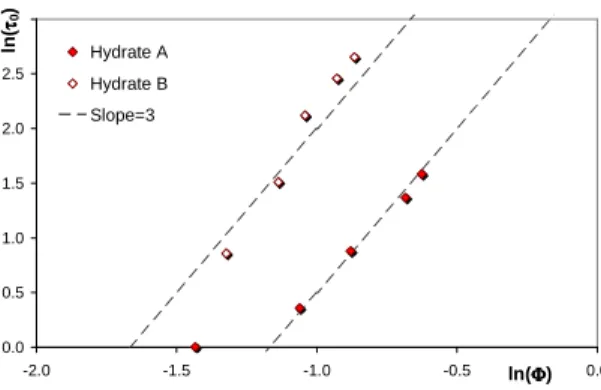
With Figure 9 the dependence of the yield shear stress with the volume hydrate fraction is highlighted with a log-log representation. We obtain some straight lines of slopes close to 3. It means that the yield shear stress varies like
Φ
3. This phenomenon was already observed and evidenced by Thomas [6] for different metal oxides suspensions. The empirical relations he proposed take into account a shape factorψ
(for non-spherical particles), a particle equivalent diameter Dp, and the particle volume fraction:3 2 0 = Φ p D A
ψ
τ
(11)0.0 0.5 1.0 1.5 2.0 2.5 3.0 -2.0 -1.5 -1.0 -0.5 ln(ΦΦΦΦ) 0.0 ln (ττττ0 ) Hydrate A Hydrate B Slope=3
Figure 9 : Dependence of the yield shears stress with hydrate volume fraction.
CONCLUSION
Under atmospheric pressure and temperatures between 0°C and +12°C, aqueous solutions of TBAB can form two types of semi-clathrate TBAB hydrate slurries. Each TBAB hydrate crystal appear after a variable period of metastability and then the thermodynamic equilibrium is regained. In the range of shear rates explored, the rheological behaviour of TBAB hydrate slurries can be described with an apparent viscosity and a extrapolated yield shear stress. This study evidences that TBAB hydrate slurries are transportable until rather high loads of particles (∼ 40% volume). Moreover the Graham et al. model of viscosity for suspensions seems to be appropriate to describe the evolution of the viscosity of the slurries with the volume fraction of particles if two different maximum packing fractions are introduced for the two hydrate types. Concerning the extrapolated yield shear stress, it varies like
Φ
3 for the two hydrate types. An additional study of the interparticle interaction forces should be interesting in order to go further in the interpretation of the yield shear stress.Lastly, an estimation of the specific heat and fusion enthalpy of such slurries is to be done in order to be able to estimate the COP of an air-conditioning installation running with TBAB hydrate slurries.
REFERENCES
[1] Lipowski J, Komarov V Yu, Rodionova TV, Dyadin YA, Aladko LS. The structure of
TetraButylAmmonium Bromide hydrate (C4H9)4nBr.2 1/3
H2O, Journal of Supramolecular Chemistry
2002;2:435-439.
[2] Tanasawa I, Takao S. Clathrate hydrate Slurry of Tetra-n-butylammonium Bromide as a cold storage
material. In: hydrate-based technologies, Proceedings of the International Congress on Gas Hydrate,
Yokahoma, 2002.
[3] Shimada W, Ebinuma T, Oyama H, Kamata Y, takeya S, Uchida T, Marita H. Separation of Gas
Molecule Using Tetra-n-Butyl Ammonium Bromide Semi-Clathrate Hydrate Crystals. Japanese
Journal of Physics 2003;42:L129-L131.
[4] Davidson DW, Water a comprehensice treatise, In: Plenum Press ed., New York-London 1973, chap. 3, p.144.
[5] Graham AL, Steele RD, Bird RB. Particle clusters in concentrated suspensions. 3. Prediction of
suspension viscosity. Ind. Eng. Chem. Fundam. 1984;23:420-425.
[6] Thomas DG. III. Laminar-Flow Properties of Flocculated Suspensions. AICHE Journal 1961;7:431-437.
ACKNOWLEDGEMENTS