HAL Id: hal-02420587
https://hal.archives-ouvertes.fr/hal-02420587
Submitted on 12 Mar 2020
HAL is a multi-disciplinary open access
archive for the deposit and dissemination of sci-entific research documents, whether they are pub-lished or not. The documents may come from teaching and research institutions in France or abroad, or from public or private research centers.
L’archive ouverte pluridisciplinaire HAL, est destinée au dépôt et à la diffusion de documents scientifiques de niveau recherche, publiés ou non, émanant des établissements d’enseignement et de recherche français ou étrangers, des laboratoires publics ou privés.
Aleksandra Lelevic, Vincent Souchon, Maxime Moreaud, Chantal Lorentz,
Christophe Geantet
To cite this version:
Aleksandra Lelevic, Vincent Souchon, Maxime Moreaud, Chantal Lorentz, Christophe Geantet. Gas chromatography vacuum ultraviolet spectroscopy: A review. Journal of Separation Science, Wiley-VCH Verlag, 2020, 43 (1), pp.150-173. �10.1002/jssc.201900770�. �hal-02420587�
Received: 31/07/2019; Revised: 13/11/2019; Accepted: 15/11/2019
This article has been accepted for publication and undergone full peer review but has not been through the copyediting, typesetting, pagination and proofreading process, which may lead to differences between this version and the Version of Record. Please cite this article as doi:
Journal of Separation Science November 12th, 2019
Gas Chromatography Vacuum Ultraviolet Spectroscopy: A Review
Aleksandra Lelevica,b,*, Vincent Souchona, Maxime Moreauda,c, Chantal Lorentzb, Christophe
Geantetb
a. IFP Energies nouvelles, Rond-point de l'échangeur de Solaize BP 3, 69360 Solaize,
France
b. Université de Lyon, IRCELYON, UMR5256 CNRS-UCB Lyon 1, 2 Avenue Albert
Einstein, 69626 Villeurbanne Cedex, France.
c. MINESParisTech, PSL-ResearchUniversity, CMM, 35 rue Saint Honoré,77305
Fontainebleau, France
* Author for correspondence: [email protected]
Abbreviations
VUV – Vacuum ultraviolet
GC×GC - Comprehensive gas chromatography
MDGC - Multidimensional gas chromatography
1D - First dimension
EI – Electronic ionization
FAME – Fatty acid methyl ester
DMN - Dimethylnaphthalenes
IL- Ionic liquid
DCB - Dichlorobenzene
TID - Time interval deconvolution
QMS - Quadrupole mass spectrometer
TOFMS - Time-of-flight mass spectrometer
FID - Flame ionization detector
HS - Headspace
Key words: Vacuum ultraviolet spectroscopy, gas chromatography, comprehensive gas
Abstract
Accelerated technological progress and increased complexity of interrogated matrices
imposes a demand for fast, powerful and resolutive analysis techniques. GC has been for a
long time a ‘go-to’ technique for the analysis of mixtures of volatile and semi-volatile
compounds. Coupling of the several dimensions of GC separation has allowed to access a
realm of improved separations in the terms of increased separation power and detection
sensitivity. Especially comprehensive separations offer an insight into detailed sample
composition for complex samples. Combining these advanced separation techniques with an
informative detection system such as Vacuum Ultraviolet spectroscopy is therefore of great
interest. Almost all molecules absorb the Vacuum ultraviolet radiation and have distinct
spectral features with compound classes exhibiting spectral signature similarities. Spectral
information can be ‘filtered’ to extract the response in the most informative spectral ranges.
Developed algorithms allow spectral mixture estimation of coeluting species. Vacuum
ultraviolet detector follows Beer-Lambert law, with the possibility of calibrationless
quantitation. The purpose of this article is to provide an overview of the features and
specificities of GC-Vacuum Ultraviolet spectroscopy coupling which has gained interest
since the recent introduction of a commercial Vacuum Ultraviolet detector. Potentials and
1. Introduction
Gas Chromatography (GC) is an established technique for the analysis of volatile and
semi-volatile compounds. Improvements of GC systems and developments of new stationary
phases have enabled very good separation capabilities for a wide range of applications.
Advances in terms of superposing several dimensions of separation and realizing GC×GC
and even possibly GC×GC×GC [1] separations have enabled the analysis of extremely
complex samples for whose separation capabilities of 1D GC are not sufficient. Typical
example of matrices non-amenable to 1D GC, for their exhaustive characterization, are the
heavier fractions of petroleum (> C10). To gain a perception into the composition of such
complex samples, extremely resolutive analytical solutions are necessary. GC or GC×GC in
combination with FID detection allows quantitation of C containing species, however it
offers no direct qualitative information. Coupling of the comprehensive separation with
informative detection techniques such as MS can aid in qualitative characterization of
complex media. MS however requires fastidious calibrations for quantification of targeted
analytes, user’s expertise and results in a large laboratory footprint. Problems with many of
the detection techniques commonly used with GC are insufficient sensitivity and selectivity
of the response, in the case of GC×GC also the lack of acquisition speed. One detection
technique that would meet all the requirements and fit all application areas does not exist.
Among all the detection techniques that may be encountered, spectroscopic techniques are
very interesting. In particular, the broad band VUV absorption spectroscopy has gained
attention in the last couple of years due to the recent availability of commercial
instrumentation. Owing to the interesting features of this detection technique numerous
this technology and summary of the first applications was provided by Santos and Schug [2].
The purpose of our work is to offer an update on the most recent advances in the application
of VUV technology and enlighten on the important features of
GC(GC×GC)-VUV coupling.
2. Vacuum ultraviolet spectroscopy
According to modern classification of solar irradiance spectral categories (ISO 21348), VUV
spectral range encompasses wavelengths region from 10 to 200 nm [3], or photon energies
from 6.2 to 124 eV. Nearly all chemical species absorb strongly and have unique absorption
cross sections in the VUV wavelength range [4,5]. As it can be seen on Figure 1, absorption
of water in the low-UV region is stronger by several orders of magnitude than its absorptivity
in the IR region. Transitions in this region involve the excitation of nonbonding electrons to
orbitals whose molar absorptivities are low to intermediate and are usually in the range
between 100 and 3000 [4]. At these wavelengths, there exist sufficient energy to photodissociate most organic molecules which leads to the presence of some
ionized or photolyzed species in the measuring volume [6]. VUV light thus can be employed
as an ionization source for MS [6]. Additionally, secondary chemical reactions such as
chemical ionization by proton transfer may occur [7]. However, relative concentration of
these ionized species is low and the detection of intact molecules is possible because of
potential ion neutralization and low cross section for photodegradation processes within the
When it comes to the electronic transitions involved, low-UV radiation allows to explore
Rydberg transitions of liquids, hydrogen bonds and hydration of water, aqueous solutions,
and inorganic and organic molecules; it allows the analysis of gas, solid or liquid samples as
spectral features are sensitive to chemical bonding, molecular conformations and molecular
environment; sensitive quantitative analysis is possible as absorptivity of most species in this
region is quite high but also dependent on compound’s concentration and the conditions of
temperature, pH, etc. [9,10]. Recently, Mao et al. [11] investigated VUV absorbance of
alkanes by combining experimental VUV spectral data and the results of theoretical quantum
mechanics calculations. They confirmed that the excitations involved in alkanes are of the
Rydberg type and further elaborated on the influence of the molecular structure on the
appearance of the absorbance edges for linear and cyclic alkanes.
Another interesting feature of VUV absorbance spectroscopy is the possibility of
discrimination between isomers [12,13], small [14] and labile compounds [15] owing to their
highly featured spectral signatures, while they traditionally pose a problem for MS detection.
All compounds exhibit absorbance at low wavelengths hence selectivity in this range is
lower. The specificity is the best towards unsaturated compounds exhibiting π → π*
transitions owing to their intense absorbance at wavelengths longer than 170 nm. Figure 2
illustrates the VUV spectra for few selected hydrocarbons. Depending on the molecular
structure, distinct and characteristic spectral features can be observed. Saturated,
monoaromatic and diaromatic species in question can hence be easily differentiated.
Polyaromatics species dominantly absorb at wavelengths longer than 240 nm. It is often
difficult to differentiate between conjugated and non-conjugated diolefins by conventional
absorbance at 200-240 nm, while nonconjugated diolefins exhibit hardly any response in this
wavelength region. Isomers, which can be challenging for MS can be easily distinguished by
VUV. This was demonstrated on the examples of naphthols and xylenes [5], cis- and
trans-fatty acids [16] and their methyl esters [13], dimethylnaphthalenes [17], dichlorobenzenes
[8], carbohydrate isomers [18], methyl benzophenons [19], nitroaromatics [20], isomeric
pesticides [15], terpenes [21], fentanyl analogues [22]. Aromatic compounds spectra are very
elaborate with additional functional groups adding new spectral features. In general it was
observed that the increase in the number of aromatic rings [23] or double bonds [16] causes a
shift of the absorbance maxima towards longer wavelengths. The steeper slope in the
aliphatic region of the aromatic species spectra can signify the increasing length of the alkyl
chains, while the increase of the number of alkyl chains connected to the aromatic ring causes
a bathochromic shift of the absorbance maxima [23].
In addition to qualitative characterization, quantitative information can be extracted owing to
VUV absorbance following the Beer-Lambert Law. If molecular cross sections are known,
even calibrationless quantification is a possibility [24]. Additionally, as Beer-Lambert law is
linear and additive, linear spectral mixture estimation algorithms can be used to investigate
the composition of mixtures [25]. This often requires the predetermination of spectra (i.e
molecular cross sections) for the reference compounds.
Computation of the theoretical VUV/UV spectra is possible using a variety of methods
ranging from semiempirical approaches and the density functional theory calculations to
spectra of the assorted dimethylnaphthalene isomers. They observed that the most important
features of the experimental spectra were nicely reproduced in the theoretical one. The
theoretical spectra demonstrated the correct order of the main peak positions, as well as
relative peak intensities. Skultety and coworkers [12] also employed time-dependent density
functional theory to model theoretical VUV spectra for an isomeric set of new designer
stimulant drugs, for which library spectra were not available. Assignment was performed
with least square optimization by identifying the theoretical spectrum for which the sum of
the squared residuals, when compared to the experimental spectrum, was the lowest. Many of
the structures were correctly identified based on such computational approach. When correct
assignment was not achieved, authors assumed that this was owing to the disadvantage of the
approach that the computed spectra were based on a single fixed structure, while in reality,
molecules are flexible. Hence, it is necessary to take into the account all practical
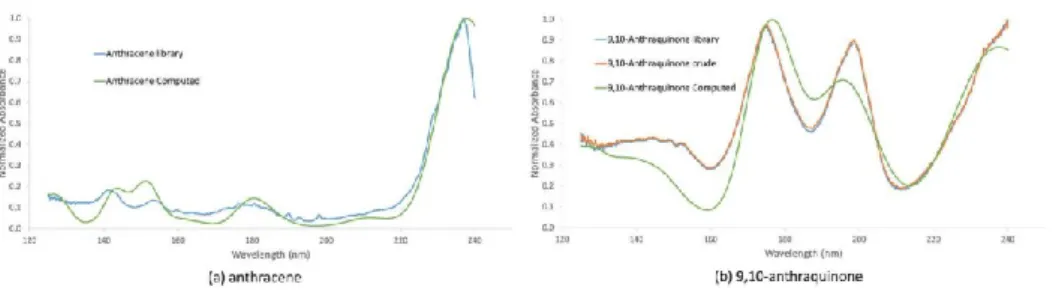
conformations of the molecule. Ponduru et al. [27] compared GC-VUV data with time-DFT
for the computation of the absorption spectra for oxidation monitoring of polycyclic aromatic
hydrocarbons (anthracene, naphthalene, and pyrene). The use of experimental absorption
spectra, combined with spectral library matching, and computed absorption spectra provided
good results (Figure 3), however they concluded that improvements in computational
methods are needed in order to derive more experimental-like spectra. In the recent work,
Mao et al. [28] investigated the possibility of PIONA class compounds VUV spectra
simulation by employing time-dependent density functional theory. Good correlation between
theoretical calculation and experimental spectra was obtained. TDDFT methods optimized
parameters proved to be quite stable over a wide range of PIONA compounds, allowing for
possibility of heavier PIONA compounds spectra simulation with good confidence. As in the
previous work, it was concluded that further improvements in computational methods are
VUV absorption spectroscopy being a universal detection technique allows to probe the
electronic transitions exhibited virtually by all compounds (with the exception of noble gases,
hydrogen and nitrogen which exhibit minimum absorption characteristics). This feature is
particularly interesting as these gases are the commonly used carrier gases for gas
chromatography.
3. Vacuum ultraviolet spectroscopy coupling with GC
3.1. Spectroscopy as a detection technique for GC
1D GC is a ‘go-to’ technique for the analysis of volatile and semi-volatile samples.
Regulatory and industrial methods still rely heavily on the elaboration of this technique
coupled with different detection solutions, including FID or MS [2]. Despite having
unsurpassed qualitative analytical capabilities, MS involves complex instrumentation and
elaborate quantification. MS also often falls short in certain areas where isomeric and isobaric
analytes ought to be differentiated [29] and in all cases where similar fragmentation patterns
are incurred, especially if analytes are additionally coeluting. The resolution of coeluted
compounds requires sophisticated algorithms and softwares to tease apart temporal changes
in complex fragmentation spectra [30]. Comparison of the basic features of the detection
techniques commonly applied in combination with GC, including VUV, is summarized in
Among the numerous detection techniques that are amenable to coupling with GC,
spectroscopic measurements are known to be very reliable in terms of precision and accuracy.
When employed in the gas phase, spectroscopy can provide superior information compared to
conventional liquid medium profiling. In liquids, solvent effect is dominant, hence it tends to
obscure the vibrational features of the compounds. However, the most significant drawback is
that the solvent wavelength “cut-off” restricts the highly informative wavelength range below
∼195 nm [31]. In the gas phase, many of the incurred solvent effects are absent. Gas-phase spectra have been found to be characteristic for the absorbing species and to exhibit very
elaborate features in most cases. Furthermore, families of compounds tend to exhibit spectral
similarities.
IR spectroscopic detectors assay the interactions of the mid-IR light with the sample. IR
detectors are highly informative regarding the structure of the interrogated molecules.
However, molecules tend to possess small absorption cross-sections in the IR range, hence
leading to inferior sensitivity of the detection [32].
Atomic Emission Detector, while being destructive and giving only elemental information, is
another significant example of spectroscopic detectors employed for gas chromatography
[33]. This detector offers multielement detection with an equimolar response
(compound-independent) [34,35]. However, for this detector spectral interferences must be identified and
eliminated. For example, it has been demonstrated that compounds containing CO functional
group are likely to emit in the same spectral region as sulphur [36]. Additionally, its
sensitivity is element specific, e.g. its response for oxygen is low compared with that for
UV spectroscopy has been used with GC during the past 40 years [38]. Advantages of the
conventional UV spectrometers include: reliable qualitative and quantitative information,
possibility of very simple instrumentation [39], detection of organic and inorganic
compounds. When moving towards low-UV range sensitivity becomes orders of magnitudes
higher however the loss in fingerprint selectivity is incurred [40]. The advantages of a UV
detector for GC have long been recognized [38,41,42], but the instrument development was
lagging. This is especially true for the low end-UV range, since owing to high absorption of
most compounds instruments ought to be purged by nitrogen or employed in the vacuum
environment and designed with specific transparent optical windows. Despite the slow
developments, research into the possibility of employing VUV as a detection method for GC
continued and did not fail to demonstrate the numerous advantages of the technique. Recent
appearance of the commercial VUV system gave a new insight into the analytical capabilities
of the detection in the VUV range.
3.2. Vacuum ultraviolet spectroscopy as a detection method for GC
First applications of the vacuum ultraviolet spectroscopy (10-200 nm) were mostly limited to
synchrotron light source application [43,44] (in order to compensate for significant
background absorption [5]) and single wavelength photodiodes [45–47]. Lagesson and
coworkers [31] introduced in 1998 a novel system offering broad band absorption monitoring
in the VUV/UV region (168-330 nm). They performed studies of the absorption spectra for
∼1000 organic compounds and a number of inorganic gases. Very important finding was that for all the spectra recorded, 69% showed absorption maxima at wavelengths shorter than 190
After 2000, studies involving GC-VUV have been sparse, essentially due to the lack of
commercial instrumentation. This recently changed with the introduction of a benchtop
spectrometer delivering full absorption spectra in the VUV wavelength region (down to 125
nm) within milliseconds (VUV Analytics®) [5]. Since the launch of this universal
non-destructive detection technique offering qualitative and quantitative measurements, a
progressive surge in studies involving diverse applications has been witnessed. Figure 4
illustrates the timelines of the VUV detection technique evolution and the main developments
in terms of GC-VUV configuration.
3.2.1. Technical considerations
Technical overview and the working principle of the new VUV-spectrometer is described
elsewhere [5]. Briefly, GC effluent is directed via a stainless steel transfer line into a 10 cm
long flow cell. After passing through the VUV flow cell, a broad band light, emitted from a
deuterium lamp, is directed onto a holographic grating. Transmitted wavelengths from 125 to
240 nm (430 nm for the second generation instrument) are then focused onto a back-thinned
CCD detector. In the flow cell, make-up gas (nitrogen, argon, or other) is introduced, while
the flow cell itself and the transfer line are kept at elevated temperature. Acquisition
frequency depending on the instrument can be up to ca. 90 Hz. Lower frequencies are
preferred as elevated acquisition rates induce significant noise. However, in this case care
must be taken that sufficient number of data points are sampled across each chromatographic
In the GC-VUV coupling main technical considerations are related to make-up gas pressure
regulation. Make-up gas flow is more critical in the earlier version of the VUV detector
(VGA-100) where, owing to the larger size of the flow cell (80 µl), more significant peak
dispersion can be incurred. This phenomenon is related to the diffusion coefficient of the
analyte and is more prominent for lower molecular weight species [48]. In such cases,
decreasing the residence time in the volume of the detector flow cell can aid in reducing the
peak broadening. This however further reduces the time that eluent spends in the cell
adversely affecting the signal averaging time and hence the intensity of the signal decreases.
Concerns regarding the peak widths owing to the size of the VUV flow cell have significantly
decreased with the introduction of the new VUV detector version (VGA-101) featuring
reduced size of the flow cell 40 µl.
Most authors have reported a ‘mass-dependent’ response of the VUV detector [5,24,48]. In
the case of mass sensitive detectors peak height is proportional to the mass flow, while peak
area being an integration of the detector response over time is dependent only on the absolute
mass of the analyte in the carrier gas [49]. However, the perceived global detector response
behavior as a function of analyte concentration or absolute quantity in the given time strongly
depends on the particular set-up and involved flow regulation. For the systems featuring
additional make-up gas supply detector response behavior can be less straightforward. VUV
detector follows Beer-Lambert law, hence it is a concentration sensitive detector [50,51].
However, in certain cases VUV detector can appear to exhibit mass dependent response. This
is owing to the additional make-up gas supply and combined influence of the GC effluent and
Temperatures of the VUV transfer line and the flow cell ought to be maintained high enough
in order to avoid condensation of the high boiling constituents, their loss and fouling of the
instrument. The optimal approach is keeping these temperatures dozen of degrees higher than
the final temperature of the GC separation. As GC-VUV set-up has two thermal zones, on
one side GC oven and on the other VUV transfer line and flow cell, during a temperature
programmed GC run, effluent flow in the VUV flow cell will slightly increase. This is due to
the elevated temperature of the VUV which generates an additional pressure resistance.
Flow variations might affect the quantitation performance especially at higher GC flows,
hence the possible effects on quantification ought to be investigated.
3.2.2. Qualitative analysis
As mentioned in the previous Section, VUV spectrometer allows absorbance monitoring at
wavelengths down to 125 nm. During each detector scan a full range absorbance spectrum is
obtained and a chromatogram can be generated by using any number of wavelength ranges.
Typical acquisition time of one spectra is ca. 11 ms. Generally, the response in the 125-240
nm range is employed to visualize the entire chromatogram since the use of the longer
wavelengths induces significant noise. Average detector response over an investigated range
denoted as ‘spectral filters’ can be employed to selectively highlight the presence of
compounds which preferentially absorb in the given region [52]. Aromatic compounds can be
highlighted by averaging the response in the wavelength range where their absorbance is
highlight the presence of saturated compounds, while at 200-240 nm diaromatics or
conjugated di-olefins can be accentuated. Since all compounds absorb at lower wavelengths,
selectivity significantly increases with moving towards longer wavelengths.
VUV absorbance detection allows to distinguish many compounds, however it possesses
limited differentiation ability for species possessing similar spectral signatures. In such cases
chromatographic resolution is necessary to achieve discrimination of investigated species.
Santos et al. [53] employed GC-VUV for qualitative and quantitative determination of fatty
acids in blood plasma. FAMEWAX column was selected to obtain additional resolution for
the positional isomers (C16:1 (n-7 and n-9) and C18:1 (n-7 and n-9)) for which VUV spectra
exhibited high similarity. Lack of selectivity can also be overcome by coupling VUV
spectrometer with a complementary detection technique such as MS. VUV-MS coupling in
series has been recently proposed in the works by Anthony et al. [8,54]. They demonstrated
that tandem GC/VUV-MS chemical identification approach that employs databases from GC,
VUV spectroscopy and MS results in a much improved identification of chemical mixtures
examined, owing to a better identification of analytes challenging to distinguish by VUV
(e.g., alkanes) or MS alone (e.g., isomers). VUV exhaust transfer line was rerouted to exit
through the VUV via a stainless steel heated transfer line and into a triple quadrupole mass
spectrometer (TQMS). This instrumental set-up allowed to maintain MS ionization source
pressure of 100 to 150 mTorr within a GC run while the VUV flow-cell registered -0.105
psig. No significant peak broadening was obtained when VUV was introduced, however
slight shift of retention times for aromatic compounds was observed. Additionally, no marked
difference in abundance of ions in the mass spectra after the introduction of VUV was
which inhibits the use of the make-up gas in the VUV flow cell. Not using the make-up can
cause additional concerns due to quantification issues related to possible analyte losses. Dual
VUV-MS detection in the split mode was also demonstrated [22], however detailed
investigation of the possible influence of VUV on the MS quantitation was not made.
3.2.3. Quantitative analysis
Depending on their molecular cross section, compounds exhibit different VUV response.
VUV detector follows Beer-Lambert law with a 2-3 orders of magnitude dynamic range.
VUV spectra over time for a mixture of compounds can be represented as a matrix, which is a
product of a concentration profile matrix and a matrix of spectral features for each of the
compounds (see Figure 5). This implies that from the observed spectra (‘A’), concentration
profiles can be calculated and the concentration of each compound in the mixture inferred
leading to quantitative results. This can be achieved by employing relative response factors
for a specific range of wavelengths but also with a matrix approach exploiting all of the
observed wavelengths. Both ‘supervised’ [25] quantitative methods where response factors
are already known (based on reference spectra) and ‘unsupervised’ [20] approaches where
they are computed for unknown coeluted compounds were explored.
Estimation of the relative response factors (RRFs) which allow to convert VUV response area
to mass percent was demonstrated in several works [23,25,52]. RRFs can be calculated as an
average for a family of compounds in order to achieve a group type quantification. It was
wavelength range is considered in accordance with their similar spectral features [25], while
for aromatics more variability in RRFs is present. For the PIONA class molecules, it was
observed that the absorbance for a given mass of compound tends to be relatively uniform
[25]. Weber et al. [52] performed mass percent quantification of saturates, mono, di, and
polyaromatics in diesel type samples. Quantification was achieved by dividing 125-240 nm
filtered chromatogram into three regions corresponding to contributions from each of the
families, the start of the naphthalene peak and the start of the anthracene peak being taken as
the points of division between the three investigated classes. RRFs for saturates and
monoaromatics were obtained from prior studies [25] while diaromatic and polyaromatic
responses were calculated based on the dynamic filtering approach and standard addition
data. More significant errors were obtained in the quantification of polyaromatics owing to
their lower abundance (<1%). García-Cicourel and Janssen [23] developed a GC-VUV
method for the measurement of the total level of aromatic hydrocarbons in purified mineral
oils. Relative response factors for alkanes were ta en to be . relative to methane in
accordance with previous works [25,52]. Aromatic species response factor was calculated as
an average for the eight investigated mineral oils aromatic fractions, relative to the response
of saturates. The minimum MOAH level determined with this method was approximately
0.13% and RSD values achieved were better than 8%.
Theoretically, VUV detection allows for pseudo-absolute quantification of analytes based on
the pre-recorded cross sections without the need for conventional calibration [24]. Namely,
the analyte peak area depends on several factors: the amount of analyte, the total flow rate
(GC flow rate plus make-up gas flow rate), flow cell dimensions and the absorption
known, the amount of analyte can be deduced from the measured peak area, thus limiting the
need for calibration. Cross-sections being measured quantities have various systematic errors
associated with their estimated values [24], however they can be refined over time based on
repeated analysis and the use of improved instrumental techniques [55]. Bai et al. [24]
evaluated in their study the use of the pseudo-absolute method in order to experimentally
determine the sources of sample loss and gain associated with sample introduction into a
typical gas chromatograph. Unknown concentration of one analyte can also be determined
based on the relative peak areas if cross sections of the analyte and the chosen internal
standard are known. Such approach removes any dependence on instrumental parameters and
accounts for systematic errors, as long as consistent settings are used to measure the peak
areas. Internal Standard-Based Pseudo-Absolute Quantitation was demonstrated in the work
by Zoccali et al. [55]. Error estimation was made for detected amounts based on comparison
with the original analyte concentrations. Owing to the influence of many factors that can
contribute to systematic error accumulation, authors concluded that additional work is
necessary for full delineation of error propagation.
To exploit the full potential of the GC-VUV for quantification purposes of coeluting
compounds, some work has been undertaken to develop spectral mixture estimation
algorithms based on the spectral libraries.
The first published example of such an algorithm for GC-VUV data is the ‘time interval
deconvolution’ (TID) algorithm. This ‘supervised’ approach is based on estimating a linear
combination of known spectra in the given time slices where known compounds coelute. For
factors for each compound/class of interest are necessary. Use of the automated approach to
TID was first demonstrated by Walsh et al. [25] for the purpose of bulk characterization of
gasoline samples (PIONA type analysis). For now the only commercial software that offers
automated decomposition is offered by VUV Analytics. Several research works have
demonstrated the power of the technique for spectral mixture estimation of coeluted species
even if there is no temporal resolution between them [13–15,21,53,56–58]. This methodology
was successfully applied in the ASTM D8071 standard test method for the quantification of
hydrocarbon classes in gasoline-range fuels (PIONA analysis) [59]. Similar standardization
work is under progress for kerosene fuels [60].
In the study by Schenk et al. [17] it was found that, under reasonable injection conditions, all
of the pairwise overlapping dimethylnaphthalenes isomers tested could be estimated up to
nearly two orders of magnitude in relative abundance (up to 99:1). For TID application,
important indicator was demonstrated to be the pair-wise sum of squared residuals (SSR)
between normalized reference spectra. For example, in [18] coeluting carbohydrate isomers
demonstrated low SSR values (0.25 and lower). In these cases, the relative abundance of
overlapping compounds that can be estimated is lower (50:1 relative abundance). Weston et
al. [61] in their study performed a comparison of the spectral profile of isotopically-labeled
compounds with their non-labeled equivalent. In the case of tested benzene isotopologues,
absorption spectra demonstrated small differences. However, increasing degree of deuteration
generally increased the difference between labeled and non-labeled counterparts. It was
concluded that sufficient spectra dissimilarity (e.g. SSR > 1 or higher) is needed for mixture
estimation of investigated species in a practical abundance range (>10:1). Work by Schenk et
compromised where coeluted peaks needed to be estimated compared to determinations from
fully resolved peaks. In this study, estimated on-column amounts of investigated
carbohydrates were compared with the amounts obtained after peak deconvolution. RSDs
obtained were higher than 50% in certain cases. In the work by Qiu et al. [56] an automated
time interval deconvolution (TID) procedure was applied to rapidly speciate individual PCBs,
as well as classify commercial Aroclor mixtures based on their degree of chlorination. Very
good results for with good specificity and sensitivity were obtained.
Spectral mixture estimation approaches are additionally limited by the lack of the reference
spectra which inhibits their application to more complex samples. Existing VUV spectral
library contains approx. 2000 reference spectra of mostly organic compounds. Compounds
can be segregated by class such as for example PIONA molecules. Spectra are mostly
acquired by analyzing standard compounds. Reference VUV spectra can also be extracted by
analyzing real samples and by performing spectral mixture decomposition [62].
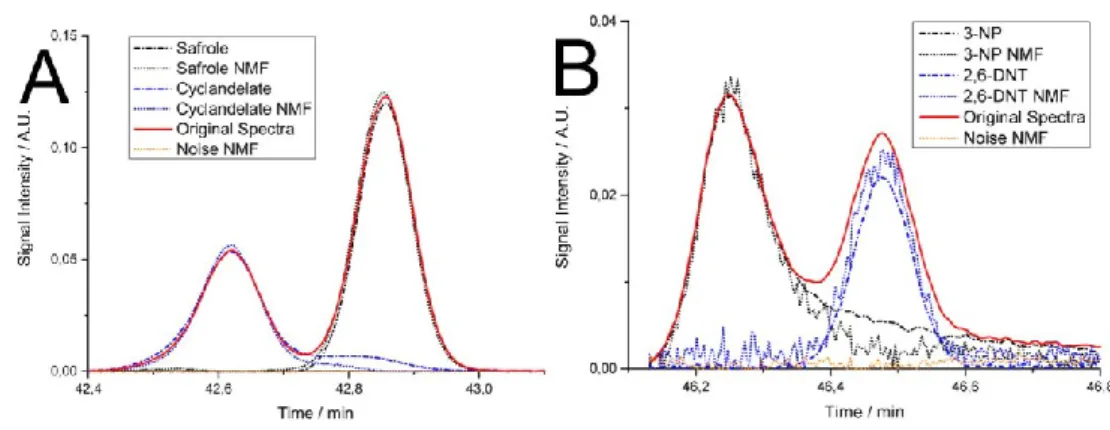
As an alternative to TID, Reiss et al. [20] recently presented an ‘unsupervised’ approach
allowing to perform spectral decomposition termed non-negative matrix factorization. This
approach in contrast to TID allows mixture estimation for compounds which are unknown
without pre-determined retention indices and a spectral library, hence it is suitable for
discovery-based analysis. The two approaches were compared and both exhibited good
alignment for the investigated compounds and good comparability with each other (Figure 6).
However, NMF drawbacks compared to the TID include inability to decompose the signal in
the case of similar signals (similar as TID) and the lack of separable maxima (only up to an
Pairwise mixtures of compounds present in the amounts down to 10:1 could have been
successfully estimated, compared with the 99:1 for TID as determined previously.
In terms of quantification performance, most cited disadvantages of the VUV detection are
limited dynamic linear range and limited sensitivity. LODs in the low ppm range or low ng
on column were reported for most compounds (see references from Table 1). Large-volume
injection was used to enable better detection limits in [53]. LODs can be artificially improved
by selecting appropriate spectral filters but also by applying lower acquisition frequencies. In
the latter case improved signal averaging results in a smoother baseline [58]. Mentioned
disadvantages can be also compensated by coupling VUV with a powerful quantitative
detector such as FID. Weatherly and co-workers [16] demonstrated that the additional
non-hyphenated FID analysis provides supplementary resolution to successfully discern classes of
cis and trans isomers of FA esters. VUV-FID direct hyphenation is completely feasible;
although rather in the parallel detection mode with a split rather than in series. The latter
requires installing a heated transfer line that would enable to transfer peaks from the VUV
cell towards the next detector in a way to avoid significant band broadening. In the case of
parallel dual VUV-FID detection, owing to pressure resistance introduced by the VUV heated
zones which causes the evolution of the GC flow during the run, possibility of analyte
discrimination (especially at higher flows) and influence on the FID quantification ought to
be investigated.
In several studies precision and accuracy of the employed GC-VUV method was investigated
Dunkle et al. [50] compared GC-VUV with GC×GC-FID and DHA for PIONA compounds
quantification. For all methods comparable RSD values were obtained. Tests involving five
injections a day during three days yielded RSDs better than 1.3%. PIONA results obtained
with GC-VUV were within 0.6% of the actual levels in the sample The largest deviations in
quantification were obtained with the DHA method, resulting from incurred misidentification
of olefins. Bai et al. [63] performed a comparison of GC×TOFMS, FID and
GC-VUV for the determination of diesel biomarker ratios in diesel fuels. Good agreement
between GC-FID and GC-VUV results was demonstrated. Measurements were performed in
triplicate yielding Pristane/C17 and Phytane/C18 ratios variability on the range of 10% for
both techniques. Precision better than 10% was obtained also by Qiu et al. [21] in the
analysis of terpene compounds. Pechancova et al. [19] compared GC-VUV with the
conventional GC-MS for the analysis of photoinitiators in food packages. Results
demonstrated that the relative difference between measured concentrations was not higher
than 18%. Spiking experiments in the study by Schenk et al. [64] have demonstrated good
recovery for formic acid in phenol-formaldehyde.
3.2.4. GC - Vacuum ultraviolet spectroscopy applications
This Section gives a brief summary of the up-to-date applications involving GC-VUV. The
focus is placed on reporting on the added benefits obtained by employing the VUV
technique. Overview of the main findings in terms of both VUV advantages and
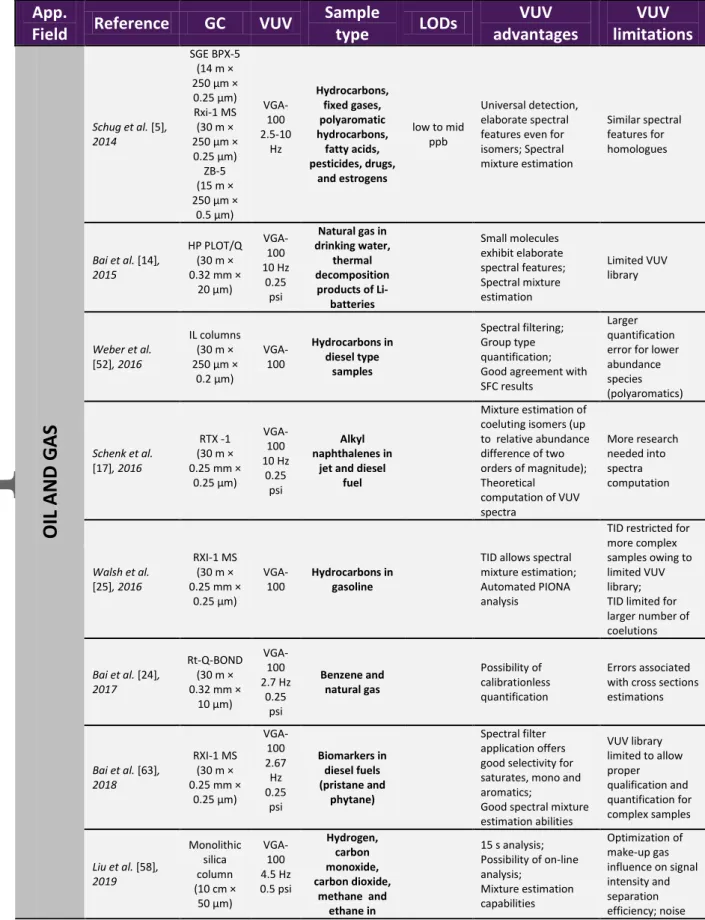
disadvantages ˗ is given in Table 1, along with details on the employed GC and VUV
It can be perceived that a wide variety of samples can be analyzed, with dominant interest
and more than one third of overall applications in the Oil and Gas sector. For the analysis of
real samples the main disadvantages of the VUV include its limited sensitivity, but also its
universal detection characteristics resulting in limited specificity in such complex matrices.
3.2.4.1. Oil and Gas
Features of the new VUV absorbance detector have proven to be particularly interesting for
liquid and gaseous fuels analysis. Possibility of the qualitative and quantitative
characterization of the wide variety of hydrocarbons, but also spectral mixture estimation
capabilities have enabled both group type and detailed analysis of fuel streams. First
elaboration of the potentials of the novel detection technique was provided in the research
paper by Schug et al. [5] where VUV capabilities for hydrocarbons characterization have
been demonstrated. Permanent gases analysis [14] has demonstrated that even small
molecules such as C1-C5 linear and branched hydrocarbons, water, oxygen, nitrogen,
methane, etc., all exhibit elaborate spectral features. Mixture estimation and spectral filtering
additionally aid in discerning the response of individual compounds. The use of the
automated approach based on TID to perform PIONA analysis of gasoline samples was first
demonstrated by Walsh et al. [25]. The ability to perform fast and simple group type analysis
of gasoline range hydrocarbons has led to the proposal of the D8071 ASTM method [59]. The
purpose of this method is to allow easy and fast analysis of the bulk concentrations of
hydrocarbon classes in gasoline (PIONA analysis). Application of this approach is however
limited to the gasoline range fuels. For heavier petroleum cuts, TID capabilities are not
Group-type separation for diesel samples including light gas oils by using GC-VUV was
demonstrated in the work by Weber et al. [52]. Highly polar ionic liquid stationary phases
were employed to achieve separation of the diesel constituents into saturates, mono, di, and
polyaromatics. Mass quantification of the three investigated families was performed.
Schenk et al. [17] interrogated capabilities of the GC-VUV for the analysis and mixtures
estimation of dimethylnaphthalenes (DMN) isomers in jet and diesel fuel samples. DMN
isomers are known to be challenging for the MS detection owing to significant coelution and
their similar mass spectra. They can also have similar polarities and boiling points, hence
finding a method able to provide differentiation between them, resolve mixture and facilitate
assignment is very challenging. In the study, it was found that, under reasonable injection
conditions, all of the pairwise overlapping isomers tested could be estimated up to nearly two
orders of magnitude in relative abundance (up to 99:1).
Bai and co-workers [63] performed a comparison of GC-VUV, GC-FID and GC×GC-MS
analysis for diesel fuel and weathered diesel fuel characterization. Common biomarkers
fingerprinting was performed for fuel age and source identification. GC-FID was sufficient to
define biomarker ratios, however not appropriate for more complex compositions owing to
incurred coelutions. GC-VUV allowed to classify numerous peaks into different families with
the aid of spectral filters and spectral mixture estimation. It was observed that weathering
process leads to the reduction in the amount of lighter hydrocarbons and greater abundance of
Liu and colleagues [58] recently evaluated the possibility of hyphenating short monolithic
silica capillary columns with VUV detection for online monitoring of mixtures of light
hydrocarbons. The set-up was modified by directly connecting the column to the VUV flow
cell (at room temperature). Mixture of methane, ethane, carbon monoxide and carbon dioxide
was chromatographically separated in 15 s.
Dunkle and coworkers [50] performed a study in which they compared GC-VUV with the
technique of DHA (detailed hydrocarbon analysis) and GC×GC-FID for the analysis of liquid
hydrocarbon streams. PIONA results comparison between the three techniques demonstrated
good agreement with good repeatability. Compared to DHA, GC-VUV demonstrated reduced
run time and less misidentification events (Figure 8). TID algorithm demonstrated good
spectral mixtures estimation capabilities with good accuracy.
3.2.4.2. Foods/Flavors/Fragrance/Oils
Another significant field of interest for GC-VUV application is food and aroma compounds
analysis.
Qiu and coworkers [21] employed GC-VUV for the investigation of 41 different standard
terpenes. They all exhibited highly featured and easily differentiated spectra and
Weatherly and co-workers [16] further studied the application of the VUV detection in
combination with GC separation for the analysis of fatty acid methyl esters (FAMEs). They
employed ionic liquid (IL) stationary phases in order to achieve improved resolution of
long-chain methyl and ethyl esters of omega-3, omega-6, and additional positional isomeric and
stereoisomeric blends of fatty acids. In addition to improved separation capability of the
chosen GC configuration, VUV analysis provided supplementary separation dimension
allowing to achieve characterization of the investigated species.
Fan et al. [13] similarly investigated capabilities of the VUV detection for FAMEs analysis.
VUV absorption spectra of 37 FAMEs, including saturated, monounsaturated, and
polyunsaturated types were recorded. Unsaturated FAMEs exhibited significantly different
gas phase absorption profiles compared to saturated ones, hence these classes could have
been easily distinguished. Isomer species, such as cis/trans FAMEs were also easily
differentiated. Multiple bond configurations of cis and trans isomers present together in the
same molecule have not been studied however.
Anthony and coworkers [8,54] demonstrated the advantages and technical considerations for
VUV-MS coupling in series, with a goal of achieving improved characterization of
structurally similar VOCs in perfume and essential oil samples. They demonstrated that
multidomain VUV-MS library search of data as opposed to single-domain library search
methods resulted in improved identification accuracy and confidence. Special metrics were
Pechancová et al. [19] performed a comparison of GC-MS and GC-VUV for the detection of
photoinitiators in food packages. Their findings witnessed the advantages of the VUV
detection for the discrimination of isomeric structures, such as methyl benzophenons which
are non-discernable by MS detection, however in comparison with the GC-MS procedure,
GC-VUV yielded worse detection limits.
García-Cicourel and Janssen [23] developed a fast GC-VUV method for the measurement of
the total level of aromatic hydrocarbons in purified mineral oils without prior separation of
aromatics and aliphatics. Mineral oil samples were investigated by GC-VUV but also
saturates and aromatic prefractionation was performed and analysis carried out with GC-FID.
Results obtained were compared and overall good agreement was obtained.
3.2.4.3. Life sciences
Schenk et al. [18] demonstrated the abilities of the VUV technique for qualitative and
quantitative determination of mono-, di, and tri-saccharides. GC-MS characterization of these
compounds is inhibited owing to their high structural complexity, chromatographic coelution
and ambiguous fragmentation patterns. VUV enabled efficient differentiation of isomeric
species such as ketopentoses and reducing versus non-reducing sugars.
In the doctoral dissertation by Muthal [65], GC-VUV was employed to detect
products. Glucocorticoids were detected with a good detection limit. The study also showed
the separation and detection of residual water in a solvent mixture after the solid phase
microextraction.
Santos et al. [53] employed GC-VUV for qualitative and quantitative determination of fatty
acids in blood plasma. TID was employed in order to aid in discerning responses of few
coeluting species. Large-volume injection enabled better detection limits. FAMEWAX
column was selected to obtain additional resolution for the positional isomers (C16:1 (n-7
and n-9) and C18:1 (n-7 and n-9)) for which VUV spectra exhibited high similarity.
Leghissa and colleagues [57] investigated applicability of the VUV for the detection of
cannabinoids and their metabolites. They found that the capabilities of spectral mixture
estimation aids to reduce requirements for chromatographic resolution, hence allow to
employ simpler separation procedure, faster temperature ramps, etc. without sacrificing
sensitivity. As in the previously mentioned work, LODs in the low ppm range were found.
Coeluting analytes were successfully discerned trough automated spectral mixture estimation
(TID).
Zheng and colleagues [66] employed VUV detection coupled with GC separation for the
screening of trace level water content and impurity profiling and stability investigation of
water sensitive 4-Ethoxy-1,1,1-trifluoro-3-buten-2-one (ETFBO) a starting material to
the VUV detector to interrogate peak purity based on VUV spectral library matching was
demonstrated.
Buchalter et al. [22] presented a study on the possibility of qualitative and quantitative
analysis of fentanyl analogues by the means of GC in combination with cold EI MS and
VUV, connected in parallel by employing a flow splitter. As in the previous studies,
discerning isomeric species by VUV was emphasized, but also good quantitative results were
obtained. LODs were in the range of high ng/ml for both detectors, however between two to
three times lower with VUV than the ones obtained by cold EI MS. Good sensitivity was
facilitated by employing a spectral filter encompassing a 175-205 nm range of wavelengths,
in which species containing aromatic functional groups demonstrate preferential absorption.
3.2.4.4. Forensic
Cruse and Goodpaster [67] evaluated GC-VUV for nitrate ester explosives analysis. Thermal
degradation of the interrogated species in the VUV cell was investigated. Mixtures of gas
phase products were detected and their relative amounts estimated by employing spectral
subtraction. Intact and burned real samples were also analyzed testifying the potential of the
Skultety et al. [12] applied GC-VUV for forty-three designer drugs analysis. Many of isomers
were easily differentiable by their VUV spectral features, spectral mixture estimation aided to
resolve incurred coelutions.
Reiss et al. [20] evaluated the ability of VUV spectroscopy for the analysis of drug and
explosive precursors as well as chemical warfare agent simulants. LODs obtained were in the
low ng range for all compounds. Good nitroaromatic isomers differentiation was observed.
Potential for forensic target compounds was evaluated using an artificially spiked gasoline
matrix.
Roberson and Goodpaster [68] recently employed GC-VUV for the analysis of
phenethylamines. Principal Component Analysis and Discriminant Analysis were employed.
Distinct groups with small variations between replicates were obtained despite similar
spectral features of the compounds. Differentiation of the stereosisomers ephedrine and
pseudoephedrine proved to be feasible through the application of chemometrics.
3.2.4.5. Environmental
In the study by Fan et al. [15] various pesticides species proved to be amenable to VUV
analysis. Within each class, different species displayed distinctive absorption spectra. The use
were not aromatic. Isomers exhibited distinctive spectra and could have been easily
differentiated by VUV analysis.
Qiu et al. [56] demonstrated the analysis of 209 polychlorinated biphenyl congeners. All of
the PCBs exhibited distinctive VUV spectra. Good detection limits were achieved.
Santos et al. [69] employed GC-VUV for the analysis of fatty acids methyl esters for bacterial
identification and discrimination based on their fatty acid profile. 12 different bacteria genera
and 15 species were successfully discerned. Principal component analysis (PCA) and cluster
analysis were conducted to visualize the data and examine the homogeneity of bacterial
species. Overall, saturated, branched, hydroxyl, cyclopropane and unsaturated fatty acids
were identified. Distinct fatty acid profiles were obtained for each investigated
microorganism.
In another work, Santos and coworkers [70] performed analysis of fatty acid and protein
profiles for the bacteria grown in the presence of contaminants characteristic for certain oil
and gas production processes, such as high salt levels, benzene, or alcohol. Obtained results
were deemed to be potentially useful as indicators of the ecological health. Successful
identification of bacterial FAMEs was achieved based on their absorbance spectra.
Schenk and co-workers [64] recently investigated the advantages of various approaches for
identification and quantitation of formaldehyde leachates from proppants. HS-GC-MS,
formaldehyde in its native form without derivatization, task nearly impossible with
conventional EI-MS owing to its degradation. However, coelution of formaldehyde with
water which was present in great abundance proved to be an obstacle for its detection even
with the VUV mixture estimation capabilities. HS-GC-MS was found to be best suited for the
investigated application.
3.2.4.6. Other
Diverse applications across multiple disciplines have also been a subject of interest including
the characterization of isotopologues [61] or the oxidation monitoring of polycyclic aromatic
hydrocarbons [27].
Shear-Laude [71] reported the quantitation of water by employing GC-VUV as a possible
alternative to widely employed Karl Fischer titration. In this study, a GC-VUV method
employing IL stationary phase was used to screen common solvents for their water content.
GC-VUV exhibited a dynamic linear range for water between 10 ppm and 10,000 ppm. For
the measurement of water in methanol accuracy and precision were both better than 3.0%.
Replicate measurements of residual water content showed good precision and low limits of
detection.
In general the main disadvantage cited for the VUV is the lack of sensitivity but also
be made in order to build the representative VUV library, to the extent where it can properly
support chemical assignment accuracy and confidence in the obtained result. Developing
hybrid detection techniques, which involve parallel or in series coupling of several detection
methods can offer a combination of advantages that cannot be attained by employing either of
the techniques individually. Additionally, more advanced separation methods coupled with
VUV detection can aid to fully exploit the potential of the technique.
Wider acceptance of the VUV technique in routine analysis is inhibited by the lack of
standardized regulatory methods, but also higher cost when compared to FID or quadrupole
MS. However, with the surge of standardized methods and further enrichment of the
reference library it is expected that the analytical use of the VUV will increase.
4. Vacuum ultraviolet spectroscopy coupling with comprehensive two-dimensional GC
4.1. Experimental
Multidimensional gas chromatography (MDGC) was introduced as a means of reaching
higher separation efficiency, necessary in the case of more complex samples analysis.
Comprehensive GC×GC, a type of MDGC, is characterized by a series of separations
resulting in the entire sample being subjected to the analysis process. This methodology has
signified a paradigm shift in the quality of chemical composition estimation and
many. Claimed 4-5 times increase in sensitivity [72] and an order of magnitude larger peak
capacity [73] compared to conventional 1D GC are the most cited benefits of the technique.
For a deeper insight on GC×GC, the reader can refer to numerous reviews of the GC×GC
technique [74–87].
Owing to the fast 2D separation which generates very narrow peaks (50-600 ms), the
detectors employed for GC×GC must be characterized by a short rise time, small dispersion
and high acquisition frequency (20-100 Hz). It is essential to collect sufficient number of data
points across each 2D peak for proper peak reconstruction, however oversampling ought to be
avoided due to the large size of data acquired and greater noise levels [88]. GC×GC detectors
should also have a wide dynamic range, and exhibit sensitivity and appropriate selectivity.
Detection systems which meet all of the above-mentioned criteria are for example single and
triple quadrupole, time of flight, and quadrupole time of flight detectors. Currently, MS
detection is most commonly applied across all GC×GC applications, however the use of MS
comes with a large laboratory footprint owing to challenging data analysis. Other than mass
spectrometry (MS), optical spectroscopic detectors are able to provide selective spectral
information. However, until present, the application of optical spectroscopy technologies as
universal detectors for GC×GC has been restricted mainly due to physical limitations such as
insufficient acquisition speed (AED is for example limited to 10 Hz [89]) or high detection
limits owing to small molecular absorption cross sections in the detection wavelength range
[40]. Many of the limitations have been circumvented in the newly developed VUV detection
system. The acquisition frequency can be up to ~90 Hz. Additionally, VUV-spectral data
could be assumed to be orthogonal to typical GC-separation whereas some mass
the molecular mass, one of the most selective information in GC×GC/MS, is highly related
(non-orthogonal) to the elution order of the corresponding compound and becomes obvious
for soft ionization techniques like photoionization [40]. If the information provided by the
detection system is different from those that dictate the separation itself, in this case
substantial complementary knowledge on sample features can be obtained. Further, the high
peak capacity of the comprehensive separation systems along with the capabilities for
mixture estimation of the VUV spectral signatures effectively increase the total number of
species whose presence can be efficiently resolved [55].
Most important considerations regarding the use of the VUV detector in hyphenation with the
GC×GC separation are related to the make-up gas pressure tuning. In GC×GC, it is especially
important to keep analyte diffusion in the VUV flow cell to minimum. As mentioned above,
second dimension baseline peak widths in GC×GC are 50 to 600 ms, hence using a detector
with small internal volume is critical. In the VUV spectrometer, make-up gas tuning can be
employed to decrease the residence time of the analyte in the volume of the flow cell. Gruber
et al. [48] found in their study, that in VGA-100 which featured larger volume of the flow
cell ( 80 µl) elevated make-up gas pressures of 1.5 psig and higher are necessary to maintain
the peaks width < 600 ms for two-dimensional separation of breath gas metabolites. Second
generation VUV spectrometer having lower volume of the flow cell does not require marked
increase of the make-up gas pressure, hence sensitivity gain is incurred. High flows applied in
the second dimension of the flow modulated GC×GC seem not to be an obstacle for efficient
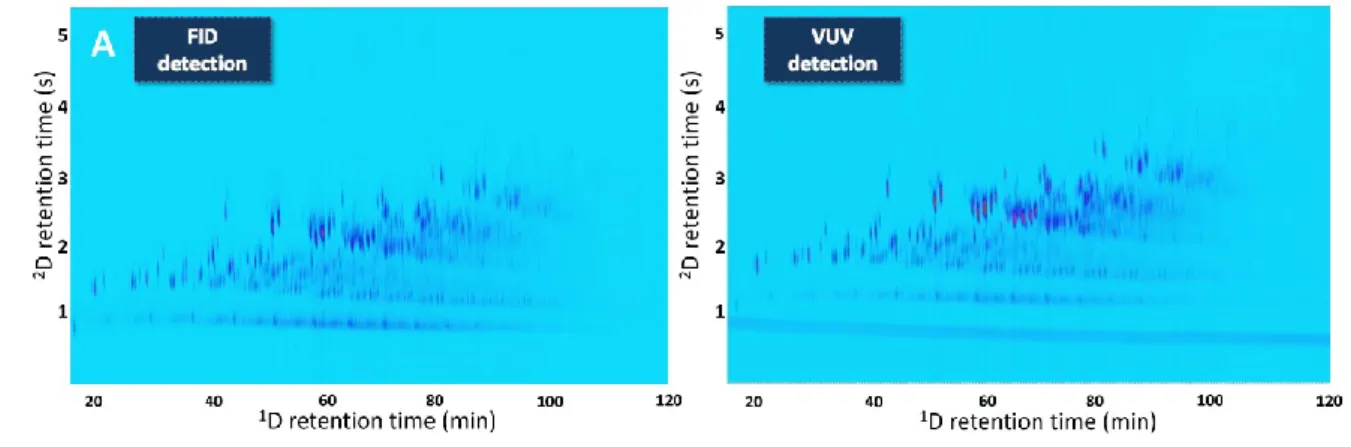
As mentioned before, VUV is amenable to hyphenation to other detector types. Our studies
and in-house obtained GC×GC-VUV chromatograms (Figure 9) have demonstrated very
good results regarding the dual VUV-FID detection in the simple split mode for the flow
modulated GC×GC. 2D baseline peak widths in the range up to 500 ms were obtained for
both detection techniques. FID ability of quantitation of organic compounds combined with
the qualitative information that VUV enables good insight into the global composition of
petroleum samples.
4.2. Data processing and analysis
Processing of the GC×GC-VUV data is specific to GC×GC applications. It generally begins
with integrating an interval of a spectral band. This operation is called ‘spectral filtering’.
Further processing procedure can be reduced in a rather classic way to the following
sequence of steps: baseline correction, detection of peaks corresponding to compounds of
interest, and peaks integration [37,90]. In terms of baseline correction, there are several
approaches in the literature that offer satisfactory solutions. We can cite, for instance,
approaches by robust optimization of a parametric curve model that is forced to remain below
the data [91], or morphological approach where the baseline is replaced more generally by a
set of segments of various lengths [92]. These approaches are generally defined for curves,
however the extension to 2D data is rather trivial, since data can be considered as a collection
Once the baseline has been corrected, a common way to quantify the data is to detect peak
locations and then use integration areas defined by a mask that has been correctly aligned
[37]. Detection of peaks of interest can be a difficult task. Approaches based on derivative
calculation generally fail in the presence of low noise or coelutions. Local maxima detection,
extremely well performing in image processing, gives a good answer for both 1D [92] and 2D
data [93]. Before mask integration, mask alignment can be done using amer points and
parametric deformation model defined for specific isolated compounds, or in a fully
automatic way by a robust optimization and distance minimization [93]. Although robust,
these calibration approaches are generally only effective in targeted cases, and it may be
difficult to fully trust this type of approach in completely unknown cases. It is interesting to
explore approaches without prior definition of a mask, simply with information on the
positions of peaks of interest. The integration should automatically adapt to the morphology
of the peaks present in the data, while respecting certain constraints (convexity, strict
decrease from the apex). Here again, image processing could inspire some solutions
particularly through developed segmentation algorithms, such as in reference [94] or in [83]
which employs watershed. All these kind of tools that are available for classical GC×GC data
still need to be developed for GC×GC-VUV data and adapted to the fact that the detector
brings an additional dimension for separation.
Concerning softwares for processing and analysis of GC×GC-VUV data, previous studies
mainly rely on homemade Matlab software [40,48], GC Image [95] and ChromSquare [55].
GC Image is the only commercial software supporting direct import of the GC×GC-VUV
data for two-dimensional visualization. For now, GC Image does not support functionalities
introduced, free open-access plug im! software [96], proposes 3D visualization, spectral
profile extraction, and spectral filtering for GC×GC-VUV data. Additional functionalities
such as noise filtering, baseline correction and signal integration are currently under study. A
real perspective could be the possibility to directly visualize the initial GC×GC-VUV 3D
data. A first approach would be to focus on transposing quite directly baseline-correction and
peak detection algorithms presented previously, and then to define 3D integration masks by
non-connected sets, or defining 3D integration without prior mask. A second way would be to
explore at each GC×GC 2D point mixture estimation in the VUV spectra, using reference
spectra for each compound of interest. The problem then would become extremely complex
to write and optimize, and machine learning, initially to accelerate convergence, would
certainly be beneficial.
To conclude, there is clearly a need for adequate software with user friendly interface to
manipulate such 3D complex data resulting from combining spectroscopy and
chromatography, but also for advanced algorithms for baseline estimation, peak detections
and quantitative integration.
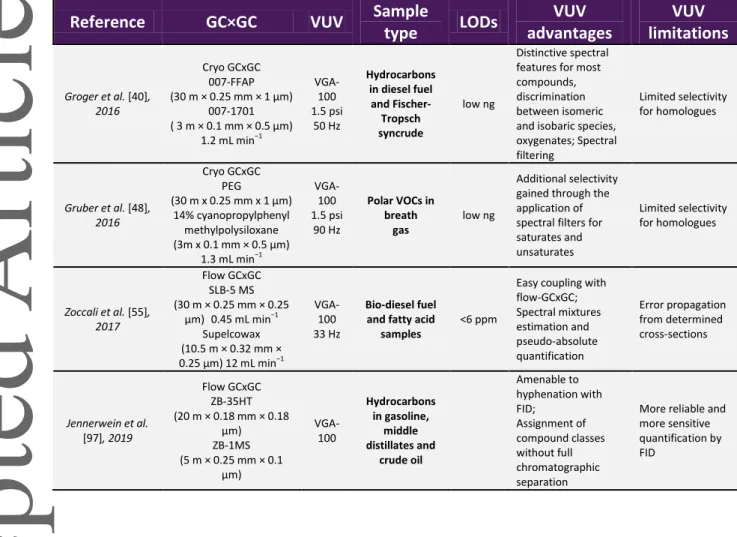
4.3. Comprehensive two-dimensional GC - Vacuum ultraviolet spectroscopy early applications
First proof of concept study involved the VUV detection in combination with cryo-modulated
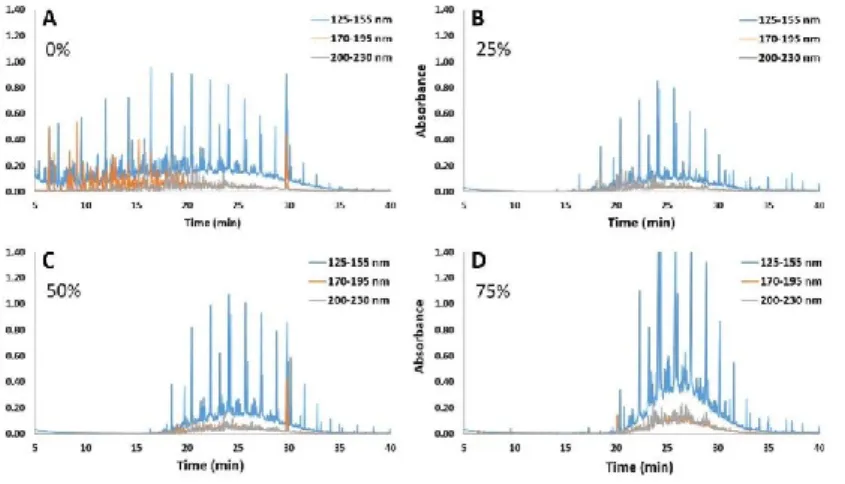
GC×GC and was performed by Gröger and co-workers [40]. In this work, potential of the
been explored. Peak widths at mid-height in the range of 300 ms and LODs in low ng range
were obtained. Spectral filters were employed to selectively detect specific families of
compounds. 170-200 nm wavelength region was used to “filter out” compounds with
aromatic π→π* chromophores (Figure 10). Since isolated double bonds do not occur in fully
processed and standardized middle distillate diesel (without FAMEs), the authors were able
to assign the π→ π* transitions exclusively to the conjugated double bonds of aromatic
structures. This can aid in often problematic differentiation between cyclic naphthenes and
olefins in GC×GC separation of petroleum products. Authors found that the absorbance
properties in the aromatics region 170-200 nm could also indicate the presence or absence of
compounds containing oxygen.
The same group further investigated the ability of the cryo GC×GC-VUV to discriminate
between isomeric compounds or isobaric species in hydrocarbon fuel and breath gas samples
[48]. As in the previous study, they have shown that additional selectivity could be gained
through the application of appropriate spectral filters. Especially small oxygenated breath
metabolites demonstrated intense and characteristic absorption patterns. In the case of short
chain fatty acids spectral features were demonstrated to become more distinct with decreased
chain length and were dominated by high-energy σ→σ* transitions. Results of the analysis
were in agreement with GC×GC-TOFMS findings demonstrating the potential of the
technique.
Zoccali and co-workers [55] employed in their study for the first time flow modulated
(based on the pseudo-absolute quantification method) of investigated samples were
evaluated. Peaks with good shape and 600 ms width at the base were obtained.
Chromatographic separation was satisfactory with the saturated, mono-aromatic, di-aromatic
and tri-aromatic hydrocarbons well separated from each other, and from the FAMEs. Internal
Standard-based Pseudo-absolute quantification of target analytes was performed by using the
pre-recorded absorption cross-sections
Jennerwein et al. [97] recently demonstrated that combined capabilities of VUV and FID
detection can provide for improved characterization of gasoline and middle distillates,
especially olefins and diolefins. They pointed out the lack of software solutions for adequate
treatment of the tridimensional GC×GC-VUV data.
Early studies have demonstrated that VUV detector is completely amenable to coupling with
GC×GC in both cryo and flow modes and that its versatility and advantages which were
observed trough GC-VUV applications can be exploited also in the comprehensive
separations. Table 2 provides an overview of the current published works involving
GC×GC-VUV.
5. Conclusion
Informative broad band detection technology in the low end-UV range of the electromagnetic
spectrum, which recently became commercially available, has allowed to access a domain of
applications involving GC-VUV but also arising of standardized methods testify the benefits
of the provided information.
Spectral information provided is very featured for most of the species (even for small
molecules and isomers), but also similar between the compounds belonging to the same
family allowing spectral filtering tools to highlight specific chemical classes. Hence, target
analysis but also group type analysis is a possibility. Classical requirements for
chromatographic resolution can be decreased by the possibility to computationally discern
spectral signatures of the species for which there is no temporal resolution through the
application of automated mixture estimation algorithms. Applying the spectral mixture
estimation approaches can enable fast and automated analysis, however the lack of the VUV
absorption reference spectral libraries impedes broadening of the field of application for more
complex samples, such as automated PIONA for heavier petroleum fractions. With the
eminent advances in computation approaches, calculation of the theoretical spectra for
compounds whose VUV absorption signatures are not currently available may bring
additional power to the technique and eliminate the limitations imposed by the scarcity of
reference spectral information in the low end-UV spectral range. From a quantitative point of
view, detection limits up to a few ppm make the VUV amenable to a wide range of analytical
challenges.
Finally, for the analysis of very complex mixtures of volatile and semi-volatile compounds,
combination of GC×GC and VUV detection has been proven to be highly informative. Since
quantitative analytical techniques. Along with the experimental improvements, advances in
data analysis, chemometrics, signal processing and machine learning to treat the complex
multidimensional data must also be highlighted as necessary in order to reach the full
References
[1] Watson, N. E., Bahaghighat, H. D., Cui, K., Synovec, R. E., Comprehensive
Three-Dimensional Gas Chromatography with Time-of-Flight Mass Spectrometry. Anal.
Chem. 2017, 89, 1793–1800.
[2] Santos, I. C., Schug, K. A., Recent advances and applications of gas chromatography
vacuum ultraviolet spectroscopy. J. Sep. Sci. 2017, 40, 138–151.
[3] Internal Standard ISO 21348, Space Environment (Natural and Artificial) — Process
for Determining Solar Irradiances. 2007.
[4] Skoog, D. A., Holler, F. J., Crouch, S. R., Principles of Instrumental Analysis. Brooks
Cole 2006.
[5] Schug, K. A., Sawicki, I., Carlton, D. D., Fan, H., McNair, H. M., Nimmo, J. P., Kroll,
P., Smuts, J., Walsh, P., Harrison, D., Vacuum ultraviolet detector for gas
chromatography. Anal. Chem. 2014, 86, 8329–8335.
[6] Hanley, L., Zimmermann, R., Light and molecular ions: The emergence of vacuum
UV single-photon ionization in MS. Anal. Chem. 2009, 81, 4174–4182.
[7] Li, D. X., Gan, L., Bronja, A., Schmitz, O. J., Gas chromatography coupled to
atmospheric pressure ionization mass spectrometry (GC-API-MS): Review. Anal.
Chim. Acta 2015, 891, 43–61.
[8] Anthony, I. G. M., Brantley, M. R., Gaw, C. A., Floyd, A. R., Solouki, T., Vacuum
![Fig. 1 Absorption spectrum of water from IR to low-UV region. Reprinted with permission from [10] Copyright (2015) Springer Nature](https://thumb-eu.123doks.com/thumbv2/123doknet/11319381.282648/57.892.120.536.218.501/absorption-spectrum-region-reprinted-permission-copyright-springer-nature.webp)
![n M n M n n [0 , 1] [0 , 1] | U − V | 1 / 3 1 / 18 | U − V | { ( u,v ) ∈ [0 , 1] × [0 , 1] / | u − v |≤ x } x [0 , 1] ( U,V ) [0 , 1] × [0 , 1] n =100 p =0 . 001 p n](data:image/gif;base64,R0lGODlhAQABAIAAAP///wAAACH5BAEAAAAALAAAAAABAAEAAAICRAEAOw==)