MÉMOIRE PRÉSENTÉ À
L’UNIVERSITÉ DU QUÉBEC À CHICOUTIMI COMME EXIGENCE PARTIELLE DE LA MAÎTRISE EN INGÉNIERIE
PAR HANG SUN
MÉTHODE DE DÉTECTION DES IMPURETES MÉTALLIQUES (V, Ni, Fe) DANS LE COKE ET LES ANODES EN CARBONE ET LEUR EFFET SUR LA
RÉACTIVITÉ DE L'ANODE
A THESIS SUBMITTED TO
THE UNIVERSITY OF QUÉBEC AT CHICOUTIMI IN PARTIAL FULFILMENT OF THE REQUIREMENTS
FOR THE DEGREE OF MASTERS IN ENGINEERING
BY HANG SUN
A DETECTION METHOD OF METALLIC IMPURITIES (V, Ni, Fe) IN COKE AND CARBON ANODES AND THEIR EFFECT ON ANODE REACTIVITY
Abstract
Primary aluminum is produced by the electrolysis of alumina in the Hall-Héroult process. The anodes are the source of carbon required for the reduction process. They are made of calcined petroleum coke, butts, recycled anodes, and coal tar pitch. Carbon anodes constitute an important part of the aluminum production cost. During the production of aluminum, carbon anodes are consumed and CO2 is produced. CO2 further reacts with the anode carbon to produce CO. Air also reacts with the exposed anode surface to produce CO2. These reactions increase anode consumption and add to the cost of aluminum production. One of the key industrial goals is to minimize this excess consumption of anodes. The quality of prebaked carbon anodes, consumed in electrolysis during the primary aluminum production, has an important impact on the cell performance. The anode quality depends on the raw material quality and operating conditions in the anode plant. The most common metallic impurities found in cokes and anodes in aluminum industry are vanadium (V), nickel (Ni), and iron (Fe). The properties of the anode are influenced by these impurities. It is reported that they enhance the actual carbon consumption by catalyzing the air and CO2 reactivities in the electrolytic bath.
There are different standard methods to quantify the impurities. The American Society for Testing and Materials (ASTM) developed different test methods using Inductively Coupled Plasma Atomic Emission Spectrometry (ICP-AES), Atomic Absorption Spectrometry (AAS), and X-ray Fluorescence Spectroscopy (XRF). These standard methods require intensive sample preparation, highly skilled personnel, and costly reagents. The methods are usually time-consuming. Thus, a simple but effective tool is
necessary to estimate the level of different impurities in the raw materials and the anode. In this study, colorimetric methods were developed to determine the levels of impurities (Fe, V, Ni) in cokes and anodes. In this method, the metallic impurities were extracted from the carbon sample by acids and/or electrophoresis. A certain amount of the extract was treated with reagents that can form specific color with a particular impurity. The color was analyzed using a custom-made image analysis software. The value of a particular component of the color was plotted against known concentrations of the impurities to prepare a calibration curve. The calibration curve was later used to estimate the concentration of impurity (Fe, V, Ni) in different samples with unknown concentrations. The colorimetric reagents used for the estimation of iron, vanadium, and nickel were potassium thiocyanate, N-benzoyl-N-phenylhydroxylamine, and dimethylglyoxime, respectively. It is possible to estimate the Fe, V, and Ni content in a carbon sample precisely with developed colorimetric methods in less than 30 minutes including sample preparation. In these methods, no costly ultrapure reagent was used, which reduced the cost of analysis.
Anodes were fabricated using known amounts of impurities (Fe, V, Ni). The density, electrical resistivity, and air and CO2 reactivities of the anode samples were measured. The effect of the above impurities on the air and CO2 reactivities were studied. It was observed that the impurities can catalyze the reactivities of the anode depending on the relative amount of other impurities. An artificial neural network method, which was previously developed by the carbon group, was trained using the experimental data; and the effect of the impurities on the reactivities was also analyzed. This study was carried out
within the framework of the University of Quebec at Chicoutimi (UQAC) and Aluminerie Alouette Inc. (AAI) Research Chair on the Utilization of Carbon in Primary Aluminum Industry (UQAC/AAI Research Chair on Carbon).
Résumé
L'aluminium primaire est produit par l'électrolyse de l'alumine en utilisant le procédé Hall-Héroult. Les anodes sont la source de carbone nécessaire pour le procédé de réduction. Elles sont faites du coke de pétrole calciné, des mégots, des anodes recyclées et du brai de goudron de houille. Les anodes de carbone constituent une partie importante du coût de production de l'aluminium. Lors de la production d'aluminium, les anodes de carbone sont consommées en produisant du CO2. Le CO2 réagit avec le carbone de l'anode et produit du CO. L'air réagit également avec la surface exposée de l'anode et produit aussi du CO2. Ces réactions augmentent la consommation de l'anode et le coût de production de l'aluminium. L'un des objectifs principaux de l’industrie est de minimiser cette consommation excessive d'anodes. La qualité des anodes de carbone précuites, consommées en électrolyse lors de la production d'aluminium primaire, a un impact important sur la performance de la cellule d’électrolyse. La qualité de l'anode dépend de la qualité de la matière première et des conditions d’opération dans l'usine d'anodes. Les impuretés métalliques présentes habituellement dans les cokes et les anodes dans l'industrie de l'aluminium sont le vanadium (V), le nickel (Ni) et le fer (Fe). Les propriétés de l'anode sont influencées par ces impuretés. Selon la littérature, elles augmentent la consommation de carbone réelle en catalysant les réactivités à l'air et au CO2 durant l’électrolyse.
Il existe différentes méthodes standards pour quantifier les impuretés. The American Society for Testing and Materials (ASTM) a mis au point différentes méthodes standards qui requit l’utilisation de la spectrométrie d'émission atomique couplée par plasma inductif (ICP-AES), de la spectrométrie d'absorption atomique (AAS) et de la spectroscopie de
fluorescence X (XRF). Ces méthodes standards nécessitent une préparation intensive des échantillons, un personnel hautement qualifié et des produits chimiques coûteux. Les méthodes prennent généralement beaucoup de temps. Ainsi, un outil simple, mais efficace est nécessaire pour estimer le niveau des différentes impuretés dans les matières premières et l'anode. Lors de cette étude, des méthodes colorimétriques ont été développées pour déterminer la teneur d'impuretés (Fe, V, Ni) dans les cokes et les anodes. Selon cette méthode, les impuretés métalliques ont été extraites de l'échantillon de carbone par des acides et/ou de l’électrophorèse. Une certaine quantité de l'extrait a été traitée avec des réactifs qui peuvent former une couleur spécifique avec une impureté particulière. La couleur a été analysée en utilisant un logiciel d’analyse d’image développé par le groupe de carbone à l’UQAC. La valeur d'un composant particulier de la couleur a été tracée en fonction des concentrations connues des impuretés pour préparer une courbe d'étalonnage. La courbe d'étalonnage a ensuite été utilisée pour estimer la concentration d'impureté (Fe, V, Ni) dans les différents échantillons pour lesquels les concentrations étaient inconnues. Les réactifs colorimétriques utilisés pour l'estimation du fer, du vanadium et du nickel étaient respectivement le thiocyanate de potassium, la N-benzoyl-N-phénylhydroxylamine et la diméthylglyoxime. Il est possible d'estimer précisément la teneur en Fe, V et Ni dans un échantillon de carbone en moins de 30 minutes avec les méthodes colorimétriques développées, y compris la préparation des échantillons. Aucun réactif ultra-pur coûteux n'a été utilisé, ce qui a réduit le coût de l'analyse.
Des anodes ont été fabriquées en utilisant des quantités connues d'impuretés (Fe, V, Ni). La densité, la résistivité électrique et les réactivités à l'air et au CO2 des échantillons
d'anode ont été mesurées. L'effet de ces impuretés sur les réactivités à l'air et au CO2 a été étudié. Il a été observé que les impuretés peuvent catalyser les réactivités de l'anode en fonction de la quantité relative par rapport à d'autres impuretés. Un modèle basé sur le réseau de neurones artificiels (RNA), précédemment développé par le groupe de carbone, a été entrainé en utilisant les données expérimentales. Par après, l'effet des impuretés sur les réactivités a été analysé. Cette étude a été réalisée dans le cadre de la Chaire de recherche Université du Québec à Chicoutimi (UQAC) et Aluminerie Alouette Inc. (AAI) sur l’utilisation du carbone dans l’industrie d’aluminium (Chaire de recherche UQAC/AAI sur le carbone).
Acknowledgements
I would like to express my deep and sincere gratitude to my director, Prof. Duygu Kocaefe, not only for giving me the opportunity to do this research as her student, but also for her patience, continuous encouragement, her availability for discussions and suggestions, as well as giving me the opportunity to attend conferences. I have been extremely lucky to have a director who cared so much about my work and who responded to my questions so promptly.
I would like to declare my sincere appreciation for my co-director, Prof. Dipankar Bhattacharyay, for his guidance, kindness, patience, guidance, encouragement, and advice.
I must express my gratitude to Prof. Yasar Kocaefe for sparing his valuable time in clarifying my doubts during my project work. His guidance, assistance and suggestions helped me during the time of my research and writing this thesis.
I would like to extend my sincere gratitude to Dr. Xian-ai Huang for her availability, collaboration and technical assistance in the laboratory.
I would like to thank Aluminerie Alouette Inc. for the technical and financial support, as well as the Natural Sciences and Engineering Research Council of Canada (NSERC), Développement économique Sept-Îles, the University of Quebec at Chicoutimi (UQAC), and the Foundation of the University of Quebec at Chicoutimi (FUQAC) for the financial support. Special thanks to Ms. Brigitte Morais of Aluminerie Alouette Inc. for her encouragement, valuable discussions, and comments.
I would like to thank all the technicians of the UQAC/AAI Research Chair on the Utilization of Carbon for Primary Aluminum Industry and CURAL (Centre universitaire de
recherche sur l’aluminium) for their help and support. Special thanks are due to Mr. Dave Girard and Mr. Alexandre Morin who assisted me during all the stages of my experiments and also helped me prepare the experimental set-up and to the laboratory personnel for their substantial assistance in the experimental work.
Many thanks are also due to all my friends and colleagues for their kind support, help, and suggestions during this project.
Table of Contents
Abstract... i
Résumé ... iv
Acknowledgements ... vii
Table of Contents ... ix
List of Figures... xii
List of Tables ... xiv
List of symbols and abbreviations ... xv
CHAPTER 1 INTRODUCTION ... 1
1.1 Background ... 1
1.2 Statement of the problem ... 4
1.3 Objectives... 5
1.4 Methodology ... 5
1.5 Scope ... 6
CHAPTER 2 LITERATURE REVIEW ... 8
2.1 The carbon anode ... 8
2.2 Anode raw materials ... 9
2.2.1 Coke ... 9
2.2.2 Butts ... 9
2.2.3 Recycled anodes ... 9
2.2.4 Pitch ... 10
2.3 Impurities in coke and anode ... 10
2.4 Different methods to estimate Fe, Ni, and V ... 11
2.4.1 Inductively Coupled Plasma Spectrometry ... 11
2.4.2 X-ray Fluorescence Spectroscopy (XRF) ... 12
2.4.3 Colorimetric determination of Fe, Ni, and V ... 12
2.5 Anode properties ... 19
2.5.2 Electrical resistivity ... 20
2.5.3 CO2/air reactivity ... 20
2.6 The influence of impurities on CO2 and air reactivities ... 23
2.7 Artificial network analysis (ANN) ... 27
CHAPTER 3 EXPERIMENTAL SET-UP AND TEST PROCEDURES ... 29
3.1 Materials used ... 30
3.2 Colorimetric reactions ... 31
3.3 Equipment used ... 32
3.3.1 Datacolor Check II ... 32
3.3.2 Custom set-up using a webcam ... 34
3.3.3 Electrophoresis set-up ... 35
3.3.4 Thermogravimetric analyzer for reactivity measurements ... 35
3.4 Development of calorimetric methods ... 35
3.4.1 Development of colorimetric methods for the estimation of Fe, Ni, and V in anode samples ... 35
3.4.2 Study of the effect of impurities on the reactivities of anodes ... 39
3.4.3 Artificial Neural Network modelling ... 43
CHAPTER 4 RESULTS AND DISCUSSIONS ... 45
4.1 Development of colorimetric methods for the estimation of Fe, Ni, and V in anode samples ... 45
4.1.1 Identification of conditions for the reaction between the impurity and the reagent using Datacolor ... 45
4.1.2 Measurement of change in color components using the custom-made set-up with the webcam ... 47
4.2 Study of the effect of impurity content on anode reactivities ... 60
4.2.1 Characterization of the green anodes ... 60
4.2.2 Characterization of cylindrical anode samples used for reactivity studies ... 61
4.2.3 Reactivities of different anode samples ... 62
4.2.4 Effect of different impurities on anode reactivities ... 67
4.3.1 The effect of iron (Fe) concentration on air and CO2 reactivities (V, Ni, and S
maintained at their typical levels) ... 72
4.3.2 The effect of vanadium (V) concentration on air and CO2 reactivities (Fe, Ni, and S were maintained at their typical levels) ... 74
4.3.3 The effect of nickel (Ni) concentration on air and CO2 reactivities (Fe, V, and S were maintained at their typical levels) ... 76
4.3.4 The effect of sulfur (S) concentration on air and CO2 reactivities (Fe, V, and Ni were maintained at their typical levels) ... 78
4.3.5 Remarks ... 80
CHAPTER 5 CONCLUSIONS AND RECOMMENDATIONS... 81
5.1 Conclusions ... 81
5.2 Recommendations ... 82
REFERENCES ... 84
List of Figures
Figure 2.1. A schematic view of an electrolysis cell with a prebaked anode [1] ... 8
Figure 2.2. (a) Anode temperature distribution and reactivities in a reduction cell [1, 16], (b) Dust formation during the reaction of air/CO2 with anode [53]. ... 23
Figure 2.3. (a) CO2 and (b) air reactivities of coke as a function of nickel and sulfur contents [5] ... 24
Figure 2.4. CO2 reactivity of coke as a function of vanadium and sulfur contents [5]. ... 26
Figure 3.1. Summary of the methodology ... 30
Figure 3.2. Datacolor CheckII ... 33
Figure 3.3. CIELab color system ... 33
Figure 3.4. Custom set-up using a webcam ... 34
Figure 3.5. (a) Core positions in laboratory anodes, (b) Position of samples used for the reactivity tests in anode cores. ... 42
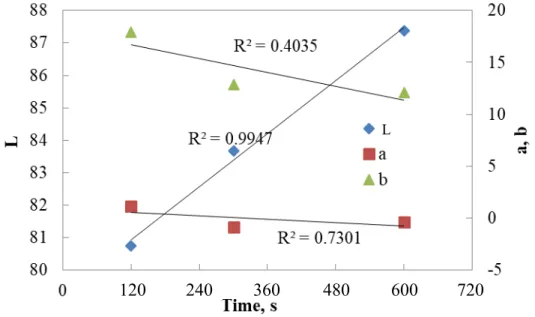
Figure 4.1. Color components measured with Datacolor during the reaction of 500 ppm pure iron with potassium thiocyanate ... 46
Figure 4.2. Change in “L” with respect to iron concentration at 300 s ... 47
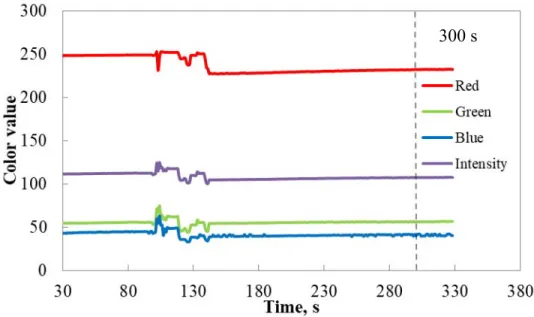
Figure 4.3. Change in color components with respect to time for 500 ppm pure iron solution ... 48
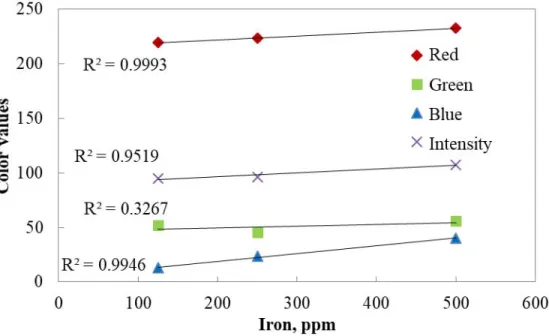
Figure 4.4. Change in color components with respect to concentration of iron solution at 300 s ... 49
Figure 4.5. Colorimetric determination of Fe in anode sample ... 50
Figure 4.6. Calibration curve for iron concentration measurement determined by the colorimetric method (using electrophoresis and image analysis)……….51
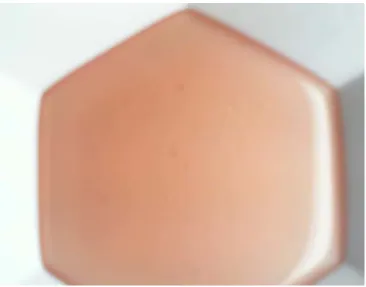
Figure 4.7. Color produced by the reaction of iron with potassium thiocyanate. ... 52
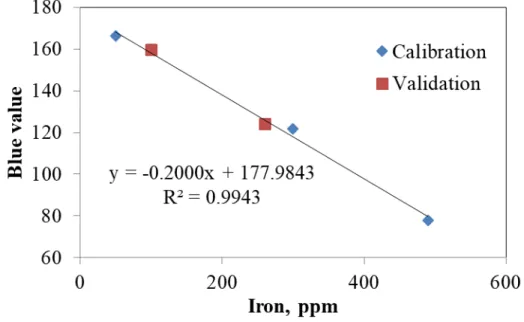
Figure 4.8. Calibration curve for iron concentration measurement determined by the colorimetric method (using aqua regia and image analysis) and its validation ... 53
Figure 4.9. Color produced by the reaction of vanadium with N-benzoyl-N-phenylhydroxylamine ... 55
Figure 4.10. Calibration curve for vanadium concentration measurement determined using the colorimetric method (aqua regia and image analysis) and its validation ... 56
Figure 4.11. Color produced by the reaction of nickel with dimethylglyoxime. ... 57
Figure 4.12. Calibration curve for nickel concentration measurement determined using the colorimetric method (aqua regia, electrophoresis, and image analysis) and its validation .. 58
Figure 4.13. Effect of BAD on CO2 reactivity ... 64 Figure 4.14. Effect of BAD on air reactivity ... 66
Figure 4.15. CO2 and air reactivities of anode samples containing different concentrations of iron ... 68
Figure 4.16. CO2 and air reactivities of anode samples containing different concentrations of vanadium ... 69
Figure 4.17. CO2 and air reactivities of anode samples containing different concentrations of nickel ... 70
Figure 4.18. The effect of iron concentration on air reactivity with different BADs (V, Ni and S were maintained at their typical levels) ... 73
Figure 4.19. The effect of iron concentration on CO2 reactivity for different BAD (V, Ni, and S were maintained at their typical levels) ... 74
Figure 4.20. The effect of vanadium concentration on air reactivity for different BAD (Fe, Ni, and S were maintained at their typical levels) ... 75
Figure 4.21. The effect of vanadium concentration on CO2 reactivity for different BAD (Fe, Ni, and S were maintained at their typical levels) ... 76
Figure 4.22. The effect of nickel concentration on air reactivity for different BAD (Fe, V, and S were maintained at their typical levels) ... 77
Figure 4.23. The effect of nickel concentration on CO2 reactivity for different BAD (Fe, V, and S were maintained at their typical levels) ... 78
Figure 4.24. The effect of sulfur concentration on air reactivity for different BAD (Fe, V and Ni were maintained at their typical levels) ... 79
Figure 4.25. The effect of sulfur concentration on CO2 reactivity for different BAD (Fe, V and Ni were maintained at their typical levels) ... 80
List of Tables
Table 2.1. Anode impurities [1] ... 11
Table 3.1. Samples used for calibration ... 38
Table 3.2. Samples used for validation ... 38
Table 3.3. Percentages of impurities in the six cokes (small size fraction) measured by XRF ... 39
Table 3.4. Addition of impurities in the ten anodes produced with Coke (6) ... 40
Table 4.1. Comparison of results obtained by XRF and colorimetry for iron ... 53
Table 4.2. Analysis of coke and anode samples ... 54
Table 4.3. Comparison of results obtained by XRF and colorimetry for vanadium ... 56
Table 4.4. Analysis of coke and anode samples ... 57
Table 4.5. Comparison of results obtained by XRF and colorimetry for nickel ... 59
Table 4.6. Analysis of coke and anode samples ... 59
Table 4.7. Properties of green anodes: (a) anodes produced with different cokes, (b) anodes produced with Coke (6) with addition of impurities ... 60
Table 4.8. Green and baked density of cylindrical samples (φ50 x 130 mm) taken from the anodes ... 62
Table 4.9. CO2 reactivity results of anode samples (φ50 x 50 mm sample cut from Core 1) ... 63
Table 4.10. Air reactivity results of anode samples (φ50 x 50 mm sample cut from Core 3) ... 65
List of symbols and abbreviations
V Volume (cm3)
I Current (A)
D Density (g/cm3)
GAD Green anode density (g/cm3) BAD Baked anode density (g/cm3)
GER Electrical resistivity of green anode (µΩm) BER Electrical resistivity of baked anode (µΩm)
CHAPTER 1
INTRODUCTION
1.1 Background
The University of Quebec at Chicoutimi/Aluminerie Alouette Inc. (UQAC/AAI) Research Chair on Carbon, under the leadership of Prof. Duygu Kocaefe, has undertaken a research program on the improvement of the quality of carbon anodes used in the production of primary aluminum. The research, in general, focuses on the production of anodes with high density, low electrical resistivity, and low reactivity as well as the effect of the quality of raw materials, granulometry, and all relevant process parameters [1] on anode properties. This project focuses on the detection of metallic impurities (V, Ni, Fe) in coke and carbon anodes and their effect on anode reactivity.
Prebaked carbon anodes are used in the electrolytic alumina reduction process to produce primary aluminum. Prebaked carbon anodes usually consist of approximately 85 % dry aggregates (about 65 % petroleum coke, 20 % recycled anodes and butts) and 15 % coal tar pitch (binder). The production of anodes involves the mixing of raw materials and the compaction of the resulting paste to produce green anodes. These green anodes are baked in furnaces to produce baked anodes with appropriate properties.
During the production of aluminum by the electrolytic reduction of alumina, carbon anodes are consumed according to the following reaction:
CO2 further reacts with the anode carbon to produce CO. Air also reacts with the exposed anode surface to produce CO2. These reactions increase anode consumption. Excess carbon consumption due to air burn (air reactivity) and carboxy attack (CO2 reactivity) increases the cost of aluminum production.
Reaction of oxygen on the exposed surface of the anode (air reactivity) is given by the following equation:
O2 + C CO2 (1.2) Reaction of CO2 with the anode carbon (CO2 reactivity) is given as:
CO2 + C 2CO (1.3)
As a result, the excess consumption of carbon increases CO2 and CO (greenhouse gases) emissions as well as the cost of aluminum production, decreasing the productivity. The excess consumption also depends on the anode recipe and different impurities present in the anode. Usually low electrical resistance, low permeability, low reactivity, high density, high mechanical strength, and high thermal shock resistance are the basic requirements of good quality anodes [1].
Iron, nickel, and vanadium are the common metallic impurities in anodes. The sources of impurities in anodes are the raw materials of the anode. The sources of iron are coke, butts as well as pitch. Vanadium and nickel usually comes from the coke. The source of iron, nickel, and vanadium in coke can come from the crude petroleum and the catalytic processes in the petroleum refinery. Cast iron used in the anode stub holes are the source of iron in the anode butts. These impurities are transition metals and can catalyze the air and CO2 reactivities. They can bind with a variety of ligands and can form colored complexes.
Due to the presence of partially filled “d” orbitals, the transition metals can form colored compounds.
There are different sophisticated methods for the estimation of impurities in anode materials [2-4]. These methods require costly instruments, ultra-pure reagents, highly trained personnel, and laborious sample preparation. Industries are in need of a simple, fast, and reliable method to estimate the concentrations of impurities in anode raw materials. Colorimetric methods can fulfill the requirement of the industry. Colorimetric determination of different chemical species is based on the color analysis of the product produced by the reaction of the impurity with a reagent. The focus of the project is on the colorimetric detection and the qualitative estimation of the impurities (V, Ni, Fe) in coke and carbon anodes, and their effect on the anode reactivities. There are a large number of colorimetric methods available, which use different reagents for the determination of transition metal impurities (V, Ni, Fe), but these methods have not been applied to cokes and anodes. It is difficult to apply the existing colorimetric methods to estimate Fe, V, and Ni in coke and anodes as these impurities remain bound to the carbon along with other elements, and the color of carbon is black. In this study, methods were developed to extract the impurities in the form of a clear solution from the carbon materials and to analyze their concentrations using the existing colorimetric methods. The methods developed during this investigation are rapid. The knowledge on the impurity level can help understand the effect of each impurity as well as their combinations on anode reactivity. Therefore, the colorimetric methods can be used as tools in choosing or rejecting raw materials.
In order to achieve the goals of this research project, the concentrations of impurities (V, Ni, Fe) were determined with different colorimetric methods. It is well known that the transition elements like V, Ni, and Fe can form colored complexes with chelating compounds. Once the color is formed, a digital-camera (with a custom-made image analysis software) or the Datacolor equipment was used to analyze the color. The method is simple, quick, repeatable, and environment-friendly. The air and CO2 reactivities of the anode samples, with different levels of V, Ni, and Fe, were studied. The experimental results were analyzed to understand the effect of different impurities on the CO2 and air reactivities of the anode samples. In addition, an artificial neural network model was used to analyse and clarify the trends.
1.2 Statement of the problem
Some of the common impurities found in cokes and anodes are transition metals such as vanadium (V), nickel (Ni), iron (Fe), etc. They affect the air/CO2 reactivity of anodes in the electrolytic cell during aluminum production; consequently, they increase the anode consumption, emission of greenhouse gases, and the energy consumption and thus decrease the productivity. Generally, these impurities are analyzed by inductively-coupled plasma spectroscopy-optical emission spectroscopy (ICP-OES), inductively-coupled plasma spectroscopy-atomic emission spectroscopy (ICP-AES), inductively-coupled plasma mass spectroscopy (ICP-MS), X-ray fluorescence spectroscopy (XRF), atomic absorption spectroscopy (AAS), x-ray photoelectron spectroscopy (XPS), and combustion techniques. However, all these methods are costly and require a lot of time, precision instruments, and well-trained operators. Thus, the industry is in need of developing new
techniques that are easy to apply, rapid, and economical to determine the level of impurities in carbon materials. It is also important for the industry to understand the effect of different impurities on anode reactivities to control the quality of anodes in spite of the variations in the properties of raw materials. The density and electrical resistivity of the anode samples influence the reactivities. However, the anodes are always nonhomogeneous, and this affects the anode properties. Thus, the density and the resistivity of the samples were also measured to see if the anode quality remained relatively similar during the tests.
1.3 Objectives
The global objective of the project is to develop a simple, quick, and inexpensive method for the quantification of Ni, V, and Fe (transition metals) present in coke, butt particles, dry aggregates, and anodes as well as to study the effect of different impurities on anode reactivity.
The specific objectives are:
a. to estimate the level of different impurities (V, Ni, and Fe) in carbon materials using colorimetric methods;
b. to reduce the time for sample preparation and measurement;
c. to facilitate the implementation of the method in an industrial environment; d. to study the effect of V, Ni, and Fe on the air and CO2 reactivities of anodes. 1.4 Methodology
In this study, colorimetric methods were developed to determine the level of impurities (Fe, V, Ni) in cokes and anodes. In this method, the metallic impurities were
extracted from the carbon sample by acids and/or electrophoresis. The solution of the extracted metal was treated with a reagent to produce a color. The picture of the colored solution in a plastic container was taken using a camera, and the color of the picture was analyzed after a certain time with a custom-made image analysis software. A calibration curve was prepared by plotting a color component (red, green or blue) as a function of the known concentration (measured by XRF) of the impurity. The calibration curve was later used to determine the concentration of the metallic impurity of a sample with an unknown concentration. The method was validated in the presence of interfering ions.
Two sets of anodes were produced. In one set, the amount of one impurity (Fe, Ni, and V) was changed for the same coke. In the other set, the anodes were fabricated using cokes with different impurity contents. The green anodes were baked under conditions similar to those typically used in industry. The properties of the green and baked anodes were measured (density, electrical resistivity for both anodes; air and CO2 reactivities for baked anodes). The experimental results were analyzed in order to determine the effects of the impurities on the reactivities of anodes. Also, an artificial neural network (ANN) model was used to complete the analysis.
1.5 Scope
The thesis contains five chapters and one appendix. Chapter 1 introduces the general subject, the background, the statement of the problem, the objectives and the scope.
Chapter 2 presents the previous works reported on colorimetric estimation of metallic impurities and the effects of the impurities on coke and anode properties.
Chapter 3 provides information on the chemical reagents, the methodology, and chemical reactions taking place during the experiments. It also gives a description of the equipment used for the determination of color. The development of the colorimetric method is also described in this chapter.
Chapter 4 presents the results and discussion of the determination of metallic impurities and the effect of impurity contents on anode and coke samples. The results of the investigation of the laboratory anode properties (density, air/CO2 reactivities, and electrical resistivity) are given. In this section, the results for two sets of anodes were presented. In one set, the amount of one impurity was changed for the same coke by adding different chemicals to that coke. In the other set, cokes with different impurity contents were used. Anodes were prepared for both sets and the properties of these anodes were measured. In addition, the artificial neural network (ANN) method was used in order to study the intricate relationship between impurities and anode reactivities using the results of all anode samples. The main ANN results are presented in this chapter. The rest of the results are given in appendix.
Chapter 5 gives the conclusions of the current study and the recommendations for future work.
CHAPTER 2
LITERATURE REVIEW
2.1 The carbon anode
The production of aluminum is carried out in the electrolytic cells. Alumina (Al2O3) is dissolved in a bath of molten cryolite (Na3AlF6) at approximately 960C, and aluminum (produced through the electrolysis of alumina) is collected on the cathode below the bath (see Figure 2.1). Carbon anodes, immersed in the molten electrolyte, are used in the reduction process and thus are consumed during the electrolysis. This electrolytic process is represented by the following reaction:
2Al2O3 + 3C 4Al + 3CO2 (2.1)
Figure 2.1. A schematic view of an electrolysis cell with a prebaked anode [1] Anode
Cathode Alumina Aluminum
A carbon anode consists of approximately 65% petroleum coke, 15 % coal tar pitch, and 20% recycled anodes and butts. Coal tar pitch is produced as a byproduct during the metallurgical coke production [1].
In spite of various practical and economic constraints, the overall objective of the industry is to determine the appropriate conditions to produce carbon anodes with a high density, low CO2 and air reactivities, and a low electrical resistivity.
2.2 Anode raw materials
2.2.1 Coke
One of the raw materials of carbon anodes is calcined petroleum coke, which is produced from the heavy residual fractions of crude oil. The source of crude oil, processes within the refinery, and calcination conditions determine its quality and composition. The calcined coke contains different impurities such as sulfur and metals including Ni, V, and Fe. In recent years, the impurity content of the coke has increased [1].
2.2.2 Butts
Butts are the remaining section of the anode after electrolysis. They contain large amounts of sodium coming from the electrolytic bath. Butts are cleaned and recycled [1].
2.2.3 Recycled anodes
Recycled anodes are usually generated from start-up and shutdown operations, process variations and reject formed during anode manufacturing. Green recycled anodes can have different pitch contents. The baked recycled anode is usually processed with the butt fraction [1].
2.2.4 Pitch
The role of binder pitch is to cover the coke particle surface, penetrate into the pores, and fill the void space between the particles. During baking, pitch carbonizes and binds the particles together. Good wetting of coke by pitch helps better coat and bind coke particles and improves the filling of the pores. Pitch is obtained as a residue during the distillation of coal tar in a coke oven at about 1100 °C. The chemical compounds in pitch have a broad molecular weight distribution [1].
2.3 Impurities in coke and anode
The impurities present in raw materials, especially in petroleum coke and coal tar pitch used for anode production, influence significantly the reactivity of carbon anodes. Petroleum coke is produced from heavy residual fractions of crude oil. Iron, nickel, vanadium, and other impurities become concentrated in these heavy fractions. Coal tar pitch does not contain any nickel or vanadium. It is found that vanadium present in heavy petroleum product diffuses inside the pores of the petroleum coke during heat treatment. Vanadium is found in the pores as V2O3 whereas nickel stays in the metallic form [2]. Typical concentrations of metallic impurities in anodes are presented in Table 2.1.
Table 2.1. Anode impurities [1]
Elements Units Typical Range Typical 2σ Range
Sulphur (S) % 0.5-3.2 0.1-0.8 Vanadium (V) ppm 30-320 10-60 Nickel (Ni) ppm 40-200 10-40 Silicon (Si) ppm 50-300 100-400 Iron (Fe) ppm 100-500 100-500 Aluminum (Al) ppm 150-600 100-600 Sodium (Na) ppm 150-600 100-800 Calcium (Ca) ppm 50-200 50-100 Potassium (K) ppm 5-30 5-10 Magnesium (Mg) ppm 10-50 10-30 Fluorine (F) ppm 150-600 100-500 Chlorine (Cl) ppm 10-50 10-20 Zinc (Zn) ppm 10-50 10-20 Lead (Pb) ppm 10-50 10-20
2.4 Different methods to estimate Fe, Ni, and V
2.4.1 Inductively Coupled Plasma Spectrometry
Inductively Coupled Plasma Mass Spectrometry (ICP-MS) is widely used in the determination of impurities in crude oil, fuel oil, naphtha, residual oil, asphalt, and coke. The method is also used in the analysis of monomers, natural gas, and oil products [5]. Another report describes the determination of vanadium in petroleum and petroleum products using ICP-MS techniques [6]. Inductively Coupled Plasma Atomic Emission Spectroscopy (ICP-AES) was used to measure the catalytic performance of NiMo catalysts supported on tailored activated carbon (AC) [7].
2.4.2 X-ray Fluorescence Spectroscopy (XRF)
Verma [8] described the application of X-ray Fluorescence (XRF) technique in the fields of industry, medicine, biology, environmental studies, archaeology, and geology.Atomic Absorption Spectrometry (AAS)
Some researchers used atomic fluorescence spectrometry as a standard method for Hg determination in green coke and oily sludge samples [9]. Atomic adsorption spectrometric analysis (AAS) was used to characterize monometallic oil-soluble Mo or Ni catalyst [10].
2.4.3 Colorimetric determination of Fe, Ni, and V
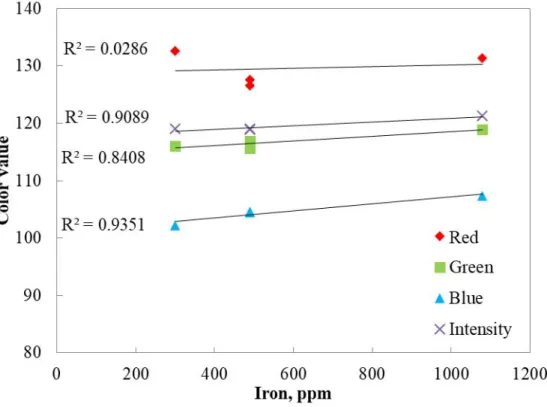
Colorimetric analysis carried out using a smartphone camera was reported in the literature [11-15]. These studies show the possibility of using a high-resolution camera to determine the quantity of phosphorus, chlorine, and methamphetamine. Moonrungsee et al. [11] found that the ambient light intensity seriously affected the color of a picture. The results were more precise in the cabinet using a single LED light. An analysis based on red (R), green (G), blue (B) [11, 14, 15], and intensity [14, 15] values of color showed good correlations with the results obtained by sophisticated techniques. Published articles demonstrated the potential for the development of accurate, rapid, quantitative, and real-time determination methods using the digital camera of smartphone [14, 15].
It was reported that Matlab software can be used to analyse the R, G, B values for the colorimetric determination of iron content. The results showed greater accuracy compared to UV-visible spectrophotometry [16].
As can be seen from the above literature review, even though articles have been published on the determination of transition metal content using colorimetric methods in a number of fields, no study was found on the application of such methods to carbon anodes or carbon materials.
a) Colorimetric determination of nickel
Gazda et al. [17] reported a method for the estimation of nickel using dimethylglyoxime. The reagent formed a pink colored complex and precipitated as colored sediment on the surface of an extraction membrane and was analyzed by diffused reflectance spectroscopy.
Chilton [18] reported the colorimetric determination of nickel by complexation with diethyldithiocarbamates. He found that it is easier to extract the metal- diethyldithiocarbamate complex from slightly basic solution. The efficiency of the extraction process was reduced in the presence of ammonium ions. He suggested that sodium carbonate is a better choice instead of ammonium hydroxide to make the solution alkaline.
Lingane and Kerlinger [19] and Flora and Nieboer [20] reported a polarographic method using dimethylglyoxime for the estimation of nickel. Tartarotti et al. [21] reported a method for the estimation of nickel in ethanol using an electrode modified with carbon paste containing dimethylglyoxime. It was found that 1-nitroso-2-naphthol is effective for both nickel and iron. It acts as a color-forming chelating reagent and forms complexes which are sparingly soluble in water. The stability and the amount of the complex formed
can be improved by adjusting the pH level. Adjusting pH to a certain value or adding masking agents such as NH3 or oxalate can reduce the interfering effects of other ions [14] .
b) Colorimetric determination of iron
Different researchers used the colorimetric method for the estimation of iron. Muir and Andersen [15] developed such a method for the determination of ferrous iron in a copper-process metallurgical solution using o-phenanthroline as the chromogenic agent.
Braunschweig et al. [16] compared the use of ferrozine and o-phenanthroline reagents for the colorimetric estimation of iron in geomicrobiological studies. He compared the results with those obtained using ICP-AES. The results obtained using o-phenanthroline was more accurate compared to that for ferrozine. Saywell and Cunningham [22] used an o-phenanthroline method for a quick and reliable determination of iron (5-20 ppm) in plant tissues and their extracts. He mentioned that this method can also work for the analysis of inorganic substances such as industrial products and dilute salt solutions. The presence of copper, aluminum, and magnesium did not affect the accuracy of the measurement within a certain range of concentrations.
Baumann [23] published a method for the determination of relative amounts of Fe2+ and Fe3+ in glass. He dissolved the glass sample with a sulfuric acid-hydrofluoric acid mixture. Ammonium metavanadate was used to preserve the Fe3+ ions. At pH 5, magenta Fe II–Ferrozine complex was formed to estimate Fe2+. Fe2+ content was determined from the absorbance at 562 nm, and the total Fe was determined from the absorbance of the same solution after ascorbic acid was added to reduce Fe3+ to Fe2+. Kitson [24] used a spectrophotometric technique for the estimation of iron using thiocyanate-acetone which
formed a colored complex. The method was simple, rapid, and free of interferences. Beyer et al. [25] described a combination of DC and AC polarographic methods for the estimation of iron. Van den Berg et al. [26] used cathodic stripping voltammetry for the determination of iron using hanging mercury drop electrode.
Fe2+ was estimated spectrophotometrically in flow-injection systems [27-30] using 1,10-phenanthroline as the chromogenic reagent [31]. Ascorbic acid was used to reduce Fe3+ and the total iron content was estimated [32,33] using 1,10-phenanthroline. The method could measure total iron in the range of 0.1-30 mgL-1. Dieker and Linden [30] measured Fe2+ and Fe3+ in rock samples by a flow injection system using an amperometric detector. Another report published the use of a spectrophotometric method to determine the quantity of Fe2+ and Fe3+ by synchronized sample injection into two parallel flow systems [34-36]. They used l, l0-phenanthroline and thiocyanate as chromogenic agents to determine the iron content [28]. Some researchers [29] used a similar system, but they used the same detector for two parallel flow systems. The system described above has been applied to the simultaneous determination of species that does not produce color at the same rate [30]. Masoom and Townshend developed a similar method for the simultaneous enzymatic determination of sucrose and glucose [34].
Apilux et al. [35] developed a lab-on-paper device combining electrochemical and colorimetric detection for the quick determination of Au and Fe contents. The limit of this detection (LOD) of the proposed method was 1 ppm. The results were in line with those obtained from ICP-AES.
Kawakubo [36] developed a simple on-site technique for the colorimetric determination of chromium, iron, and copper in electroplating bath solutions. He used a portable colorimeter (containing red-green-blue light emitting diode) to measure the absorbance. Copper and iron amounts were determined from the chelating form of Cu(I)-bathocuproindisulfonate and Fe(III)-thiocyanate, respectively. Analytical results agreed with those obtained by AAS.
Usually, iron exists with other ions. It was reported that EDTA is effective to reduce the influence of other impurities on iron. Goto et al. [37] published a rapid photometric method for the estimation of manganese content in presence of iron using formaldoxime. Formaldoxime worked as a colorimetric agent to develop color with manganese. The iron formaldoxime formation was controlled by adding EDTA and hydroxylamine.
Another effective way to eliminate the interference is to control the pH values. Yun and Choi [14] described a colorimetric method for the estimation of iron, nickel, and cobalt quantity using 1-nitroso-2-naphthol to form chelating complexes. The effect of other ions was eliminated by controlling the pH. A colorimetric method for the estimation of Fe3+ content under physiological pH conditions (pH 7.0) [38] using 4-(4-hydroxy-1-naphthylazo) benzenesulfonic acid (HNABA) has been reported. The color of the solution varied from brick red to light red and was stable under acidic or neutral conditions. Under these pH conditions, there was less effect of the solvent and the coexisting metal ions.
c) Colorimetric determination of vanadium
There are also numerous colorimetric methods to determine the vanadium content. It may be noted that vanadium is always present together with other ions.
HCl is an appropriate chemical to extract vanadium from coke and anode. It is reported that a minimum of 10 ppm of vanadium can be detected with a few drops of concentrated sulfuric acid and one drop of sodium metavanadate solution [39] by a spot test. Sulfuric acid can also be used to extract impurities from coke and anode when developing quantitative methods for the determination of impurities.
Dispersive liquid-liquid microextraction (DLLME)-digital colorimetry (DC) was used to determine trace amount of vanadium in water. N-benzoyl-N-phenylhydroxylamine was used as chromogenic agent, and ethanol and chloroform were used as dispersive solvent and extractant to test vanadium in an acidic environment. This produced a purplish red chelate complex. The picture of the color was taken by a digital camera [40] and analyzed. This method involved less time and lower cost than those required for XPS, AAS, XRF, etc. In addition, it was rapid and highly sensitive. This method has not been used with cokes and anodes.
The first use of N-benzoyl-N-phenylhydroxylamine (BPHA) was reported by Bamberger [41]. He used this reagent to estimate copper, iron, aluminum, and titanium contents. Shome [42] also used the same reagent, and it produced orange-red color sediments with vanadate ions. The sediments were hardly soluble in organic solvents such as ethanol and acetic acid. It is possible to determine vanadium content using this reagent because the chelate complex produced stays in the colloidal state and does not pass through the filter paper easily. Thus, it can easily be separated. It was reported that in the absence of air, the chelating complexes would not be formed and there would be no color. In an open environment, it was easy to form the colored chelate complex. It was revealed from
different experiments that BPHA is a chelating ligand that preferably reacts with V5+ compared to V4+ [43].
Priyadarshini and Tandon [44] also adopted BPHA as a highly specific reagent for vanadium. It was found that, under strongly acidic conditions, vanadium formed a deep violet water-insoluble chelating complex. Chloroform was used to extract the violet chelating complexes, and then the extracts were used for the spectrophotometric estimation of vanadium quantity. This method could also be used for anodes to eliminate the effect of the interfering ions. A report was published which described a fast and sensitive determination method for vanadium. Less than 0.06 μg of total vanadium was collected from airborne particles in a filter bag attached to an air sampler. This method utilized nitric, sulfuric, and perchloric acids to dissolve the samples, then decompose the suspended silicate residue in a sulfuric-hydrofluoric acid mixture, followed by the addition of BPHA to form a vanadium-N-benzoyl-N-phenylhydroxylamine complex. Later, chloroform was used to extract the complex for spectrophotometric measurement [45].
As a reagent, the advantage of BPHA is that it is easy to handle and sensitive to vanadium for its colorimetric estimation. It is possible to preserve BPHA for a long time. Even if there was interferences of cobalt and copper, it was possible to estimate vanadium content quite efficiently [43].
To eliminate the interference of other ions with vanadium, Sandell [46] used a colorimetric method to separate vanadium from chromium using 8-hydroxyquinoline and chloroform. Vanadium was first reacted with 8-hydroxyquinoline in neutral or slightly acidic solutions and then it was extracted using chloroform.
Belitskus and Danka [47] obtained the correlation between the reactivity of cokes and the vanadium content of coke.
2.5 Anode properties
Two types of anodes (Soderberg and prebaked) are used in the electrolytic cells [1]. Raw material is continuously fed when Soderberg anode is used, and this produces lots of volatile gases containing PAH (polycyclic aromatic hydrocarbons). On the other hand, prebaked anodes need to be replaced at regular time intervals. The advantage of prebaked anodes is that they are compacted and it is easy to maintain their quality (compared to Soderberg anodes). This leads to lower carbon consumption as well as makes it easier to control the fumes produced during the baking of anodes [1]. Due to technical and environmental reasons, prebaked anodes are commonly used in the aluminum reduction process, especially in modern smelters. High density and consistent quality anodes are important in the electrolytic process.
2.5.1 Density
Typical industrial anodes have a green density (GAD) in the range of 1.55-1.65 g/cm3, a baked density (BAD) between 1.50-1.60 g/cm3, and a baking loss or volatile loss of around 4.5-6 % during baking [1, 48].
Low baked density implies high porosity which leads to low mechanical strength, high elasticity, low thermal conductivity, and high permeability [1, 48]. It is well known that high gas permeability results in high anode consumption. Thus, high porosity increases the air and CO2 reactivities and the electrical resistivity [1, 48].
High baked density reduces air permeability and extends anode life [1, 48]. However, extremely high density leads to thermal shock problem. The optimum baked density depends on the raw materials, aggregate granulometry, mixing and forming conditions, process parameters, and pitch content.
Anode quality improves when the baked anode density stays in the optimal range. Apparent density of anode samples (cores) are measured using the ASTM D5502-00 standard [49].
2.5.2 Electrical resistivity
High electrical resistivity results in high energy consumption and reduces efficiency and economy of the electrolytic process. Typical industrial anodes have electrical resistivities of around 50-60 μΩm [1, 48]. The electrical resistivity of baked anodes is much lower compared to that of green anodes. A decrease in electrical resistivity of a baked anode results in an increase in its thermal conductivity. However, too high a thermal conductivity increases the anode surface temperature, causing excess carbon consumption (air-burn, dust formation) [1, 48]. The electrical resistivity is related to both anode density and cracks in the anode. Denser anodes have fewer cracks and thus lower electrical resistivity as dense anodes contain low porosity. The ASTM D6120-97 standard is used to measure the electrical resistivity of anode samples (cores) [50].
2.5.3 CO2/air reactivity
During the production of aluminium by the electrolytic reduction of alumina, carbon anodes are predominantly consumed according to Equation (1-1) [1, 48]. A certain quantity of CO is also produced when CO2 further reacts with anode carbon; this increases anode
consumption. Also, air diffuses through the alumina layer covering the top of the anode and reacts with the carbon anode; this is another cause of anode over-consumption. Excess carbon consumption occurs due to (a) air burn (air reactivity); (b) carboxy attack (CO2 reactivity); and (c) dusting (selective oxidation). These are also grouped into chemical consumption and physical consumption. In chemical consumption, air and CO2 react with the anode, and carbon is consumed due to the reaction [1, 48]. During physical consumption, a part of the coke or pitch detaches from the anode and falls into the electrolytic cell. The inherent cause of physical consumption can be due to the deterioration of anode structure since air/CO2 gases react with carbonized pitch and coke present in anode to different extents. This reactivity imbalance weakens the structure, and the physical loss of carbonized pitch and coke occurs. This process is called dusting.
Air reactivity depends on the permeability and the porosity of anode and is favored at temperatures above 450 °C. It is reported that the air reactivity is reduced with increasing calcination temperature of coke [51]. Reaction of oxygen on the anode surfaces exposed to air is called air burn (see Equation 1.2).
CO2 reactivity is also permeability-dependent (permeability is intimately linked to porosity) and favoured at bath temperatures of 950-970 °C [51]. Permeability is an index that indicates the ease with which a fluid flows through a porous solid [52]. This also explains the importance of the effect of porosity on the reactivities [1]. Reaction of CO2 with the anode carbon (also called carboxy attack) is given by equation 1.3.
As a result, the excess consumption of carbon increases the cost of aluminum production as well as the CO2 and CO (greenhouse gas) emissions. The excess
consumption is also dependent on the chemical composition and the structure of raw materials used in the anode production as well as the anode production parameters and the baking conditions [1, 48].
Figure 2.2 (a) shows the temperature distribution in a relatively new anode in the electrolysis cell and the regions where air and CO2 reactions take place. The CO2 reactivity is selective and reacts with carbon atoms in reactive sites [51]. The CO2 bubbles produced according to the reaction 1.1 can increase the resistance between the anode and the electrolyte. Diffusion of the gas into the anode body can lead to an internal reaction occurring in the pores. Raw material properties, production process, pitch content, and baking parameters are the important factors that can have an influence on the gas permeability of the carbon anode; and this, in turn, has an impact on anode reactivity [1, 53]. Figure 2.2 (b) shows dust formation during air/CO2 reactivity [51]. Researchers have [1, 14] studied the subsurface carboxy reactivity and used macroscopic analysis of anode butts to confirm that internal attack is selective, and air and CO2 preferentially attack the regions of pitch-coke and coke fines rather than the larger coke particles (Figure 2.2 (b)) [1, 48].
Figure 2.2. (a) Anode temperature distribution and reactivities in a reduction cell [1, 48], (b) Dust formation during the reaction of air/CO2 with anode [51].
ASTM-D6558-00a [54] for CO2 reactivity and ASTM-D6559-00a [55] for air reactivity are the standard test methods for baked carbon anode samples.
2.6 The influence of impurities on CO2 and air reactivities
Carbon anodes contribute significantly to the cost of primary aluminum production. The oxidation of anodes by air and CO2 causes extra carbon consumption. A study described that air and CO2 reactivities have a medium to strong positive correlation with the level of metallic impurities such as nickel, iron, and vanadium [3].
A number of researchers found that nickel does not have any significant effect on the air and CO2 reactivities [4]. On the other hand, some researchers reported that it can
catalyze both CO2 and air reactivities [56-58]. In spite of the variations in the opinions of various researchers regarding the effect of nickel, they always observed that, as seen in Figure 2.3, an increase in sulfur content can reduce the effect of nickel [56, 57] in the range of nickel concentrations studied.
Figure 2.3. (a) CO2 and (b) air reactivities of coke as a function of nickel and sulfur contents [56]
Casada et al. [4] found that nickel alone does not affect the air/CO2 reactivities of anode, but it can increase CO2 reactivity in the presence of butt particles [58].
It is difficult to judge the effect of nickel on anode reactivity as the nickel content of coke is highly related to the vanadium content. Recently, Nian-Bing et al. [59] found that the presence of the right amount of Ni (between (210~710 ppm) can inhibit the reactivity and reduce the mass loss rate and dusting of carbon anode by CO2 or air reactivities. It is difficult to study the effect of nickel only due to the presence of other impurities. The conflict of different views on effects of Ni is probably due to the presence of other impurities and their quantities.
Sulfur concentration can influence the effect of nickel. In low-sulphur anodes, it was found that the CO2 reactivity increases with increasing baking temperature [60]. The
reason for this increase is that nickel and nitrogen can form nickel nitrides and stay in anodes, and these nitrides decompose at elevated temperatures in carbon dioxide environment. In this process, nickel compounds are reduced and form metallic nickel, which may catalyze the CO2 reactivity.
It is reported that salts of iron and coke deposits cause the corrosion and fouling of the preheater tubes of the crude oil at high temperature. This may lead to the formation of iron sulfide [61] and contaminate the petroleum coke. Sulfur compounds (such as sulfates or organic sulfur compounds) and iron can also react. The possible reactions are shown below:
Step 1: 2RCH2COOH + Fe0 (RCH2COO)2 Fe + H2 (2.2) 2RCH2COOH + Fe++ (RCH2COO)2 Fe +2H+ (2.3) Step 2: (RCH2COO)2 Fe RCH2COOH2R + FeO + CO2 (2.4) Step 3: FeO + R’-S-R’’ FeS + R’-O-R’’ (2.5) FeO + H2S FeS + H2O (2.6) where R’ and R’’ represent aliphatic or aromatic functional groups.
By these pathways, sulfur can reduce the effect of iron as a catalyst for air reactivity. The iron sulfide is not catalytically active during the initially, but can be converted to the active metallic state after a certain time [3].
Vanadium usually stays chemically-bonded to hydrocarbons. It is known that vanadium is not only a strong CO2 reactivity catalyst, but also a strong air burn catalyst for carbon anodes. The vanadium content can increase the CO2 reactivity as a catalyst, but the effect of vanadium is reduced with the increasing sulfur content (Figure 2.4) [56].
Figure 2.4. CO2 reactivity of coke as a function of vanadium and sulfur contents [56] It is stated in the literature that high amounts of vanadium in coke increases the air reactivity of anodes. However, the correlation for these trends is usually not good due to the difficulty of separating the effect of vanadium from other impurities present [48].
There is also one report which states that a certain amount of vanadium (480~1480 ppm) can help make better anodes, but the quality can deteriorate when more vanadium [59] is present. This finding needs to be verified.
Fukasawa et al. [45] re-calcined several coke samples to study the effect of variation in the thermal history of cokes and observed that there was an increase in the reactivity of low impurity cokes as the content of vanadium is increased. However, the sulfur content was not reported. Houston and Oye [57] found that the presence of metallic impurities can catalyze the reactivities of anodes. They stated that it is difficult to find a universal correlation between the vanadium content and the CO2 reactivity of anodes.
The catalytic effect of the impurities (V, Ni, and Fe) can be reduced by sulfur as it can form inactive metal-sulfur complexes. At high temperatures, the effects of these
metallic impurities usually increase in the absence of sulfur. The catalytic activities of these metallic impurities are influenced by their physical state, chemical form, and type of interactions with other compounds [40].
As it can be seen from the previous works, the effect of impurities on the anode reactivity has not been well understood. There are conflicts between the results of different studies. This is most probably due to differences in the concentration of impurities other than the one being studied. The present study addresses this issue.
2.7 Artificial network analysis (ANN)
Artificial neural network (ANN) is an important tool in predicting the values of dependent parameters when there is no known relation that exists [62, 63]. Neural networks are inspired by biological nervous systems [64]. They are used to find patterns, to express an output parameter as a function of a number of input parameters, and to predict the value of an output parameter for a set of input parameters.
It contains different interconnected layers (input layer, hidden layers and the output layer). Construction of the artificial neural network model, training, validation and prediction of output for a desired set of input parameters are the main steps of an artificial neural network model development.
Artificial neural network models have been used in a diverse range of chemical engineering applications. In one study, it has been used to show the effect of pitch percentage and coke porosity on the CO2 reactivity of anodes [65]. Another research used ANN to reveal that hardness increased with total alloy loading, whilst the corrosion rates
did not show any clear relationship with alloy loading. ANN results contributed to an understanding of compositional effects on the corrosion of Mg, and can predict corrosion resistance of Mg alloys [66].
Although these models were used in different fields as explained above, they were rarely applied to carbon anodes used in aluminum industry [67]. Different ANN models were developed for anodes and cokes within the frame of the UQAC/AAI Chair on carbon. [68-70] . In the current study, an ANN model is applied in order to predict the effect of metallic impurities on anode reactivity.
CHAPTER 3
EXPERIMENTAL SET-UP AND TEST PROCEDURES
The methodology is summarized in Figure 3.1. It is broadly classified into two sections: a) colorimetric estimation of iron, vanadium, and nickel contents in coke/anode samples; and b) investigation of the effect of different impurities on anode air/CO2 reactivities.
In this project, based on the information published in the literature and some preliminary studies, methods for colorimetric analysis were developed using a web-cam to determine the concentration of metallic impurities (Fe, V, Ni). These methods have never been applied to carbonaceous materials before. The methods are fast, precise, economical, and can be used easily in industrial applications to analyse the metallic impurities. The impurities were extracted from the carbon materials by chemical reaction and electrophoresis techniques. Calibration curves were prepared using samples having known amounts of impurities. The results were validated using other samples with known impurity contents. Finally, the calibration curves were used to measure the impurity concentrations in different carbon samples for which the impurity contents were not known.
Anodes were fabricated using: a) different cokes with known amounts of impurities or b) the same coke and adding predetermined amounts of impurities. The densities and electrical resistivities of the anodes were measured. The reactivities depend on the quality of the cores. Even though all the raw materials were the same, the quality of anodes may
vary due to non-homogeneity of the raw materials. The density and resistivity measurements showed the quality of the cores. The air/CO2 reactivities of the anode samples were measured using the standard ASTM methods. The results were analyzed to understand the effect of the impurities on anode reactivities. The artificial neural network (ANN) method was used for the analysis due to the complexity of the data.
Figure 3.1. Summary of the methodology
3.1 Materials used
Colorimetric methods for the estimation of iron, nickel, and vanadium were developed using potassium thiocyanate, dimethylglyoxime, and N-benzoyl-N-phenylhydroxylamine, respectively, as reagents. The reagents form colored complexes
reacting with the transition metal ions. The methods were validated by comparing the results with the XRF measurements carried out independently using the same samples.
Two groups of anodes were produced. For the first group, six different commercially available calcined petroleum cokes of known impurity levels and a coal tar pitch were used for the fabrication of anodes. These cokes contain different amounts of a number of impurities. It is not possible to have different cokes where only the amount of one impurity is different while the others are the same. Samples from these anodes were used to study the effect of different impurities, present in different coke samples, on anode reactivities.
For the second group, different chemicals (impurities) were added to a particular calcined petroleum coke (one of the six cokes mentioned above), and anodes were produced to study the effect of a particular impurity on the anode reactivities. This method was used to change the level of one impurity without affecting others. The chemicals were chosen based on the possible forms of the specific impurity present in anode. Iron, nickel, and vanadium were added in the form of ferrous sulfate, nickel chloride, and vanadium chloride, respectively.
3.2 Colorimetric reactions
Iron salts react with potassium thiocyanate to produce ferric thiocyanate salts (Equation 3.1) under acidic conditions. Their color varies from red to reddish-brown.
Vanadium salts react with N-benzoyl-N-phenylhydroxylamine to produce a colored complex (Equation 3.2). The color of the complex varies from purple to brown depending on pH and the type of acids used.
Nickel salts react with dimethylglyoxime to produce a pink colored complex (Equation 3.4).
3.3 Equipment used
3.3.1 Datacolor Check II
It is a multi-gonio-spectrophotometer widely used to obtain the color values of solid samples (see Figure 3.2) [72]. It uses CIELab color system (see Figure 3.3) which is a model for the representation of surface colors adopted in 1976 by the International Commission on Illumination (CIE). The component “L” is clarity, which ranges from 0 (black) to 100 (white). The component “a” represents a range of 600 levels on the axis red
(3.3)
(positive value 299) to green (negative value -300). Component “b” represents a range of 600 levels on the axis yellow (positive value 299) to blue (negative value -300). The Datacolor equipment was used for the preliminary study of the colorimetric methods.
Figure 3.2. Datacolor CheckII
3.3.2 Custom set-up using a webcam
A set-up was developed using a webcam (Microsoft Lifecam 3000) and a small tube light (Figure 3.4). They were placed in a box so that external lights and shadows could not interfere with the color measurements. The camera was connected to a computer, and a custom-made image analysis software was used to capture the image of the sample at a predefined time interval and to analyze the red, green, blue, and intensity components of the color of a certain region of the images. The software plotted the components of color with respect to time. This equipment was used to replace the Datacolor equipment with a low-cost version. This set-up was capable of analyzing colors of solid as well as liquid samples.
![Figure 2.1. A schematic view of an electrolysis cell with a prebaked anode [1]](https://thumb-eu.123doks.com/thumbv2/123doknet/7589773.232221/25.918.138.718.646.997/figure-schematic-view-electrolysis-cell-prebaked-anode.webp)
![Figure 2.4. CO 2 reactivity of coke as a function of vanadium and sulfur contents [56]](https://thumb-eu.123doks.com/thumbv2/123doknet/7589773.232221/43.918.293.722.148.409/figure-reactivity-coke-function-vanadium-sulfur-contents.webp)