Université de Montréal
A comparative study of the resilience of coal logistics chains in
Australia, South Africa and Canada
par Sefiane Benyahia
Département de Géographie Faculté des Arts et Sciences
Mémoire présenté à la Faculté des Arts et Sciences en vue de l'obtention du grade de maîtrise
en géographie
Août, 2012
Université de Montréal
Faculté des études supérieures et postdoctorales
Ce mémoire intitulé:
A comparative study of the resilience of coal logistics chains in Australia, South Africa and Canada
Présenté par: Sefiane Benyahia
a été évalué par un jury composé des personnes suivantes: Claude Comtois, directeur de recherche
Brian Slack, membre du jury et président rapporteur Robert Mc Calla, membre du jury
i
Résumé
Au cours des dernières années l'industrie du charbon a connu un essor important. L'importance du charbon dans l'économie mondiale provient d'une demande mondiale soutenue et de niveaux de production en hausse constante. De ce fait, le nombre élevé d'importateurs et d'exportateurs est à l'origine d'un système d'échange complexe où la compétition est féroce. En effet, un nombre grandissant de pays importateurs se partagent les sources d'approvisionnement tandis qu'un nombre limité de pays exportateurs s'efforcent de répondre à la demande tout en essayant de s'accaparer le plus de parts du marché mondial.
L'objectif de cette recherche s'inscrit dans ce contexte en démontrant les bénéfices associés aux chaînes logistiques résilientes pour tout acteur de l'industrie soucieux de devancer la compétition. Une analyse de la logistique de l'industrie du charbon permet entre autres de se pencher sur les questions suivantes: Comment les infrastructures influencent-elles la résilience d'une chaîne logistique? Quels risques est-ce que les catastrophes naturelles présentent pour une chaîne logistique? Comment la gouvernance influence-t-elle la résilience d'une chaîne logistique?
Une chaîne logistique représente le trajet effectué par un bien ou produit au cours de son cycle de vie, du point d'origine au point de consommation. Ceci étant dit, le meilleur moyen de régler les problèmes inhérents aux chaînes logistiques est de maintenir de hauts niveaux de résilience. Cette recherche évaluera donc la résilience de chaînes logistiques du charbon des industries australienne, sud-africaine et canadienne. Pour ce faire, trois variables seront étudiées: les infrastructures, les catastrophes naturelles et la gouvernance. La comparaison des trois cas à l'étude se fera par un nombre défini d'indicateurs (12 au total) pour chacune des variables étudiées. Les résultats de cette recherche démontrent que la résilience des trois cas à l'étude se ressemble. Cependant, certaines chaînes logistiques détiennent des avantages comparatifs qui améliorent grandement leur résilience et leur compétitivité. Plusieurs sujets de recherche pourraient être utilisés pour compléter cette recherche. L'analyse comparative pourrait être appliquée à d'autres chaînes logistiques pour vérifier la viabilité des résultats. Une analyse semblable pourrait également être entreprise pour le secteur en aval de la chaîne logistique. Finalement, une méthodologie basée sur des interviews pourrait ajouter un regard différent sur les questions abordées. Mots-clés: Chaînes logistiques, industrie du charbon, résilience
ii
Abstract
In recent years, the importance of coal in the world economy has been put to the forefront by a strong demand and consequently, increasing levels of production. The increasing number of buyers and the limited number of sellers has created a system where competition is fiercer than ever. On one hand, importing countries are trying to secure sources of supply while on the other hand, exporting countries are striving to meet demand and secure as many export markets as possible.
In this context, the objective of this research paper is to demonstrate how resilient logistics chains can help decision makers of the industry to stay ahead of the competition. To do this, an analysis of the logistics chain of the industry is the best way to verify whether or not the industry is operating as well as it should be. Such an analysis allows us to tackle the following issues: How do infrastructure issues impact the resilience of the logistics chain? What risks do environmental hazards pose to the logistics chain? Does governance have a positive or negative influence on the resilience of the logistics chain?
“Logistics chain” designates the journey of any kind of product or commodity through the various steps of its life from its creation or point of origin to its point of consumption. This being said, the best way to solve problems in the logistics chain is to find ways to maintain high levels of resilience. This research paper will evaluate the resilience of logistics chains within the Australian, South African and Canadian coal industries. This evaluation will be based on three variables: infrastructures, environment and governance. The methodology necessary to accomplish this task is based on twelve indicators. As the main evaluation tool, these indicators are used to compare the case studies in the context of each variable. The results of this research paper show that the three case studies have similar levels of resilience. However, some case studies have areas in which they outperform their counterparts. While this research provides an in-depth look at the coal industry, several research avenues could still be explored. First of all, expanding the comparative analysis to different coal exporters could add nuance. This task could be undertaken in a different research paper providing decision makers with even more examples of how to improve resilience. A similar comparative approach could also be applied to the downstream section of the logistics chain. Furthermore, a methodology based on interviews with stakeholders could bring in a new perspective on the issue at hand.
iii
Contents
Résumé ... i Abstract ... ii Contents ... iii Glossary ... vii Acknowledgements ... viiiChapter 1: An overview of the research project ... 1
1.1 Context ... 1 1.2 Objectives ... 5 1.3 Research questions ... 7 1.4 Review of literature ... 8 1.4.1 Resilience ... 8 1.4.2 Infrastructure ... 9 1.4.3 Environment ... 10 1.4.4 Governance ... 12
1.4.5 Key performance indicators ... 13
1.5 Methodology ... 15
1.6 The scope and limits of this study ... 21
Chapter 2: Australia, South Africa and Canada’s export corridors. ... 23
2.1 First Case Study: Australia’s export corridor. ... 23
2.2 Second case study: South Africa’s export corridor. ... 26
2.3 Third case study: Canada’s export corridor. ... 29
Chapter 3: Analyzing the relationship between the infrastructures and the resilience of the logistics chain. ... 32
3.1 II#1: Train capacity. ... 33
3.2 II#2: Stock yard capacity. ... 37
3.3 II#3: Capacity utilization of port infrastructures. ... 39
3.4 II#4: Loading equipment operating rates. ... 46
3.5 Cumulative scores of chapter 3. ... 51
Chapter 4: Analyzing the resilience of the logistics chain to environmental hazards. ... 53
4.1 RI#1: The vulnerability of the logistics chain to seismic hazards. ... 54
iv
4.3 RI#3: The vulnerability of the logistics chain to atmospheric hazards. ... 77
4.4 Cumulative scores of chapter 4. ... 85
Chapter 5: Analyzing the relationship between stakeholders and the resilience of the logistics chain. ... 87
5.1 GI#1: The efficiency of planning and development strategies. ... 89
5.2 GI#2: The industry's corporate concentration in the extraction sector. ... 93
5.3 GI#3: The industry's corporate concentration in the railway transportation sector. 98 5.4 GI#4: The industry's corporate concentration in the port activities sector. ... 102
5.5 GI#5: The diversity of the industry's portfolio of clients on world markets. ... 109
5.6: Cumulative scores of chapter 5. ... 114
Lists of the best examples of resilience in the coal industry's logistics chain. ... 116
Conclusion ... 120
References ... 123
v
List of figures
Figure 1: World coal production forecast 1980-2100. ... 2
Figure 2: The coal industry chain of logistics. ... 5
Figure 3: Australia's operating coal mines, December 2008. ... 23
Figure 4: Australia’s export volumes of thermal and metallurgical coal, 1998-2009. ... 24
Figure 5: The Hunter Valley Coal Network. ... 25
Figure 6: An overview of the Mpumalanga coal corridor. ... 27
Figure 7: South Africa's coal exportations, 1992-2010. ... 28
Figure 8: Canada's coal exports, 1999-2015. ... 30
Figure 9: An overview of Canada's coal corridor. ... 31
Figure 10: Major tectonic plates of the world. ... 56
Figure 11: Earthquake clusters in Australia. ... 57
Figure 12: Elevation of the Australian continent... 58
Figure 13: Location of South African earthquakes from 1620 to 2008. ... 60
Figure 14: Location of earthquakes with magnitude ≥2.5 in Canada, 1660-2008. ... 61
Figure 15: Tectonic plates dynamic on North America's West coast. ... 62
Figure 16: Damages resulting from liquefaction to port infrastructures at the port of Kobe following the January 17 1995 earthquake. ... 64
Figure 17: Tsunami waves following a simulated Cascadia subduction zone earthquake. ... 67
Figure 18: Australian tropical cyclones from 1908 to 2006. ... 70
Figure 19: Pasha Bulker coal carrier pushed aground on the coast of Newcastle. ... 71
Figure 20: Percentage of normal rainfall for December 2012. ... 73
Figure 21: Basic movement of air masses over South Africa. ... 80
Figure 22: South Africa's high winds and dangerous thunderstorms area. ... 81
Figure 23: Canada Tornado hazard map. ... 83
Figure 24: PWCS Ownership. ... 103
Figure 25: Newcastle Coal Shippers Ownership in percentage. ... 104
Figure 26: The allocated capacity of Richards Bay Coal Terminal's shareholders. ... 107
vi
List of tables
Table I: World energy demand by type, 1980-2030 (Mtoe). ... 3
Table II: The coal exporting corridors. ... 16
Table III: The possible marking systems used to award scores in each of the indicators. ... 20
Table IV: Marking system for II#1. ... 34
Table V: Marking system for II#2. ... 37
Table VI: Stockyard capacity to export ratio. ... 38
Table VII: Marking system for II#3. ... 40
Table VIII: Newcastle port's capacity utilization. ... 41
Table IX: Richards Bay Coal terminal's capacity utilization. ... 43
Table X: Richards Bay Coal terminal's capacity utilization. ... 44
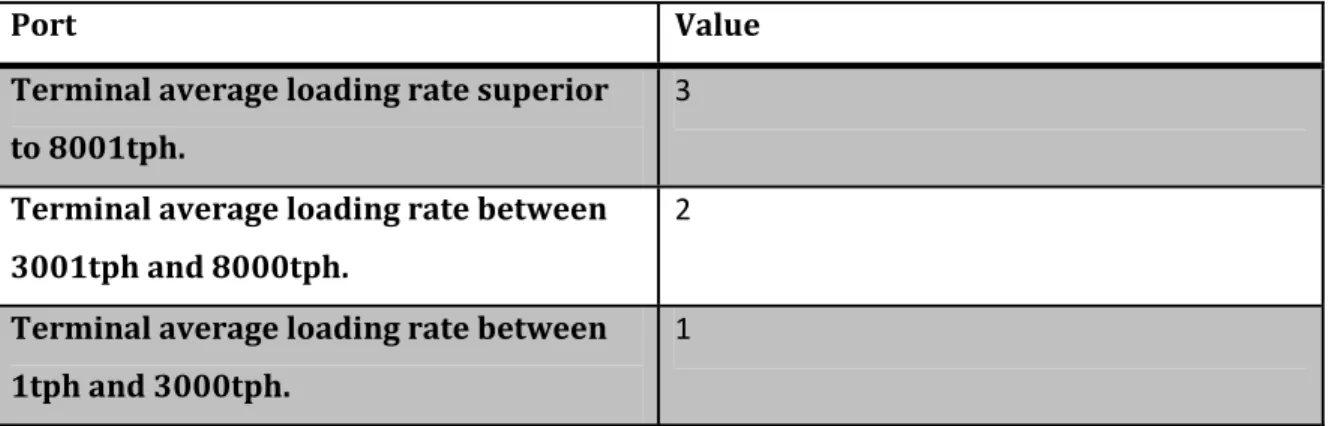
Table XI: Marking system for II#4. ... 46
Table XII: Port of Newcastle's shiploaders operating rates. ... 48
Table XIII: Richards Bay Coal Terminal's shiploaders operating rates. ... 49
Table XIV: Port Metro Vancouver's shiploaders operating rates. ... 50
Table XV: Cumulative scores for chapter 3. ... 51
Table XVI: Marking system for RI#1. ... 54
Table XVII: Marking system for RI#2. ... 68
Table XVIII: Marking system for RI#3. ... 78
Table XIX: Cumulative scores for chapter 4. ... 85
Table XX: Marking system for GI#1. ... 89
Table XXI: Marking system for GI#2. ... 93
Table XXII: Major operating mines of the Hunter Valley region that exported through the Port of Newcastle in 2008-2009. ... 94
Table XXIII: Current major operating mines in British Columbia and Alberta that exported through the Port of Vancouver. ... 96
Table XXIV: Marking system for GI#3. ... 98
Table XXV: Marking system for KPI#8. ... 102
Table XXVI: Marking system for GI#5. ... 109
Table XXVII: Market shares of the top 10 buyers of NSW coal. ... 110
Table XXVIII: Destinations of coal exports through Port Metro Vancouver from 2008 to 2010. 112 Table XXIX: Cumulative scores for chapter 5. ... 114
Table XXX: Cumulative scores IIs, RIs and GIs from chapter 3, 4 and 5. ... 116
Table XXXI: Best example of resilience in the coal industry's logistics chain based on the examples to follow for each indicator. ... 117
vii
Glossary
Mt : Million tonnes
Mtoe: Million tonnes of oil equivalent Gt: Billion tonnes
RBCT: Richards Bay coal terminal KPI(s): Key performance indicator(s) II(s): Infrastructure indicator(s) RI(s): Risk indicator(s)
GI(s): Governance indicator(s) Tph: Tons per hour
Washing process:Washing coal is a technique used throughout the industry. The objective is to upgrade the quality of specimens by reducing the amount of unwanted substances found in raw coal. “Coal is first ground into smaller pieces so that it can be more easily processed. The pulverized coal is then washed in water or in fluids with densities that cause the coal to float so that unwanted impurities can sink to the bottom. Coal washing reduces its ash content by over 50%, resulting in less waste. About 25% of the sulphur content is reduced, lowering the amount of sulphur dioxide emissions released upon combustion. Coal washing also improves the heating value of coal, known as the thermal efficiency, which reduces carbon dioxide emissions as well” (http://climatelab.org/Coal_Washing).
Tectonic plates1:A tectonic plate (also called lithospheric plate) is a massive, irregularly shaped slab of solid rock, generally composed of both continental and oceanic lithosphere. Plate size can vary greatly, from a few hundred to thousands of kilometers across; the Pacific and Antarctic Plates are among the largest. Plate thickness also varies greatly, ranging from less than 15 km for young oceanic lithosphere to about 200 km or more for ancient continental lithosphere (for example, the interior parts of North and South America).
1 U.S. Geological Survey. “What is a tectonic plate?,” U.S. Geological Survey,
viii
Acknowledgements
From start to finish, working on this research has been a real pleasure. What started as an attempt to bridge research interests in the fields of energy and maritime transportation quickly transformed into an in-depth analysis of the coal industry and logistics chains.
There is no doubt in my mind that the person most directly responsible for my passion in the fields of transportation and logistics is no other than my teacher, director and mentor, Professor Claude Comtois. Mr. Comtois, the first class I took with you when I was still an undergraduate student changed me. Your teachings allowed me to embark on a path that will certainly lead me to a gratifying and motivating career. As a student, I was literally blown away by your knowledge and Oh so refreshing and captivating way of teaching! These last two years, your help and guidance have allowed me to write this research with confidence in my abilities. On the other hand, you have also allowed me to work with independence, refusing to hold my hand, but rather pointing me in the right direction. For that, I cannot thank you enough!
Professor Brian Slack also played an important role in my two years as a graduate student and in the making of this memoir. Professor Slack, thank you for your insights and many advices throughout my writing process.
I would also like to thank everyone that has supported me during those two years while I was doing my Masters. Your love, support and energy have allowed me to accomplish this great task on which I have worked so hard. Special thanks are also due to M. Robert Charlton, Dr. Stephen Tredwell, Dr. Robert Mc Calla and Dr. Anton Tony Lovnik.
Last but not least, I want to thank my mother, Francine Lanoix Benyahia whose help and insight as a teacher have allowed me to successfully complete a very important challenge of my life. Mom, thanks for being there all the time! I love you!
Chapter 1: An overview of the
research project
1.1 Context
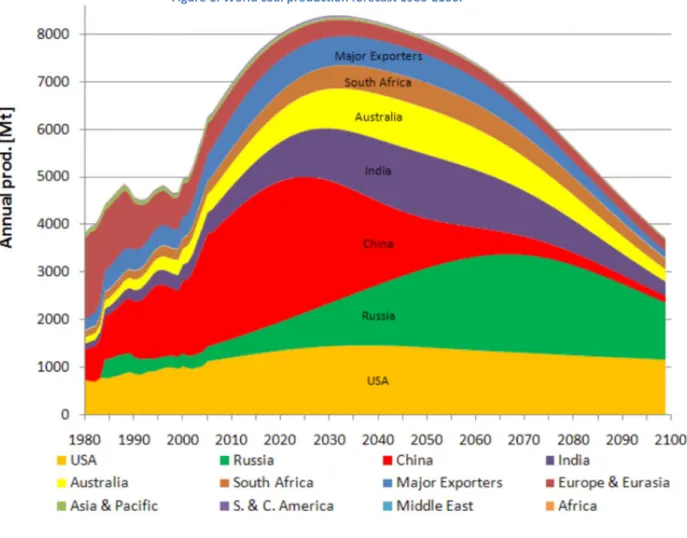
Coal, like most natural resources exploited by man, is a none-renewable commodity. Indeed, dead vegetation is only transformed into coal after millions of years of heat and pressure. In other words, the rhythm at which we consume coal is notably faster than the rhythm at which the resource renews itself. However, as the world population grows and societies develop, the need to find and secure supplies of coal is becoming increasingly important. Furthermore, as a major source of energy and main component of steelmaking, coal is a very sought and valuable commodity representing 29.6% of global energy needs and 42% of the world's electricity2. Several indicators demonstrate the importance and size of the coal industry. To begin with, production levels which had dropped because of the world's dependence on oil during the XXth century have been increasing quickly over the last decades. Furthermore, as figure 1 demonstrates, world coal production is expected to keep on growing rapidly for the next twenty years (Hook, Zittel and Aleklett, 2008, 43).
The world's major producers of coal, the Big Six (United States of America, Russia, China, India, Australia and South Africa) have been and will continue to be the main catalysts of this recovery (Hook, Zittel and Aleklett, 2008, 3). The sharp increase in coal production is also underlined by BP stating that from 2000 to 2010, total world production has jumped from 2352.5 to 3731.4Mtoe (BP, 2011, 32).
2 World Coal Association, “Coal Statistics,” World Coal Association,
2
Figure 1: World coal production forecast 1980-2100.
Source: Hook, Zittel and Aleklett, 2008
The second indicator of the importance of coal is its demand on world markets. As supply and demand are always trying to balance themselves, the increase in production mentioned previously is a clear indication of the strong and sustained demand for coal. The demand for coal has been increasing rapidly since 2000. Driven by the development of emerging countries like China and by the sustained needs of Japan and the European Union, the coal industry is having a hard time meeting demand. For example, the demand for coal products went from around 2750Mt per year in 1980 to more than 5000Mt per year in 2005 (Kavalov and Peteves, 2007, 14). According to the forecasts presented in table I, the demand for coal will grow more rapidly than any other source of energy in the years to come (with the exception of the other renewable category). In 2030, the demand for coal will even allow it to overtake oil as the world's most important source of energy.
3
Table I: World energy demand by type, 1980-2030 (Mtoe).
1980 2000 2007 2015 2030 2007-2030 Oil 3107 3655 4093 4234 5009 0.9% Coal 1792 2292 3184 3828 4887 1.9% Natural gas 1234 2085 2512 2801 3561 1.5% Biomass 749 1031 1176 1338 1604 1.4% Nuclear 186 676 709 810 956 1.3% Hydroelectricity 148 225 265 317 402 1.8% Other & renewable 12 55 74 160 370 7.3% Total 7228 10018 12013 13488 16790
Source: International Energy Agency, 2009
Again, BP presents similar conclusions when stating that world consumption of coal as gone from 2399.7Mtoe in 2000 to 3555.8Mtoe in 2010 (BP, 2011, 33).
The importance of coal can also be seen through the evolution of the price of coal on international markets. Following sustained demand over the years, coal prices have been steadily increasing. The price of coal is a very important indicator because more than production or demand, it gives a precise evaluation of the value given to coal. On all markets studied by BP during a 20 years period from 1990 to 2010, coal prices have gone up by more than 100%. On the Northwest Europe market, average prices went from 43.48$ to 92.50$ a tonne, on the US Central Appalachian coal spot market, average prices went from 31.59$ to 71.63$, on the Japan coking coal import market, average prices went from 60.54$ to 158.95$ and finally, on the Japan steam coal import market, averages prices went from 50.81$ to 105.19$ (BP, 2011, 30).
The last indicator of the growing importance of the coal industry is the growing level of complexity in the coal trading business. The growth in both production and demand has brought new players in the business. Countries like China who had once been exporters are now entering the import market to satisfy their enormous needs for coal. Furthermore, recent natural disasters that have underlined the risks associated with nuclear power plants meltdowns have also increased the demand for coal as a cheap and safe fuel to provide electricity. Those changes
4
have modified the system of the coal trading business. As the number of players active in coal trading has increased, a multi-partner system has emerged where exporters have more clients and importers have more suppliers than before.
These four indicators: increasing production levels, increasing demand, increasing prices and a new multi-partner trading system have had important consequences for the coal industry in general. Competition is now stronger than ever in the industry for both suppliers and buyers. Indeed, coal exporting countries are engaged in fierce competition to secure new markets and attract new customers. On the other side, coal importing countries with increasing needs for coal are competing for contracts with suppliers struggling to meet demands. Such competition has been particularly difficult for coal exporting countries, forcing them to maintain high standard and levels of efficiency to keep up with demands and avoid losing market shares to competitors. In this context, logistics has become extremely important. As efficient operations depend first and foremost on effective logistics systems, the key to success for all coal exporting countries is high quality logistics systems.
1.2 Objectives
While the current reality in which the coal industry is operating offers many opportunities for growth, profits and success, high levels of competition make it necessary for coal exporters to rethink their operations and invest in their logistics sector. According to the Council of Logistics Management, “logistics is that part of the supply chain process that plans, implements and controls the efficient, effective flow and storage of goods, services and related information from the point-of-origin to the point-of-consumption in order to meet customers’ requirements” (Brewer, Button and Hensher, 2001, 101). Despite its complexity, the coal industry’s logistics chain can be summarized by the linking of seven stages as shown in figure 2. As mentioned in section 1.5, only the first three stages of the chain will be considered by this paper.
Figure 2: The coal industry chain of logistics.
Competition can have negative impacts on the activities of coal exporters. For instance, decreasing levels of demand and losses of market shares will result in decreasing levels of production and profitability. A possible way to deal with those negative impacts is to improve the logistics sector through better supply chain management practices. The improvement of the logistics sector is not only a matter of investing more money and building more infrastructures. It is, first and foremost, a question of measuring, monitoring and maintaining the system’s resilience. Resilience is one of the most important factors in the success of a system because, more than anything, a high level of resilience is the best way to make sure that the logistics chain will function at full capacity as often as possible for as long as possible. A system’s resilience is defined as follows: «Given the occurrence of a particular disruptive event (or set of
Point of consumption
Unloading Storage Consumption
Railway transport (if necessary)
Transportation
Port activities
Unloading Storage Loading
Maritime transport Port activities
Unloading Storage Loading
Railway transport
Transportation
Extraction
6
events), the resilience of a system to that event (or events) is the ability to efficiently reduce both the magnitude and duration of the deviation from targeted system performance levels» (Vugrin, Warren and Ehlen, 2010, 3). It can also be defined as a system’s capacity to foresee and anticipate the changing nature of potential risks and its ability to defend itself against those risks before negative consequences can happen (Therrien, 2010, 155). In other words, the first definition refers to the concept of recovery while the second definition refers to prevention. Therefore, the hypothesis of this paper is that if resilience is taken into consideration and actions undertaken to maintain it, the logistics chain of the industry can create benefits that will reduce the negative impacts of competition and help coal exporting operations to remain ahead of their competitors.
The main objective will be to show examples, based on the operations of three important coal exporting countries, of resilient logistics operations that decision makers will be able to use as up-to-date and efficient tools to remain ahead of the competition. To do so, the following three core variables will be studied: infrastructure, environmental hazards and governance.
The whole idea will be to show whether or not the coal logistics chains in Canada, Australia and South Africa are based on the concept of resilience. For the infrastructure variable, this will be done by analyzing the impacts of capacity of ports and railways on the fluidity and resilience of the chain. For the environment variable, this will be done by analyzing the impact of seismic, hydrologic and atmospheric hazards (Mansouri, Nilchiani and Mostashari, 2010, 1127) on the fluidity and the resilience of the chain. For governance, this will be done by evaluating the impacts of planning and development, corporate concentration and market segmentation on the resilience of the chain. In the end, the situations where the logistics chain showed the highest level of resilience will be identified as the most effective ways of improving logistics and remaining ahead of the competition. The method used to measure resilience levels will be explained in section 1.5.
1.3 Research questions
This paper includes three research questions that help present an accurate picture of the industry in the context of the three variables identified previously. Accordingly, each variable is analyzed by its own research question.
The first research question refers to the first variable: infrastructure.
How do infrastructure issues impact the resilience of the logistics chain? The second research question refers to the following variable: environment.
What risks do environmental hazards pose to the logistics chain? The last research question touches the third variable: governance.
Does the governance of the industry have a positive or negative influence on the resilience of the logistics chain?
For each question, answers will be provided for all three case studies. As stated in section 1.2, the situations that will prove to be the best examples of resilience will be selected as examples to follow. Thus, these examples will be vital to present realistic guidelines on what can and must be done to ensure the on-going development and well-being of the coal industry despite increasing levels of competition.
1.4 Review of literature
Among the various scientific articles, governmental reports, none-governmental organizations reports, private company’s annual reports and other articles that have been written on the coal industry, the topic at hand has rarely been thoroughly tackled. Furthermore, a comparative, in-depth study concerning the logistics sector of three of the most important coal producers is hard to find. Comparative studies of this kind represent, at best, a fraction of the publications found in the literature. Therefore, this paper not only brings a new look into the international coal industry, it also acts as a pioneer in an unexplored topic of the literature, namely: What examples of resilient logistics chains do decision makers of the coal industry need to follow to face the challenges of the coal trading business? The various articles that form the literature are grouped in five categories: one for the core concept of resilience, one for the concept of performance indicators and for each variable.
1.4.1 Resilience
The idea of resilience or improving resilience has been the main focus of an increasing number of scientific articles since 2001. The literature has become more abundant following the September 11th 2001 terrorist attacks in the United-States. This trend can, to some extent, be explained by the importance given to the protection of our societies' essential infrastructure systems (Therrien, 2010, 154). U.S. governmental publications are common throughout the literature since many of the country's institutions are now paying close attention to the study of resilience. Thanks to the initiative of the Department of Homeland Security's Critical Infrastructure Task Force, resilience “became a national priority as the task force made critical infrastructure resilience its top-level strategic objective. [...] As a result of this shift, the federal government has started a coordinated set of resilience initiatives to understand what features create resilience in critical infrastructures/key resources and has initiated calls to agencies to start measuring the resilience of their infrastructure systems” (Vugrin, Warren and Ehlen, 2010, 2).
The concept of resilience is a broad term that can be applied to various systems, networks, infrastructures or industries. For instance, resilience has been studied in publications concerning financial systems, telecommunication systems, emergency response systems, transport systems
9
and many more (Therrien, 2010, 160). Closer to the themes addressed by this research paper is the study of the relationships between Maritime Infrastructure Transportation Systems (MITS) and resilience. Here, the literature is both abundant and exhaustive, but seems to focus on container terminals more than bulk terminals. Nevertheless, in the field of maritime transportation, most of the recent literature on resilience tries to develop a Risk Management-based Decision Analysis. Such publications “guide the decision-makers to identify, analyze, and prioritize risks involved in PIS (Port Infrastructure Systems) operations; to define ways for risk mitigation, plan for contingencies, and devise mechanisms for continuously monitoring and controlling risk factors and threats to the system; and to value the adopted resilience investment plans and strategies” (Mansouri, Nilchiani and Mostashari, 2010, 1125). Again, these publications usually analyze the resilience of MITS in a similar way. For instance, robustness, flexibility, adaptability, agility and alignment are mentioned by many specialists as the most important qualities of a resilient system (Lee, 2004, 1). Likewise, the framework used to improve resilience is also a common theme of the literature; it consists of the following steps: assessing vulnerabilities, devising resilience strategies and valuing investment strategies (Mansouri, Nilchiani and Mostashari, 2010, 1126). In the first step, risks or threats to the systems are often separated in four groups: natural disasters, organizational factors, technological factors and human factors (Mansouri, Mostashari and Nilchiani, 2010, 7).
1.4.2 Infrastructure
The literature centered on infrastructure issues is by far the most abundant. Unlike the governance and environment questions, sources of information that deal directly with matters of infrastructure capacity can easily be found. The vast majority of this literature is made of reports published by the private sector or of scientific articles published by specialists or interests groups. In today’s literature, scientific articles and company reports focus on three sub-topics.
The first theme is the increase in the East-Asian demand for coal and the effect of that demand on the logistics sector of the exporting countries. As a result of the Chinese demand for coal, exporting countries will have to invest massively in the development of every link of the chain to keep up with it. According to most sources, production is expected to grow more slowly than
10
demand resulting in higher prices on global markets over the next years (Eby Konan and Zhang, 2008, 397).
The second theme is the whole question of capacity and inventory problems that affect the fluidity of the logistics chain due to delays, traffic or poor supply chain management. Even if all coal producers are affected by such problems now and then, Australia’s industry seems to be particularly touched by delays and traffic. According to specialists from the Griffith University in Australia, “unanticipated demand, especially from Asia, and the lack of investment in infrastructure within all of the components in the Hunter Valley coal chain has resulted in bottlenecks and capacity constraints leading to an extensive vessel queue off the port of Newcastle” (Zacarias, Fisher and Gapp, 2008, 2).
The third theme that dominates the literature is the dwindling of coal reserves due to increased levels of consumption and numerous downgrading assessments of reserves and resources in many countries. In an article entitled The end of cheap coal, the authors mention how “recent studies suggest that available, useful coal may be less abundant than has been assumed – indeed that the peak of world coal production may be only years away” (Heinberg and Fridley, 2010, 367). While this statement might be true, some countries, Russia for instance, still have large reserves and will not hit peak production for many years. Nevertheless, most articles forecast a possible restructuring of the logistics chain. Such changes will have a direct impact on the necessary capacity of present and future storage sites.
1.4.3 Environment
The relationship between the environment and the coal industry is also the topic of many publications. Among the many reasons that explain the rising levels of concern and interest for the protection of the environment, global warming and its harmful impacts on the coal industry and on society in general have been the central topic of a growing number of publications. For this reason, many scientific articles have been written on topics related to the environment and the coal industry. Governments, research groups and private companies have also published their share of articles, owing to a generalized concern for the importance of sustainable development and sustainable practices. The relationship between the coal logistics chain and the environment touch the following themes.
11
First of all there is an important amount of publication on new environmentally friendly technologies, but more precisely, greenhouse gas mitigation measures. Hence, carbon capture and storage (CCS) has become one of the most promising new technologies. “According to the International Energy Agency, widespread deployment of CCS could account for one-fifth of the needed global reduction in emissions by 2050” (Bowen, 2009, 6). CCS is currently used in many countries in an effort to reduce the negative environmental impacts of the coal using industries. For instance, “coal forms 65% of South Africa’s primary energy supply as well as 95% of the electricity. As the principal indigenous energy source [...] the use of coal is forecast to increase. Therefore, carbon capture and storage is being investigated as a mitigation measure for carbon dioxide emissions. Such a measure is seen as a transition until renewable and nuclear energies can displace fossil fuel energy” (Surridge and Cloete, 2009, 2744). While CCS does not directly involve the upstream part of the coal logistics chain, it is nevertheless pertinent. If CCS establishes itself as a proven effective method of reducing greenhouse gas emissions, a growing number of countries might turn to coal fired thermal plants for the production of electricity. As a result, worldwide demand would increase and coal exporters would need to invest in the development of their infrastructures to keep up.
Similarly, the literature also includes many publications that focus on more indirect methods of reducing greenhouse gas emissions. In this regard, emissions trading and tax policies are the most frequently cited methods. The first method, emissions trading, has been implanted in many regions and is believed to be “theoretically more efficient than regulation. However, there is a strong argument in the literature that emissions trading is less efficient than taxes in the reality of high levels of uncertainty and incomplete information” (Tyler, du Toit and Dunn, 2009, 11). On the other hand, other studies underline the importance of other regulations such as “pure carbon tax [...] on energy-intensive sectors like transport and basic metals. In general, the more targeted the tax to carbon emissions, the better the welfare results” (Devarajan, Go, Robinson and Thierfelder, 2009, II). Besides, one of the most serious and recent studies on this matter was published in June 2011 by the Centre for International Economics. The research considers “in detail the extent to which key coal (sea borne) exporting countries have either imposed, or plan to impose a constraint on fugitive emissions from coal mining as part of their overall approach to greenhouse gas mitigation policy” (Centre for International economics, 2011, 6). While those methods are in effect in many parts of the world, some countries like South Africa appear “to be caught in a time warp with a weak environment policy and a power
12
sector that continues to plan its future in the traditional way. The consequences are: a continued environmental degradation and a high-energy intensive economy with intermittent power supplies” (Sebitosi and Pillay, 2008, 2513).
Finally, the relationship between climate change and the industry is also an important theme in the literature. To be more accurate, the negative repercussions of climate change on the infrastructures are the focus of many publications. The underlying idea is that “by identifying and understanding vulnerabilities, stakeholders, practitioners and regulators can take pro-active approaches to reduce risk. However, our understanding of the implications of climate change for major industrial activities in Canada remains limited” (Pearce, Ford, Prno, Duerden, Pittman, Beaumier, Berang-Ford and Smit, 2011, 348). Recent natural catastrophes like the floods that hit Australia in 2010-2011 add to the importance of studies concerning the repercussions of climate change on coal infrastructures.
1.4.4 Governance
Governance is not a theme that is easily found in the literature. In fact, the publications that actually discuss this issue do so indirectly. The sources that only deal with matters of governance of the infrastructure and its impacts on the logistics chain are almost non-existent. Nevertheless, information on this issue can be found in some publications from the private sector and research groups. To be more accurate, when the governance of infrastructures is mentioned, two topics are usually discussed.
Governance is often studied with a financial approach. In this respect, it is mostly mentioned when new infrastructure projects are launched. For example, when the construction of a third coal exporting terminal on Kooragang Island for the port of Newcastle was announced in 2009, governance was an important aspect of the project. Actually, the project was to be led by Newcastle Coal Infrastructure Group (NCIG), a partnership of fourteen coal producers whose intention was to address capacity problems of the entire industry (Swanepoel, 2010). Furthermore, since the financing of the project will be shared by the government of New South Wales on one side and the partnership on the other, the ownership of the terminal will be split between the parties involved.
13
On the other hand, governance is also studied because of its impacts on capacity issues of port and railway infrastructures. The literature shows that a debate exists about whether shared use and shared governance of infrastructures is a good thing or not. For example, Port Warath Coal Services (PWCS) who operates two coal terminals in the port of Newcastle argues that “the CUP3 is constraining coal capacity because new entrants are diluting the volume of capacity from existing companies. But the industry argues that PWCS is obligated to produce increases in capacity of coal throughput at the port to meet the demands for their services” (Zacarias, Fisher and Gapp, 2008, 7). On the other hand, some publications also provide good examples of shared governance. Indeed, the network of infrastructures can sometimes be a good example of cooperation between small mining companies and major transporters like Canadian National (CN) or Canadian Pacific Railway (CP). As stated in Coal resources in British Columbia: opportunities, logistics and infrastructure, the governance of the infrastructure in the province is an example of a shared system that has proved its efficiency (British Columbia Ministry of Energy, Mines and Petroleum resources, 2010, 14).
1.4.5 Key performance indicators
4Throughout the literature, the most commonly studied indicators of performance are the Key Performance Indicators (KPIs). Similar to other performance measurements such as the result indicators, performance indicators and key result indicators, KPIs are more frequently used and analyzed than their counterparts. In many industries, KPIs have become effective ways of assessing a company's performance. The usefulness of key performance indicators has helped them become a common theme of discussion and study. Many publications have analyzed the applications of Key Performance Indicators KPIs in various industries, organisations or companies. Since KPIs can be used by any given group in any given field of activity such as education, healthcare, transportation, the construction industry or sales & marketing, they have become a valuable set of tools in the eyes of many. The most relevant publications usually
3 The common-user provision (CUP) is a condition under the lease agreement between the Minister of
Public Works and Services of New South Wales and PWCS (Lease 844348K under the Real Property Act 1900 (NSW)). The CUP requires that PWCS “(M)ake available its services to any and every shipper of coal through the Port of Newcastle…under conditions and at a cost for like services that are not discriminatory as between user…” (Zacarias, Fisher and Gapp, 5)
4
14
include a section on the goals and requirements of effective KPIs. For example, organisations often evaluate their performance using indicators or data that are based on past events and measures. The problem is that such indicators offer little insight on the organisation's future situation. In this sense, winning indicators are useful because “they can not only illuminate where the organization is today but project where the organization will be and provide stability into where key individuals can engage to correct the course for the organization if the forward-looking KPIs are off-track” (Paulen and Finken, 2009, 38). Publications on the subject usually agree on the characteristics and the definition of KPIs which should be, first and foremost, a non-financial data (Vance, 2009, 145). In the case of the coal industry, KPIs are commonly published in internal publications. However, there seems to be a lack of scientific publications based on the use of KPIs analyzing the performance of the industry.
In conclusion, this review of literature has made it clear that the various publications that concern the coal industry do not really study the importance of resilience. In fact, the majority of the literature is more concerned about the environmental impacts of the coal industry or the infrastructure's ability to sustain the rising levels of demand. While publications on resilience exist, they usually only concern the maritime industry and, more specifically, container transportation. The issue of resilience throughout the coal industry's logistics chains remains to be studied. For this reason, this paper can be considered as a first step in that direction.
1.5 Methodology
The international coal industry is a vast and complex system where the increase in activity has allowed logistics networks to be increasingly connected to one another. For this reason, it is almost impossible to study the industry in one country without mentioning or noticing outside influences. Keeping this in mind, this research is limited to three case studies. The three countries studied in this research have been chosen because together, they represent the most common examples of coal exporting countries. Canada, Australia and South Africa are very different coal producers and exporters. Canada's reality is that of a minor player on the world stage with export levels inferior to most coal exporting countries. South Africa represents a player of medium importance. Even if the country is part of the Big Six, it only has 8.6% of world reserves (Hook, Zittel and Aleklett, 2008, 3). On the other hand, Australia is a much bigger and important player on the world stage. With 233 million tons exported in 2006, it «is by far the world’s leading coal exporter» (Hook, Zittel and Aleklett, 2008, 3). In other words, these countries have different realities and, based on the size of their coal industry, they may have different problems or success stories. Furthermore, the dynamic of the logistics chain and its relation with outside influences are consequently not the same in each of the three countries. By selecting them, it is more likely to have an accurate view of what the logistics sector looks like in most of the coal producing countries.
Concerning the links of the logistics chain that were chosen for this research, it is important to realize that only the activities of the upstream section of the chain have been considered. Because coal production and exportation are the focus of this research, what happens after the coal has been exported by seaborne transport is irrelevant. Hence, only the issues that touch the following three links will be tackled: extraction, railway transport and port activities.
Geographic framework
The coal industry is usually made of a large and complex network of companies and operations scattered over large geographic areas. In exporting countries, more than one cluster of mines, rail networks and ports of exportation can usually be found. For the sake of clarity, this research uses geographic frameworks based on the idea of corridor. The reality of each country will be studied through the limits of these corridors. Table II summarizes the basic geographic features
16
of corridors that will be studied in this research. It is also important to mention that while most countries have more than one major port of exportation, the case studies of this research include the most important mining networks and port of exportation in terms of volume exported.
Table II: The coal exporting corridors.
Country Location of major mining networks
Location of the associated ports of exportation Australia Hunter Valley coal logistics
network in New South Wales5
Port of Newcastle (NCIG coal terminal, Kooragang coal terminal and Carrington coal terminal)
South Africa Mpumalanga province Richards Bay Coal Terminal (RBCT)
Canada British Columbia and Alberta Port Metro Vancouver (Westshore Terminals and Neptune bulk terminal)
Data Collection
The information and data used in this paper come from various sources, including scientific articles, publications from experts groups, annual reports and other publications from the private sector. The process of collecting and analyzing relevant data has been one of the most important tasks of this research. Due to the comparative nature of this research, the need to find comparable data for all three case studies was ever present. Furthermore, since each of the core chapters is based on very different variables, relevant data and information had to be collected from sources related to many fields of study. For example, most of the data contained in chapter 3, which is centered on the question of infrastructures, was found in annual reports, scientific articles and special publications by port authorities, service providers and consultants. This data usually contained technical information or operational data of various transport or
5
While as a whole, the state of Queensland might produce and/or export more coal than the state of New South Wales, the largest Australian coal exporting logistics chain is the Hunter Valley coal logistics chain which is found in New South Wales. For this reason, logistics networks in Queensland have not been considered in this paper.
17
terminal infrastructures. For chapter 4, most of the relevant data came from scientific articles in the fields of meteorology, seismology and hydrology. National scientific institutions such as Environment Canada, Geosciences Australia and the Council for Geosciences of South Africa also provided a wealth of valuable information. Again, chapter 5 was written with information taken sources containing data on corporate planning and development strategies, industrial assets and international coal markets. Here, annual reports and special publications of the private and public sectors on development strategies were the most useful sources of information. This being said, the task of gathering data from various sources of information was, in itself, not sufficient. To answer the needs of a comparative study, the collected information also needed to be sorted. This second step was necessary to ensure that all case studies could be evaluated and compared on similar criteria. The process of comparing and analyzing data was the final task of this research. The core research chapters of this paper were constructed thanks to this collect, sort and compare process.
Measuring resilience
A system’s ability to avoid failures caused by disruptive events and its ability to protect itself against potential risks before they happen is a notion that needs to be measured before it can be implemented. Furthermore, since the concept of resilience refers to the flexibility, robustness and efficiency of a system, the criteria used to measure it must be chosen accordingly. In many companies, performance levels of a system are measured using KPIs. Acting as operational level measurements, they help “achieve the overall objective of reducing costs within the supply chain” (Berman, 2006, 72). KPIs can be defined as “a set of measures focusing on those aspects of organizational performance that are the most critical for the current and future success of the organization” (Parmenter, 2007, 141). To be effective, they need to be kept to a manageable number. Moreover, KPIs need to be measured on a regular basis and need “to be reported in a timely manner”. By nature, they can be expressed as absolute numbers or ratios (Berman, 2006, 81). Hence, in the context of this research, the most critical aspects of organizational performance are:
18
1- The need to operate close to full capacity (without reaching it) as often as possible. While operating close to full capacity, the industry maximizes revenues. Therefore, an industry operating close to full capacity will gain positive outputs and comparative advantages over its competitors.
2- The need to maintain the level of fluidity6 of the logistics chain as high as possible. By taking the necessary steps to maintain fluidity in the chain, the industry reduces the likelihood and the impact of disruptive events on the system.
Both of those aspects are signs of a system’s resilience. By focusing on those two needs, the coal industry may take positive steps towards a more resilient system of operations and will increase its chances of success in the current economic context. However, KPIs can only be used to measure variables that are related to the productivity of logistics chain, but cannot be used when analyzing environmental hazards and governance. To be accurate, it is important to understand that analyzing natural hazards is in fact a way to assess the risks of external factors on the logistics chain and, as stated in section 1.4.1, assessing risks to a logistics chains is an important step in analyzing and improving resilience. In the same way, studying governance is in fact a way to assess the impacts of decisions, segmentation within the industry and the handling of power.
Therefore, the task of measuring resilience will not be based on KPIs as is usually the case since. The three core variables of this research cannot be studied by a single family of indicators. Since KPIs must be evaluated and reported on a daily or weekly basis, they are actually not designed to study the indicators chosen for this variable. For infrastructures, the indicators chosen (as seen further on in this section) must be reported on a monthly or quarterly basis which prevents the use of KPIs. For the second variable, assessing the impacts of environmental hazards on the logistics chain has nothing to do with performance or productivity. Such an assessment actually comes down to analyzing the risk that such hazards pose on the logistics chain and requires risk indicators. For the third variable, the relationship between governance and logistics chains has nothing to do with performance or productivity. It is in fact a way to measure the impacts of power structure, decision making and industry segmentation. In other words, in the third chapter of this paper, when the resilience of infrastructures will be analyzed, infrastructure
6 Fluidity refers to the ability of a system to move products through the various links of the chain without
19
indicators (IIs) will be used to analyze productivity and performance. In the fourth chapter, risk indicators (RIs) will be used to analyze the risk of environmental hazards for the logistics chains. Finally, in the fifth chapter, governance indicators (GIs) will be used to study the impacts of decision making, segmentation and power structure on the resilience of logistics chains.
The role of three groups of indicators will be to show how each variable affects the resilience of the logistics chain. Taken individually, they only analyze one side of resilience. However, taken as a whole, these indicators offer an accurate and much more complete understanding of the elements that affect a system's resilience.
To measure resilience, each II, RI and GI will be worth a maximum of three points. Each corridor will be given a score of one, two or three points depending on how resilient it proved to be for a given indicator. Points will be assigned in accordance to ranges and values that will be established for each indicators. The actual methodology is explained in detail in chapters 3,4,5 where the following indicators are used. The indicators used in chapters three, four and five are the following:
a) Infrastructure (IIs): Train capacity;
Capacity utilization of port infrastructures; Stockyard capacity; and
Loading equipment operating rates. b) Environment (RIs):
The vulnerability of the logistics chain to seismic hazards;
The vulnerability of the logistics chain to hydrologic hazards; and The vulnerability of the logistics chain to atmospheric hazards. c) Operational environment (GIs):
The efficiency of planning and development strategies;
The industry's corporate concentration in the extraction sector;
The industry's corporate concentration in the railway transportation sector; The industry's corporate concentration in the port activities sector; and The diversity of the industry's portfolio of clients on world markets.
20
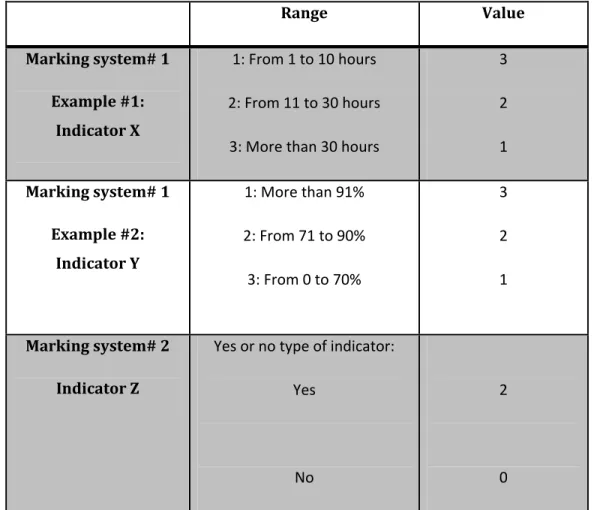
One of two different marking systems will be used to award scores for each indicator. Each indicator will either have two or three possible values as shown in table III. The indicators and ranges of table III are only random examples, but its value system will be used for all indicators7. Concerning the possible categories of ranges, the literature has provided the necessary data to establish ranges for each indicator.
Table III: The possible marking systems used to award scores in each of the indicators.
Range Value Marking system# 1 Example #1: Indicator X 1: From 1 to 10 hours 2: From 11 to 30 hours 3: More than 30 hours
3 2 1 Marking system# 1 Example #2: Indicator Y 1: More than 91% 2: From 71 to 90% 3: From 0 to 70% 3 2 1 Marking system# 2 Indicator Z
Yes or no type of indicator: Yes
No
2
0
7 Depending on the wording of the question, the value system for “Yes or No” questions could also be
1.6 The scope and limits of this study
As one of the most dynamic sectors of the mining industry, the coal industry has to be examined on a worldwide scale. Moreover, the nature of this industry can be explained by geographic and economic factors. Unlike other fossil fuels, such as oil or natural gas, coal reserves are still abundant and spread in many regions of the globe. Accordingly, the various activities associated with the coal industry take place in many regions and countries around the world giving it a global and international character. Likewise, the nature of the coal industry, based on the activities of the various actors at every level of the logistics chain, also needs to be approached on a world-wide scale.
World coal transactions amongst the various actors located all around the world are possible by the use of large bulk carriers. The business of trading and moving coal has become a matter of global importance. “Since 1970 world coal demand has increased by more than 60 percent, which is even faster than the increase of world demand for oil, but the most significant increase has though been on the world market of traded coal, which increased by over 230 percent during the same period. This development has, during recent years, led many analysts to consider the international coal market as an essentially unified global market” (Warell, 2006, 1). For this reason, the coal industry cannot be studied by using only a local, regional or even national scale. The mechanisms that are inherent to this industry’s logistic chain are more often than not, influenced by worldwide factors.
For any undertaking, the improvement of the logistics sector is a logical procedure because it allows a permanent reduction in costs and time wasted due to inefficiencies. In other words, the improvement of the logistics sector is just like optimizing of a computer or repairs on a car after a maintenance check. It is a useful operation because it has the ability to improve performance and reduce costs in the long-term. In this regard, this research paper will not only be useful because it will contribute to the advancement of the research in the logistics sector for the coal industry, but mainly because it will be a useful tool for governments and private companies to plan future investments and modifications in the logistics sector of the industry.
The difficulty to find and use indicators that can evaluate every variable of a system's resilience is the most important limit of this study. Since performance, risk and governance cannot be evaluated by a single family of indicators, the resilience of logistics chain can only be evaluated separately for each variable. In the same way, the inability of KPIs to evaluate variables other
22
than performance has made it more difficult to analyze the second and third core variables. To overcome this limit, indicators suited to the nature of each variable have been created. The lack of scientific research on the resilience of logistics chains in the coal industry has also been a limit to this study since the methodology and results of this paper cannot be compared to previous comparative studies of resilience in the coal industry.
Chapter 2: Australia, South Africa and
Canada’s export corridors.
2.1 First Case Study: Australia’s export corridor.
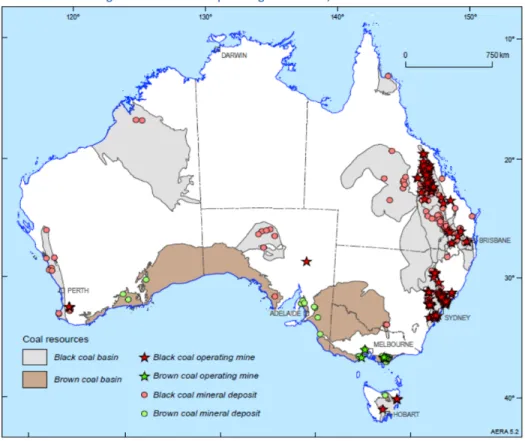
As the fourth largest producer and largest coal exporting nation in the world, Australia is a major player in the world coal market. The country’s rise to the top can be explained by the abundance of low-cost high quality reserves of both metallurgical and thermal coal. Based on 2010’s assessments, the country’s reserves of black coal were evaluated at 44 billion tonnes or 7% of the world’s total (Australian Coal Association, 2011, 1). Similarly, Australia’s coal resources were estimated at 308.1 Gt. Therefore, the importance of the nation’s reserves could allow it to remain a major player for many years to come (Australian Bureau of Agricultural and Resource Economic Sciences, 2011, 142).
Figure 3: Australia's operating coal mines, December 2008.
24
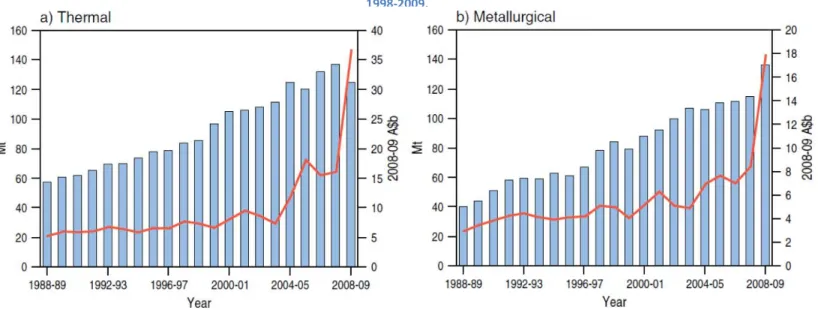
In 2007-2008, Australia produced a total of 421Mt of black coal of which it exported 252Mt on the world market (Hook, Zittel and Aleklett, 2008, 34). Similarly, Australian coal exports in 2008-2009, which amounted to 262Mt, went to Japan (40%), South Korea (16%), India (10%), Taiwan (10%), China (10%) and the European Union (6%) (Australian Coal Association, 2011, 1). The quality of the country’s reserves of both thermal and metallurgical coal8 has allowed the industry to export high volumes of both types of coal over the years. Figure 4 shows how export volumes and value (the red line represents the value of exports in A$b) have been constantly rising for twenty years between 1988 and 2009.
Source: Australian Bureau of Agricultural and Resource Economics and Geoscience Australia, 2010
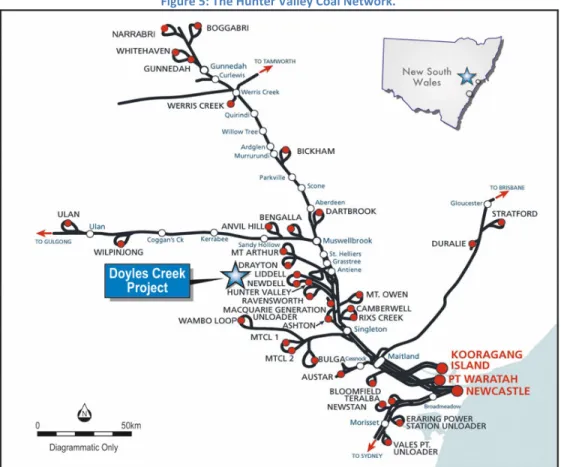
The states of Queensland and New South Wales accounted for the majority of this production: 57 per cent and 41 per cent respectively (Australian Bureau of Agricultural and Resource Economic Sciences, 2011, 146). The concentration of Australia’s coal mines in those two states is clearly shown in figure 3. The first case study of this research is based on a segment of the New South Wales mining cluster commonly referred to as the Hunter Valley Coal Network. Located in the Sydney basin, one of the largest coal basins of the country, the Hunter Valley Coal Network, as shown in figure 5, is controlled by the Hunter Valley Coal Chain Coordinator Limited (HVCCC).
8 Steam coal and thermal coal are synonyms that designate coal that will be used in power plants to
create electricity. Similarly, coking coal and metallurgical coal are synonyms that designate coal that will be used in steel mills to create steel.
Figure 4: Australia’s export volumes of thermal and metallurgical coal, 1998-2009.
25
Figure 5: The Hunter Valley Coal Network.
Source: NuCoal, 2011
Made up of coal producers and service providers, it is “the largest coal export operation in the world”9 whose major highlights are:
• Approximately 35 coal mines owned by 13 coal producers; • Two Coal Terminals with a 3rd Terminal under construction; and
• The movement and loading of more than 1000 coal vessels/year from the Coal terminals through the Port of Newcastle10.
This dense network of mines and railways stretches several hundred kilometres inland with its base at the Port of Newcastle which is the busiest coal exporting port in the world. Figure 5 gives a general overview of the mining sites and railways under the jurisdiction of the HVCCC.
9 Hunter Valley Coal Chain Coordinator, “History,” Hunter Valley Coal Chain Coordinator,
http://www.hvccc.com.au/AboutUs/Pages/History.aspx (accessed November 2, 2011).
10
2.2 Second case study: South Africa’s export corridor.
According to a 2010 report published by the Department of Energy of the Republic of South Africa, the country’s proven coal reserves are estimated at 48Gt or 5.7% of the world’s total coal reserves (Moses Maleka, Mashimbye and Goyns, 2010, 22). However, even if the country’s reserves seem abundant, South African coal suffers from a certain number of disadvantages. First, the industry has access to average quality deposits since “South African coal is nearly all bituminous, with very little anthracite. It is generally of low quality with high ash content” (Moses Maleka, Mashimbye and Goyns, 2010, 22). Furthermore, the remaining low-grade reserves are more difficult to mine compared to past decades. Since the biggest sites have already been exploited, current and future mining operations will be “smaller and more complex” (Hook, Zittel and Aleklett, 2008, 36). Finally, South Africa’s low grade coal usually goes through a washing process to improve its quality for the international market. However, such a process is problematic since coal washing results in a portion of the production being transformed into unusable coal discards. Moreover, since coal discard is essentially made of impurities it cannot be used and is therefore stockpiled (Hook, Zittel and Aleklett, 2008, 36). While the washing of coal has allowed the industry to overcome the disadvantage of low-grade coal, low pit head costs and low sulphur levels add to its competitive advantages (Moses Maleka, Mashimbye and Goyns, 2010, 29).
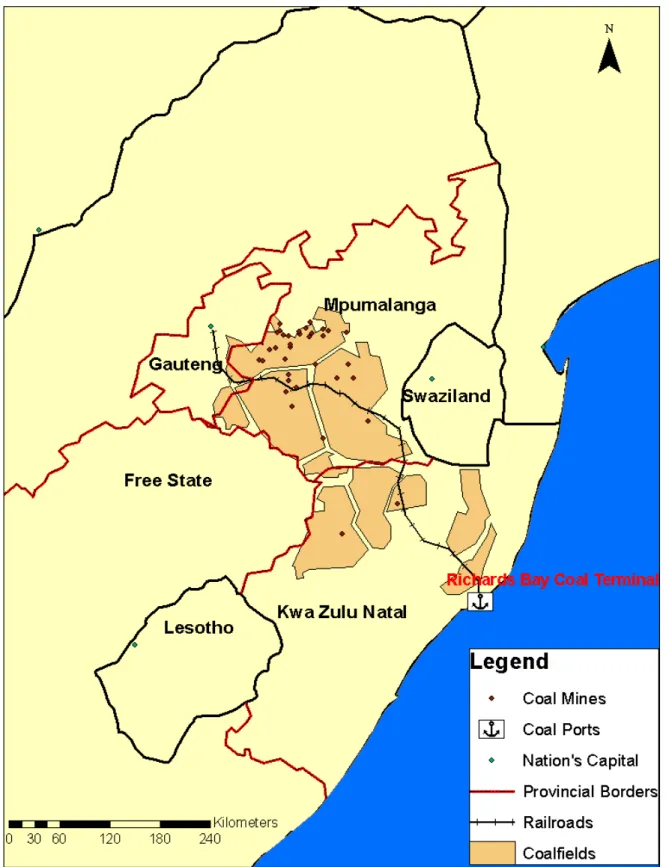
As shown in figure 6, the country’s main mining cluster is located in the Mpumalanga province which accounts for 83.8% of South Africa’s production (Winkler, 2006, 46). This mining cluster, the railway network used by coal trains and the port of Richards Bay which exports most of the country’s coal represent the geographic framework of the corridor studied in this research. Although the number of mining operations exceeds 50, a small number of key players control most of the production. The country’s main market for exportation is Europe, which accounts for approximately 60% of total exports, while the remaining exportations go to countries located in the Pacific region. The main product of exportation is bituminous grade steam coal since South Africa’s production of coking coal is almost non-existent (Maleka, Mashimbye and Goyns, 2010, 25). Production of coal in South Africa is expected to keep on growing until 2020 at a production peak of 284Mt / year (Hartnady, 2010, 1).
27
Figure 6: An overview of the Mpumalanga coal corridor.
28
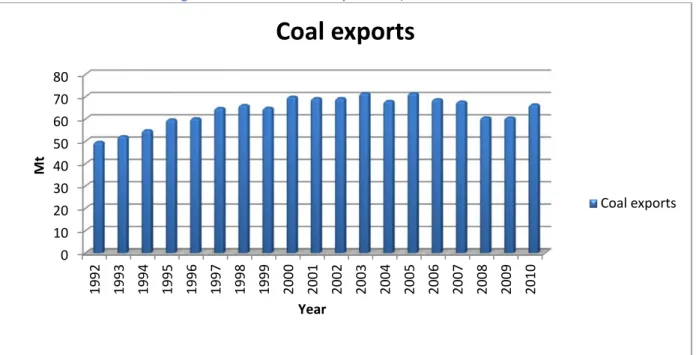
As shown in figure 7, coal exports have risen from 50Mt in 1992 to more than 70Mt in 2005. Since then, export levels have dropped and remained stable between 60 and 68Mt. Since total production volume in 2010 had already reached 254.52Mt (Chamber of mines of South Africa, 2011, 17), South Africa’s production is expected to grow slowly until it reaches peak production in 2020. Thus, export levels should also keep on growing slowly until 2020.
Figure 7: South Africa's coal exportations, 1992-2010.
Sources: (Subramony, Jeff et al, 2009) and (Chamber of mines of South Africa, 2010)
0 10 20 30 40 50 60 70 80 19 92 19 93 19 94 19 95 19 96 19 97 19 98 19 99 20 00 20 01 20 02 20 03 20 04 20 05 20 06 20 07 20 08 20 09 20 10 Mt Year
Coal exports
Coal exports2.3 Third case study: Canada’s export corridor.
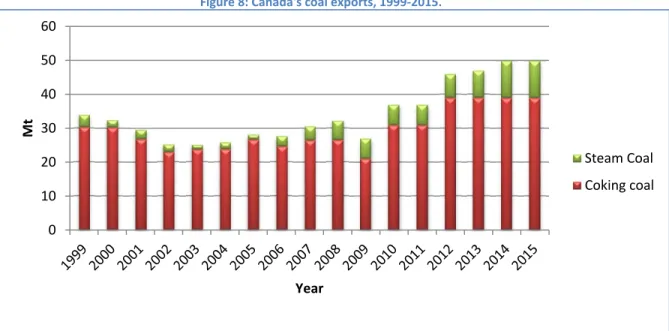
According to BP’s statistical review of World Energy 2011, Canada is currently the 13th most important coal producing nation in the world (BP, 2011, 32). With productions of 69.1 Mt in 2007 and 67.8 Mt in 2008, Canada has managed to keep its position among the world's top coal producing countries (Stone, 2010, 25). Canada can be seen as a small to medium coal producer and exporter. The country possessed about 6.6 billion tons of proven recoverable coal reserves (0.74% of the world's 2008 proved recoverable reserves (World Energy Council, 2010, 10)) and 193 billion tons of resources11 (Stone, 2010, 2). With such abundant resources, the Canadian coal industry could remain in operation for many years to come. However, as stated in «A supply driven forecast for the future global coal production», «the last assessment of the coal reserves was conducted in 1987» (Hook, Zittel and Aleklett, 2008, 39). The industry could therefore benefit from updated assessments of coal reserves for future planning and development. Coal production in Canada is mainly used for domestic purposes. In 2008, only 40% of the country’s production was exported. Coking coal represented more than 80% of the exports since Canada’s energy demands required most of the national production of thermal coal (Stone, 2009, 5). Figure 8 shows two important realities linked to Canadian coal exportations. First, coking coal has always accounted for most of the exports. Second, overall export levels have been rising since 2003 and are expected to follow this trend until at least 2015.
In 2008, Canada exported coal to three major markets namely Asia (63% of total exports), Europe & the Middle-East (22% of total exports) and Americas (15% of total exports) (Stone, 2009, 14). In 2009, there were 22 operating mines in Canada located for the most part in the provinces of British Columbia and Alberta. Furthermore, a few mining companies have ongoing mine development projects that should increase the number of operational mines and the national production capacity in the upcoming years.
11 «The logic of distinguishing between reserves, which are defined as being proved and recoverable, and
resources, which include additional discovered and undiscovered inferred/ assumed/ speculative
quantities, is that over time production and exploration activities allow to reclassify some of the resources into reserves» (Energy Watch Group, 2007). In simpler terms, the word resources is used for coal we think we have while reserves is used for coal we know we have.
30
Figure 8: Canada's coal exports, 1999-2015.
Source: (Kevin Stone, 2009 Coal report, 2009) and (Kevin Stone, Coal in Canada, 2009)
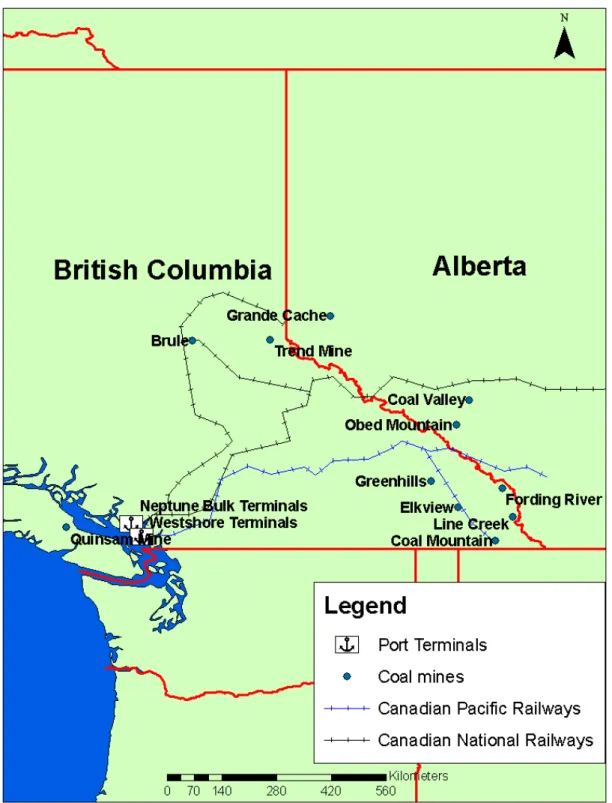
Most coal mines extract thermal coal which is sent to power plants across the country. As a result, not all mines in operation are active on the export market. Stretching across the provinces of British Columbia and Alberta, Canada's coal corridor includes 11 of the country's 22 mines. As shown in figure 9, two main coal railways link the corridor's mines to Westshore Terminals and Neptune Bulk Terminals, both located in Port Metro Vancouver.
0 10 20 30 40 50 60 Mt Year Steam Coal Coking coal
31
Figure 9: An overview of Canada's coal corridor.