OPTICAL MICROCAVITIES FOR REAL-TIME DETECTION OF BACTERIA
HALA GHALI
DÉPARTEMENT DE GÉNIE PHYSIQUE ÉCOLE POLYTECHNIQUE DE MONTRÉAL
THÈSE PRÉSENTÉE EN VUE DE L’OBTENTION DU DIPLÔME DE PHILOSOPHIÆ DOCTOR
(GÉNIE PHYSIQUE) JUIN 2016
c
OPTICAL MICROCAVITIES FOR REAL-TIME DETECTION OF BACTERIA
présentée par : GHALI Hala
en vue de l’obtention du diplôme de : Philosophiæ Doctor a été dûment acceptée par le jury d’examen constitué de :
M. LEBLOND Frédéric, Ph. D., président
M. PETER Yves-Alain, D. Sc., membre et directeur de recherche M. BIANUCCI Pablo, Ph. D., membre et codirecteur de recherche M. GERVAIS Thomas, Ph. D., membre
DEDICATION
provided in the optics field, and for being available to answer any questions or doubts I had throughout the project. I also thank all my colleagues with whom I had the pleasure to work all these years. I thank Francis Vanier for his help with the optics part of the project and for his encouragements when I needed them, Antoine Leblanc-Hotte who was always concerned about our health and safety in the laboratory, and for being the cheerful soul in the lab. A special thank you to Tassadit Amrane who was a very much appreciated feminine presence in the lab during my first years. We had really great times together. I also thank Leandro, Jérémy and all the former members of the microphotonics laboratory with whom I had such a bless working in this group.
I also thank the LMF staff who accompanied me since the beginning of my masters and were there every step of the way, Christophe, Marie-Hélène, and a special thank you to Alireza who was always a great friend.
A big thank you to all my family, Jana, Jeddo, Thouraya, Samia who always was and will be an inspiration for me, and especially my parents, Ikram and Mohammad, for giving me this opportunity to travel and fulfill my dreams thousands of kilometers away from them. You are the greatest parents in the world, I could have never achieved what I did without your support and trust. I hope I made you proud of me ! My little sister, Hanine, you are my best friend and it was so hard being away from you all these years, but you still gave me the strength to carry on. My little brother, Saleh, I love you. A special thanks to my aunt Rose, who was my inspiration. I wouldn’t be here without her. Unfortunately, cancer took her away before she could see me graduate, but I know she will always be around. She was always a strong confident woman who inspired us and taught us that all dreams can come true. I love you and I will miss you so much our angel.
Last but not least, thank you to my husband, Benoit, who was by my side during all these years. Thank you for your love and support, and for being here when I needed you most. I love you with all my heart.
RÉSUMÉ
Au cours de la dernière décennie, les microcavités à mode de gallerie ont fait le sujet de plusieurs études où elles sont utilisées comme biosenseurs sans marquage. Leur capacité à confiner la lumière pendant un certain temps leur confère des facteurs de qualité élevés, donc une très bonne sensibilité face aux molécules qui s’attachent à leur surface.
Ce projet de doctorat s’intéresse aux microdisques optiques pour la détection de bactéries, plus spécifiquement la bactérie Staphylococcus aureus (S. aureus). À notre connaissance, c’est la première fois que des bactéries sont détectées spécifiquement avec des microdisques optiques. Afin d’obtenir un biosenseur fiable et efficace, il est important qu’il présente une grande sélectivité face aux bactéries d’intérêt. Pour réaliser cette bonne sélectivité, la surface des microcavités doit être proprement fonctionnalisée. La fonctionnalisation consiste à choisir les anticorps qui sont spécifiques aux antigènes qui seront détectés. Dans ce cas, le choix des bactériophages spécifiques à la détection de la bactérie S. aureus a été fait après plusieurs séries d’expériences avec différents bactériophages. Puisque les étapes de préparation et de purification des bactériophages peuvent être longues et compliquées, l’isolation de protéines spécifiques des bactériophages s’est avérée plus appropriée. Le procédé de fonctionnalisation utilisé dans ce projet a été développé en collaboration avec le groupe de la professeure Jay L. Nadeau du département de génie biomédical à McGill. Des phages protéines LysK vont attacher les bactéries S. aureus lors des expriences de détection en temps réel. Plusieurs expériences ont été réalisées en utilisant la bactérie E. coli afin de démontrer la spécificité du procédé de fonctionnalisation utilisé. Comme prévu, la LysK était spécifique à la S. aureus et n’a pas attaché de bactéries E. coli.
L’attachement des bactéries sur la surface du résonateur est observé grâce au déplacement des pics de résonance vers les plus longues longueurs d’onde, un mécanisme connu sous le nom de principe réactif de détection (reactive sensing principle). Ce déplacement permet d’en apprendre davantage sur le lien qui se forme entre les protéines et les bactéries. Pour une concentration de bactéries 5.109 cfu/ml, un déplacement de 0.22 nm a été observé. En
diminuant cette concentration, le déplacement lui aussi décroît, car moins de bactéries s’at-tachent aux sites sensibles du microdisque. Une formulation théorique de ce principe, utilisant l’expression approximative du champ électrique dans un microdisque, a également été déve-loppée pour la première fois dans cette thèse afin de relier le déplacement de résonance avec le nombre de bactéries qui s’attachent à la surface ainsi que la cinétique de la liaison entre les bactéries et les protéines. Les résultats ont permis de déduire que l’attachement de bactéries
la nourriture. Les avancements dans le domaine de l’optique et la microfluidique permettent aussi d’intégrer des éléments comme les guides d’onde ou les canaux fluidiques sur la même puce afin d’obtenir un biosenseur complet et robuste prêt à être commercialisé.
ABSTRACT
Researchers showed a lot of interest in studying whispering gallery microcavities as a tool for biosensing in the last decade. Optical microcavities are structures that confine light at the microscale due to total internal reflection of light at the interface between the cavity and its surrounding medium. If a molecule binds to the surface of the microcavity, light can interact with it several times, making optical microcavities very sensitive tools for label-free sensing. During this Ph.D. project, optical microdisks are used to detect the presence of Staphylococ-cus aureus (S. aureus) bacteria. To our knowledge, this is the first time optical microdisks are used to specifically detect bacteria. In order to have a reliable and efficient biosensor, it needs to be highly specific. Specificity is achieved by choosing an appropriate functionaliza-tion process. The funcfunctionaliza-tionalizafunctionaliza-tion process uses the antibody that is specific to the antigen of interest. In this case, the choice of a specific bacteriophage to bind S. aureus bacteria is crucial to obtain a specific sensor, and many experiences were done in order to identify the most appropriate. However, the purification of bacteriophages can be long and complex. An alternative to working with whole bacteriophages is the use of purified protein phages that can be easier to prepare. The functionalization process used in this thesis was developed in collaboration with professor Jay L. Nadeau’s group from the biomedical engineering depart-ment at McGill university. LysK protein phage is added to the microdisk and will attach S. aureus bacteria during the real-time detection experiments. In order to demonstrate the specificity of the functionalization process, LysK was used with E. coli bacteria. As predicted, since LysK is only specific to S. aureus strains, it did not attach any E. coli.
The binding of bacteria to the microdisk surface is observed through the reactive sensing mechanism. When bacteria bind to the surface of the resonator, it increases the optical path length and changes the refractive index, which leads to a shift of the resonance peaks towards longer wavelengths. This shift can give practical information about the kinetics of the binding between the bacteria and the protein. For a concentration of 5.109cfu/ml, a shift
of 0.22 nm was observed. When the concentration was decreased, the value of the shift also decreased, meaning less bacteria bind to the surface of the resonator. Using the approximate expression of the electric field inside a microdisk, a theoretical formulation of the wavelength shift was developed for the first time. It helped give an approximation of the number of bacteria that attach to the surface. For the 0.22 nm shift, around 46 bacteria bound to the sensitive area of the microdisk and contributed to the shift. It takes about 15 minutes to attach a maximum number of bacteria. After that time, the shift starts to decrease and go
TABLE OF CONTENTS DEDICATION . . . iii ACKNOWLEDGEMENTS . . . iv RÉSUMÉ . . . v ABSTRACT . . . vii TABLE OF CONTENTS . . . ix LIST OF TABLES . . . xi
LIST OF FIGURES . . . xii
LIST OF SYMBOLS AND ABBREVIATIONS . . . xv
LIST OF APPENDICES . . . xvii
CHAPTER 1 INTRODUCTION . . . 1
CHAPTER 2 STATE OF THE ART . . . 4
2.1 Label-based biosensors . . . 5 2.2 Label-free biosensors . . . 9 2.2.1 Electrical biosensors . . . 10 2.2.2 Mechanical biosensors . . . 10 2.2.3 Optical biosensors . . . 12 2.3 Conclusion . . . 16
CHAPTER 3 THEORY OF WHISPERING GALLERY MICROCAVITIES . . . 18
3.1 Theory of WGM . . . 18
3.1.1 Light confinement and eigenmodes . . . 18
3.1.2 Light coupling using tapered optical fiber . . . 22
3.1.3 Optical microcavities characteristics . . . 24
3.1.4 Biosensing mechanisms . . . 27
3.2 Conclusion . . . 30 CHAPTER 4 WGM MICRODISKS : MICROFABRICATION, SURFACE
FUNCTIO-5.1 Experimental results . . . 40
5.1.1 Specificity of the functionalization process . . . 40
5.1.2 Real-time binding of bacteria . . . 48
5.2 Theoretical reactive shift for a microdisk . . . 51
5.2.1 Maxwell’s equations . . . 52
5.2.2 Resonant shift for a microdisk . . . 54
5.3 Conclusion . . . 60
CHAPTER 6 GENERAL DISCUSSION . . . 61
6.1 Challenges and recommendations for real-time detection experiments . . . . 61
6.1.1 Tapered optical fiber . . . 61
6.1.2 Temperature variation . . . 62
6.1.3 Multiplexing assays . . . 63
6.2 Conclusion . . . 65
CHAPTER 7 CONCLUSION AND RECOMMENDATIONS . . . 66
BIBLIOGRAPHY . . . 69
LIST OF TABLES
Table 2.1 Advantages and limitations of the ELISA techniques . . . 7 Table 2.2 Advantages and limitations of PCR technique . . . 9 Table 2.3 Label-free biosensors and detection modalities . . . 10 Table 2.4 Summary of the electrical and mechanical biodetection techniques . . 12 Table 2.5 Overview of WGM cavity geometries and their biodetection
demons-tration . . . 14 Table 5.1 Ellipsometry measurements of Si-PEG and LysK layers thicknesses . 43 Table 5.2 Mean values of the wavelength shifts versus bacterial concentration . 50 Table 5.3 Parameters of the wavelength shift equation for a microdisk . . . 56 Table 5.4 Surface coverage and number of bacteria binding to the resonator for
four different concentrations . . . 59 Table 5.5 Standard deviation of the wavelength shift for four different bacterial
(Chromogen) is added - g) Enzyme reacts with the substrate producing color. Intensity of the color correlates with the level of antigen (Image is reproduced from Gan and Patel (2013)). . . 6 Figure 2.3 Polymerase chain reaction (PCR) process (Garibyan and Avashia, 2013) 8 Figure 2.4 Schematic of a prism-coupled SPR biosensor (Cooper, 2002) . . . 13 Figure 2.5 Silica optical microsphere (Vollmer et al., 2002) . . . 15 Figure 2.6 Scanning electron micrograph of an optical microtoroid (Zhang et al.,
2010) . . . 15 Figure 2.7 Scanning electron micrograph of a silicon microring (Li et al., 2008) . 16 Figure 2.8 Scanning electron micrograph of an optical microdisk . . . 17 Figure 3.1 Refraction and reflection of light at the interface between the optical
microcavity and its surrounding medium . . . 19 Figure 3.2 Total internal reflection of light inside a microdisk . . . 19 Figure 3.3 Schematic of a silica microdisk and the coordinates system used to find
the modes and the electric field inside the cavity . . . 20 Figure 3.4 TM modes inside a 10 µm-diameter circular cavity at a 5 µm
wave-length. a) m =10, l = 1 b) m = 12, l = 1 c) m = 16, l = 1, d) m = 10, l = 2, e) m = 10, l = 4 f) m = 16, l = 4 (Bergeron, 2010) . . . 22 Figure 3.5 Coupling of light inside an optical microdisk using a tapered optical fiber 23 Figure 3.6 Typical resonance spectrum of a 200 µm-diameter microdisk coupled
to a tapered optical fiber (Amrane, 2012) . . . 26 Figure 3.7 Detection techniques using optical microcavities : a) spectral shift due
to the refractive index change, b) line broadening due to material ab-sorption and c) peak transmission change resulting from the variation of the optical coupling (Armani, 2010) . . . 27 Figure 3.8 Biodetection of a bacterium on a functionalized microdisk . . . 28
Figure 3.9 Mode splitting in a whispering gallery microcavity (Vollmer and Yang, 2012) . . . 31 Figure 4.1 Microfabrication process flow of a silica microdisk. a) UV
photolitho-graphy generating 200 µm-diameter disks patterns, b) Isotropic etch of silica using buffered oxide etch (B.O.E.) and c) Reactive ion etching of silicon pedestals using SF6 plasma. . . 33
Figure 4.2 Scanning electron micrograph of an optical microdisk . . . 34 Figure 4.3 Functionalization process of silica microdisks. (a) The silicon dioxide
surface is hydroxylated with oxygen plasma. (b) The disk is immersed in triethoxysilane-PEG-NH2. (c) The free amines of the PEG-silane are
covalently coupled to LysK using carbodiimide coupling. . . 35 Figure 4.4 Optical characterization setup . . . 37 Figure 4.5 A tapered fiber coupling the light from the red laser inside a microdisk 37 Figure 4.6 Transmission spectrum of a 200 µm-diameter silica microdisk in air (Q
ƒ 105). Coupling was achieved using a 1.2 µm waist diameter taper made of single mode fiber in red. . . 38 Figure 4.7 Transmission spectrum of a 200 µm-diameter silica microdisk in buffer
(Q ƒ 104). Coupling was achieved using a 2 µm waist diameter taper
made of single mode fiber in red. . . 38 Figure 5.1 Structure of a bacteriophage showing its three parts : the head
contai-ning the DNA or RNA genome, the collar and the tail (www.ck12.org) 41 Figure 5.2 XPS measurements of silica functionalized with PEGylated aminosilane 44 Figure 5.3 XPS measurements of silica functionalized with PEGylated
aminosi-lane and LysK protein . . . 44 Figure 5.4 Carbon and nitrogen XPS measurements on silica with Si-PEG (A and
C) and silica with Si-PEG-LysK (B and D) . . . 45 Figure 5.5 Visible camera images of a tapered optical fiber coupled to a 200 µm
diameter microdisk. A) Disk-LysK-S. aureus, B) Disk-S. aureus, C) Disk-Si-PEG-LysK-E. coli and D) Disk-Si-PEG-LysK-S. aureus . . . 46 Figure 5.6 Fluorescent microscope images of a silica substrate functionalized with
A) Si-PEG-LysK-S. aureus bacteria and B) Si-PEG-LysK-E. coli bacteria 46 Figure 5.7 Fluorescence microscope images of S. aureus bacteria bound to silica
wafers functionalized with different concentrations of LysK. A) 0 µM, B) 0.06 µM, C) 0.3 µM, D) 1.5 µM and E) 7.5 µM . . . . 47 Figure 5.8 Mean number of bacterial cells on a surface area of 0.15 mm2 versus
to a single waveguide. Two of the disks are functionalized with two different bacteriophages specific to two different strains of bacteria. The spectral shifts are observed for each of these resonators, according to the nature and concentration of bacteria attached to their surface. 65
LIST OF SYMBOLS AND ABBREVIATIONS
2D Two dimensions
3D Three dimensions BOE Buffer Oxide Etch
CW Clockwise
CCW Counterclockwise CFU Colony-forming unit
DI Deionized
DNA Deoxyribonucleic acid DRIE Deep Reactive Ion Etching E. coli Escherichia Coli
EDC 1-Ethyl-3-[3-dimethylaminopropyl]carbodiimide hydrochloride ELISA Enzyme-Linked Immunosorbent Assay
EtOH Ethanol
FET Field-Effect Transistor FSR Free spectral range HCl Hydrochloric acid HF Hydrofluoric acid HMDS Hexamethyldisilazane
ICP Inductively Coupled Plasma
IR Infrared
MEMS Microelectromechanical systems
MRSA Methicillin-Resistant Staphylococcus Aureus NaCl Sodium chloride
NH4F Ammonium fluoride
O2 Oxygen
OD Optical density
PBS Phosphate-Buffered Saline PCR Polymerase Chain Reaction PEG Polyethylene Glycol
PSG Phosphosilicate glass
Q Quality Factor
RI Refractive index RIE Reactive Ion Etching
Si-PEG Triethoxysilane-Polyethylene Glycol SMF Single mode fiber
SOI Silicon-on-Insulator
SPR Surface Plasmon Resonance TE Transverse Electric
TM Transverse Magnetic
UV Ultraviolet
WGM Whispering Gallery Modes WHO World Health Organization XeF2 Xenon difluoride
LIST OF APPENDICES
Appendix A ARTICLE 1 : Wavelength Shift in a Whispering Gallery Microdisk due to Bacterial Sensing : A Theoretical Approach . . . 79 Appendix B ARTICLE 2 : Real-Time Detection of Staphylococcus Aureus Using
Whispering Gallery Mode Optical Microdisks . . . 96 Appendix C ARTICLE 3 : CONFERENCE PAPER : Bacterial Sensing Using
Phage-Functionalized Whispering Gallery Microcavities . . . 106 Appendix D PROTEIN INDUCTION AND PURIFICATION PROCESS . . . 110
testing, and the advances in the health care field lead to the development of biological sensors that can be highly efficient devices for those purposes.
Several biosensing techniques have been used over the years, ranging from label-based sensors like enzyme-linked immunosorbent assay (ELISA) and polymerase chain reaction (PCR), to label-free biosensors based on electrical, mechanical and optical transducers. One biosensor that has been studied intensively in the last decade and has been found to be a highly sensitive, very selective when properly functionalized, low-cost and easily fabricated sensor is based on whispering gallery mode (WGM) microcavities, also known as optical microcavities. Their name comes from the similitude between the propagation mode of the electromagnetic wave inside the microcavity and the propagation of the acoustic wave along the long conduit of the St-Paul’s Cathedral in London, as explained by Lord Rayleigh in 1912.
Optical microcavities are structures that can efficiently confine light at the microscale due to total internal reflection of light at the interface between the cavity and its surrounding medium. They have a wide range of applications in telecommunications as filters and lasers, optomechanics and sensing. They come in a variety of shapes and sizes with different charac-teristics and Q-factors, such as spheres, disks, toroids or rings. They are made of a dielectric material, such as silica, and have high quality (Q) factors due to low intrinsic material loss of silica in visible and near-IR. This characteristic makes WGM cavities good candidates for biosensors. High-Q means that the photons have a longer cavity lifetime, and can thus interact many times with the target molecules.
The first main objective of this project is to obtain a specific and selective WGM biosensor for the detection of Staphylococcus aureus bacteria. The first step towards achieving a specific biosensor is surface functionalization. A highly specific and sensitive biosensor will allow to eliminate the risk of false positives in complex environments and will give accurate and reliable results. An appropriate functionalization using protein phage will help detect specifically the S. aureus bacteria.
Once a proper functionalization is achieved, fast, real-time detection of S. aureus bacteria becomes thus possible. This step accounts for the second main objective of the thesis. The experiments are done using an optical characterization setup and results of the bacterial binding to the surface of the microdisk are observed as a shift of the resonance frequency of the cavity.
The third objective of this thesis is to quantify the number or concentration of bacteria that bind to the surface of the microresonator and contribute to the spectral shift. The attachment of bacteria to the surface of the microdisk is observed via the reactive sensing principle. This binding will increase the optical path length, leading to the shift of the resonance frequency towards longer wavelengths. Knowledge of the microdisk’s modes will help find a theoretical expression of the spectral shift induced by the bacterial binding to the resonator. It is also important to observe the kinetics of the binding between LysK protein phage and Staphylococcus bacteria.
Details of the functionalization process, results of the real-time detection and the theoretical formulation of the spectral shift are given in details in the subsequent chapters.
Chapter 2 gives an overview of the numerous biosensing techniques that have been developed and used so far. At first, a description of the label-based biosensing techniques such as ELISA and PCR is given, followed by the main label-free sensing techniques used, including WGM microcavities. The main applications of these techniques along with their advantages and limitations are also described.
Chapter 3 details the theory of WGM microcavities. The principle of light confinement inside the microcavity, light coupling using a tapered optical fiber, as well as the characteristics of the WGM cavities are explained. The second part of the chapter gives an overview of the different sensing mechanisms used to detect the binding of biomolecules to the surface of the cavity.
Microfabrication of optical microdisks is detailed in chapter 4, along with the suface functio-nalization process developed to detect S. aureus bacteria specifically and the optical charac-terization setup used to carry out the experiments.
In chapter 5, a synthesis of the work and the experimental results are stated, starting by demonstrating the specificity of the functionalization process, then describing the results of real-time binding of bacteria to the surface of a microdisk. The second part of the chapter is dedicated to a theoretical development of the reactive shift for a microdisk.
Finally, a general discussion about the difficulties faced during the project, including the environmental and experimental parameters that could influence the real-time detection of
used for specific bacterial sensing.
A theoretical expression of the spectral shift is developed. It allows to find the approximate number of bacteria that bind to the surface of the microresonator and contribute to the reactive shift. It also allows to obtain the optimal parameters in order to achieve single-bacterium detection using whispering gallery optical microdisks.
CHAPTER 2 STATE OF THE ART
Virus particles and pathogenic bacteria are major causes of diseases and mortality around the world. They can be present in contaminated water, air conditioning and food supplies and cause serious infections. The overuse of antibiotics has given rise to antibiotic-resistant strains of bacteria, such as multi-drug resistant Gram-negative bacteria. According to the world health organisation (WHO), highly resistant bacteria such as Methicillin-Resistant Staphylococcus Aureus (MRSA), which is a common cause of severe infections, are responsible of high percentage of hospital-acquired infections, and people with MRSA are 64% more likely to die than those who have a non-resistant form of the infection. It becomes thus very important to use accurate detection techniques to achieve early detection of these viruses and pathogens in order to prevent the spread of disease and find appropriate treatments to these illnesses. In this chapter, a brief description of the methods used to detect the presence of infectious diseases caused by bacteria or viruses is given, starting with label-based biosensors, followed by a comparison of label-free biosensing techniques that are used, including sensors based on whispering gallery microcavities.
But first, it is important to appropriately define a biological sensor, or a biosensor. A biosensor is an analytical device designed to detect the presence of biological elements and convert the response into a signal that can be easily read and quantified. A biosensor is typically composed of two main elements : a biological recognition element that is able to interact specifically with a target, and a transducer that will convert the recognition event into an easily measured signal (Fig. 2.1) (Hurk and Evoy, 2015). This element needs to be highly specific and to have a high affinity with the measurand, their interaction needs to be stable and detectable by the transducer and their specificity should not be altered by their immobilization on the surface of the transducer (Hunt and Armani, 2010). A wide variety of bio-recognition elements have been used since the first biosensor was described in 1962 by Clark and Lyons, where they immobilized glucose oxidase on an amperiometric oxygen electrode in order to measure the concentration of glucose in the sample (Clark and Lyons, 1962). These bio-elements can range from tissues to enzymes, DNA, cells and antibodies. Classification of the biosensors rely mostly on their transducing elements, and can be classified as electrochemical, mechanical, piezoelectric, thermal and optical sensors (Koyun et al., 2012).
In order to obtain an accurate and reliable biosensor, some very important features need to be present. The sensor must be highly specific to the analyte of interest, meaning that the bio-recognition element must specifically detect the presence of only a certain biomolecule.
and reproducible responses. If the biosensor is intended for point-of-care use, it needs to be biocompatible and not have any toxic products. Some added values to a successful biosensor are its low cost, small size, portability and being user-friendly.
2.1 Label-based biosensors
The first biosensors used required labeling of the target molecule in order to detect its pre-sence. In this section, three different label-based techniques are presented. One of the first methods used was Enzyme-Linked Immunosorbent Assay (ELISA). It was developed in the early 1970s by (Engvall and Perlmann, 1971) and (Van Weemen and Schuurs, 1971), inde-pendently. It has been used to detect the presence of bacteria such as E. coli and salmonella (Basta et al., 1989; Janyapoon et al., 2000) and other viruses and antibodies (Lee et al., 2013; Suzuki et al., 2003).
ELISA is a plate-based assay technique that uses antibodies and color change to detect the presence of either antigens such as peptides, proteins and hormones or antibodies in a sample. It also allows to measure the concentration of an analyte in solution (Leng et al., 2008). ELISA is performed in a 96-well plate. Each plate is coated with an antigen that will bind to an enzyme-labeled antibody to be measured. Finally, a substance containing the enzyme’s substrate is added to the wells, which yields a visible color change indicating the presence of antigens. Once the enzyme reaction is completed, the optical density (OD) of each well is measured in order to determine the concentration of antigens present. The change in color is proportional to the amount of primary antibodies that bound to the antigens. Non-specific binding events are eliminated by washing the plate between each step. Fig. 2.2 shows the steps to detect the presence of an antigen using ELISA.
There exist three main types of ELISA (Gan and Patel, 2013) : direct ELISA where the antigen is detected by an antibody that is directly conjugated to an enzyme, indirect ELISA
where the antigen is detected in two stages ; first, an unlabeled primary antibody specific to the antigen is immobilized, which in turn is bound to an enzyme-labeled secondary antibody. The third type is sandwich ELISA where the analyte to be measured is bound between two primary antibodies, the capture and detection antibodies. This last technique is the most robust and sensitive of all three.
ELISA is a highly specific, very sensitive technique to be used in complex samples such as blood. However, the need to label the antibodies can be time consuming (≥ 4 hours) and expensive, and the labeling could adversely affect the immunoreactivity of the antibody. Table 2.1 summarizes the advantages and limitations of each of the three ELISA techniques described above.
Figure 2.2 Enzyme-linked Immunosorbent Assay (ELISA) protocol : a) Antigens coated onto the ELISA plate - b) Sample containing primary antibodies is added - c) Non-antigen binding antibodies are washed off the plate - d) Secondary antibody-conjugated with an enzyme is added - e) Excess secondary antibody is washed off the plate - f) Substrate for the enzyme (Chromogen) is added - g) Enzyme reacts with the substrate producing color. Intensity of the color correlates with the level of antigen (Image is reproduced from Gan and Patel (2013)).
Another label-based technique that is widely used is Polymerase Chain Reaction (PCR). PCR was developed by Kary Mullis in 1983 (Saiki et al., 1985). It has since been used in numerous studies to diagnose diseases and identify the presence of different strains of bacteria, viruses and DNA (Senda et al., 1996; Wang et al., 1996; Garcia et al., 2001; Cai et al., 2014). PCR is used in molecular biology to amplify a single copy of a particular DNA sequence and generate billions of copies in few hours (≥ 2 to 4 hours) (Olerup and Zetterquist, 1992). The
Indirect ELISA - The presence of two labeled pri-mary antibodies increases its
sensi-tivity - Extra incubation step is required - Immunoreactivity of the primary
antibody is not altered because it is not labeled
- A known antigen or antibody must be generated in order to detect a gi-ven antibody or antigen
- Cost-saving since it requires fewer labeled antibodies
- The use of two antibodies increases its specificity
- Not all antibodies can be used, so no flexibility in the choice of primary antibody
Sandwich ELISA - Antigen does not require prior pu-rification, making it suitable to use in complex environments
- Microwells must be read quickly since the reaction between the en-zyme and the substrate is quick - Expensive
technique is achieved through three thermal cycles. The first step is the denaturation of the DNA that will separate into two pieces of single strand DNA called primers. The original DNA is called the template. This step is done at a temperature between 94 and 98 ¶C for
20-30 sec. The next step is the annealing and occurs at temperatures varying between 50 and 60¶C for 20-40 sec. The two primers are used in this step and they will bind to the beginning
of the sequence that will be copied, generating two separate strands of DNA. The last step is the extension, where the temperature is increased to about 72¶C. Nucleotides in solution are
added to the annealed primers by the DNA polymerase to create a new strand of DNA. DNA polymerase is a complex of proteins that naturally occurs and its function is to copy a cell’s DNA before it divides it in two. By the end of the process, two identical copies of the original DNA will be made. This cycle is repeated between 30 to 40 times, generating billions of copies of the original DNA segment (Garibyan and Avashia, 2013). A schematic of the polymerase chain reaction process is shown in Fig. 2.3. PCR is a very sensitive technique that can allow early diagnosis of diseases, and specific detection of infections caused by bacteria or viruses.
However, the use of DNA polymerase makes it prone to error and can lead to mutations in the generated fragment. Non-specific binding of the primers to other similar sequences on the template DNA can alter the specificity of the technique. And since it is label-based, a prior sequence information is necessary in order to design the primers. The advantages and limitations of the technique are summarized in Table 2.2.
Figure 2.3 Polymerase chain reaction (PCR) process (Garibyan and Avashia, 2013)
Many label-based biosensors use fluorescent tags such as dyes to label either the bio-recognition element or the target molecule. The presence of the target molecule and the interaction bet-ween the molecule and the bio-recognition element are demonstrated by the intensity of the fluorescence (Fan et al., 2008). These techniques can be highly sensitive, with detection limits down to a single molecule (Moerner, 2007), and the dual confirmation of the presence of the analyte reduces the number of false-positive responses (Mehrabani et al., 2014). Nonethe-less, the labeling process can be laborious and time-consuming, making the resulting sensor
of gene expression the PCR product
- DNA polymerase is prone to errors which can cause mutations in the fragment genera-ted
complicated to use and pricey, not to mention that labels could interfere with the function of the antibodies or proteins (Pires et al., 2014). Results need to be analyzed fast since the fluorescent dyes tend to photobleach, meaning they become permanently unable to fluoresce when exposed to light.
2.2 Label-free biosensors
Since label-based biosensors have many flaws, it becomes crucial to find new techniques that don’t require any labeling. In addition to being label-free, these new techniques need to be sensitive and specific to the target molecule and be able to achieve fast response real-time detection in aqueous environments since most of the biological and clinical samples are water-based (Wu and Vollmer, 2014). Numerous label-free detection techniques have been employed so far. They can be mainly divided into three categories : electrical, mechanical and optical methods. In what follows, a brief description of the electrical and mechanical biosensors is given, followed by a more detailed explanation of the optical biosensors, more specifically whispering gallery mode resonators. A brief summary of the different techniques is given in Table 2.3.
Table 2.3 Label-free biosensors and detection modalities
Detection technique Devices / Detec-tion mechanisms Detection response Example of detections References
Electrical Nanowires Changes in electrical signal suchas current, resistance, voltage or
conductance Single virus
(Patolsky et al., 2006)
Field-effect transistors Changes of inherent biomolecularcharge Protein (Ishikawa et al.,2009)
Mechanical Cantilevers
Mechanical resonant frequency due to mass change or bending of cantilever due to stress/strain de-flection
Single cell (Fritz et al.,2000; Burg et al., 2007) Optical Surface plasmon reso-nance Shift in plasmon resonance Proteins, DNA, bacteria
(Kuo et al., 2003; Yao et al., 2006; Taylor et al., 2005) Optical microcavity
resonator Shift in resonance wavelength Single virus, proteins
(Vollmer et al., 2008; Arnold et al., 2010) 2.2.1 Electrical biosensors
Electrical biosensors are one of the most widely used label-free biosensing techniques. When a chemical or a biomolecule binds to the surface of an electrical biosensor, it interacts with its electrodes or probes, creating a change in the output electric signal and the response is observed as a variation in one or more of the following characteristics : potential, current, resistance or impedance (Pires et al., 2014; Hurk and Evoy, 2015). Since electrical sensors are fabricated using standard lithographic techniques, they can be easily integrated into lab-on-chips platforms (Hunt and Armani, 2010). Several applications have been reported in the literature using electrical platforms or biosensing. One study reported the use of nano-wires based on field-effect transistors (FET) to detect the nucleocapsid protein, a specific biomarker for the severe acute respiratory syndrome (SARS) (Ishikawa et al., 2009). Another study used antibodies immobilized on the sensor’s surface to bind E. coli bacteria (Radke and Alocilja, 2005). Despite electrical-based biosensors being highly sensitive, cost effective, easy to integrate into microfluidic chips, providing good precision and consuming low power (Sassa et al., 2008; Pires et al., 2011), the fact that they are highly influenced by variations of temperature, pH and ionic concentrations limit their shelf life, and hence, limit their use in point-of-care in complex environments (Pires et al., 2014).
2.2.2 Mechanical biosensors
Mechanical biosensors have been studied for decades for biosensing applications. The most common type of these sensors is based on cantilevers, which are typically made of
sili-to the sensor (Fritz et al., 2000). Eq. 2.1 shows the relation that governs this response.
h= 3 ‡ (1 ≠ ‹)/E x (L/d)2 (2.1)
where ‡ is the change in the surface stress, ‹ the Poisson ratio, E Young’s modulus of the cantilever, L its length and d its thickness.
The second detection mechanism is a dynamic one. When biomolecules bind to the surface of the cantilever, they cause a change in its mass. The resonant frequency will thus shift consequently. This dependence is shown in Eq. 2.2 (Datar et al., 2009).
f = 1
2 fi
Û k
mú+ – m (2.2)
where k is the spring constant of the cantilever, mú the effective mass, – the numerical
constant that describes where the biomolecule binds on the surface, and m is the change in mass due to bound molecules.
Similar to electrical sensors, mechanical sensors are also fabricated using surface microma-chining and MEMS lithographic techniques, which allow easy integration to lab-on-chips and microfluidic systems. However, their sensitivity is limited by the mechanical losses that are due to the viscous damping, thus limiting their use in liquid samples (Pires et al., 2014). The detection time can also be relatively long, around 30 minutes, making mechanical sensors not suited for real-time detection (Ferrari, 2005). A summary of both electrical and mechanical biosensors is given in Table 2.4 describing the advantages and drawbacks of each technique. The limitations in both electrical and mechanical biosensing techniques drew the researchers toward the use of optical devices such as Surface Plasmon Resonance (SPR) and optical microcavities for biodetection applications. The next section presents an overview of the prior art of label-free detection with optical devices.
Table 2.4 Summary of the electrical and mechanical biodetection techniques
Biodetection
tech-nique Advantages Drawbacks References
-Rapid, real-time detection -Short shelf life
Electrical -Low-cost fabrication -Control of ionic concentra-tions before detection (Wongkaewet al., 2013) -Widely employed
point-of-care
-Detection needs ≥ 30 min
Mechanical -Monolithic sensor integra-tion -Damping effects in liquidsamples (Ferrari, 2005) -Complex fabrication
2.2.3 Optical biosensors Surface Plasmon Resonance
Surface plasmon resonance was first demonstrated for biosensing by Liedberg et al. (1983). It has been since extensively studied and became a powerful tool for label-free detection of several biomolecules, such as cells (Krupin et al., 2013), proteins (Kuo et al., 2003), DNA (Yao et al., 2006) and bacteria (Taylor et al., 2005).
The most convenient SPR method that yields the best sensing detection limit (DL) is based on prism coupling, as shown in Fig. 2.4 . The incident light is totally reflected on the interface between the prism and the metal (gold) and an evanescent field excites a propagating surface plasmon at the surface of the gold layer. The propagation constant of the evanescent field matches that of the surface plasmon at resonant wavelength, the photon will then be coupled inside the surface plasmon, as described in Eq. 2.3.
2fi
⁄ np sin◊ = —sp (2.3)
where ⁄ is the incident wavelength, np the prism refractive index, ◊ the incidence angle and
—sp the surface plasmon propagation constant.
Biosensors using SPR are highly sensitive to multiple analytes and can provide fast responses and detection limits ranging from picomolar to nanomolar (Tombelli et al., 2005; Chinowsky et al., 2007). However, they are bulky and the instrumentation used for SPR measurements is complex, making it very hard and expensive to integrate them into a lab-on-chip with mi-crofluidics for point-of-care use. In addition, SPR sensors require the use of gold surfaces or
Figure 2.4 Schematic of a prism-coupled SPR biosensor (Cooper, 2002)
nanoparticles, and they are strongly influenced by the temperature, making the fabrication of portable, point-of-care devices near impossible. The advancements in optoelectronics, inte-grated optics and microfluidics techniques are leading the way towards inteinte-grated platforms, such as fiber, waveguide-SPR or SPR on silicon. However, these improvements are decrea-sing the sensitivity of the biosensor (Hoa et al., 2007). Since it is difficult to have a robust, low-cost sensor with integrated microfluidics, the use of SPR sensors will still be limited to the laboratory.
A new family of biosensors has emerged in the last decade that possesses all of the desired capabilities, from being label-free, cost-effective, highly sensitive, to the possibility of being integrated on lab-on-chips and used in complex environments ; whispering gallery optical microcavities.
Whispering Gallery Mode Microcavities
Whispering gallery microcavities (WGM) gained a strong popularity in the past decade as new techniques for label-free biosensing applications. WGM are structures that can efficiently confine light at the microscale due to total internal reflection of light at the interface between the microcavity and its surrounding medium. The long photon lifetime inside the microcavity yields to high quality factors, thus increasing the sensitivity of the biosensor since the light can interact several times with the binding molecule. A detailed explanation of this process along with the theory of WGMs are given in Chapter 3.
WGM microcavities come in different geometries : spheres, toroids, rings, disks and cylinders, just to name a few, and can be fabricated using different materials, such as silica (Bergeron et al., 2009), silicon (Borselli et al., 2005) and polymers (Chao and Guo, 2003). Different bio-logical molecules have been detected using these geometries, including proteins, viruses and DNA. An overview of some of these geometries along with some biodetection demonstrations are given in Table 2.5.
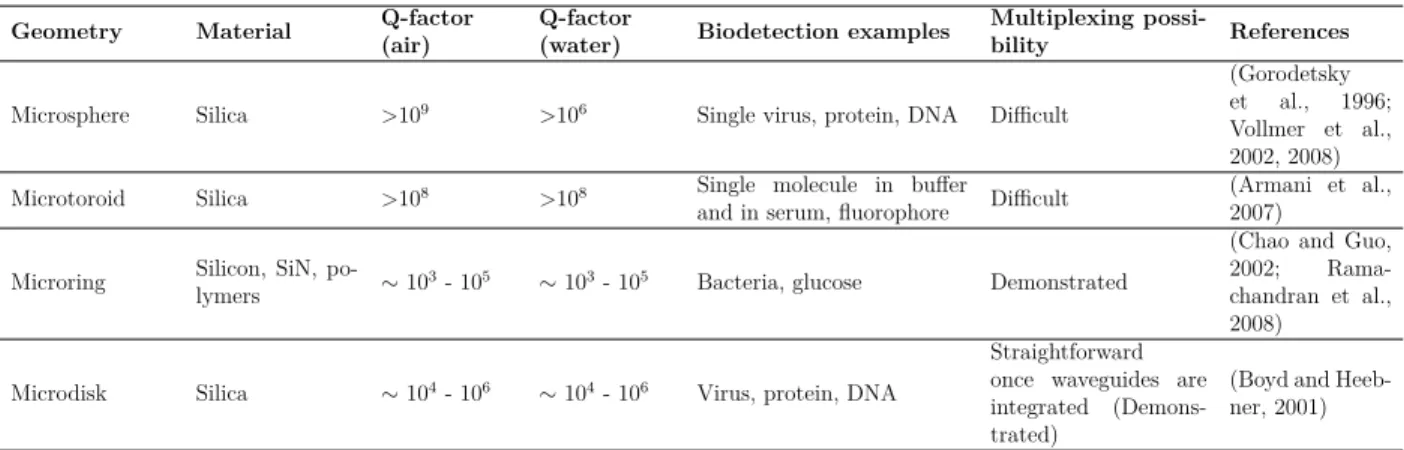
Table 2.5 Overview of WGM cavity geometries and their biodetection demonstration
Geometry Material Q-factor(air) Q-factor(water) Biodetection examples Multiplexing possi-bility References Microsphere Silica >109 >106 Single virus, protein, DNA Difficult
(Gorodetsky et al., 1996; Vollmer et al., 2002, 2008) Microtoroid Silica >108 >108 Single molecule in buffer
and in serum, fluorophore Difficult (Armani et al.,2007) Microring Silicon, SiN, po-lymers ≥ 103- 105 ≥ 103- 105 Bacteria, glucose Demonstrated
(Chao and Guo, 2002; Rama-chandran et al., 2008)
Microdisk Silica ≥ 104- 106 ≥ 104- 106 Virus, protein, DNA
Straightforward once waveguides are integrated (Demons-trated)
(Boyd and Heeb-ner, 2001)
Microspheres
Silica microspheres, shown in Fig. 2.5, were the first microcavity structures used in biosensing (Vollmer et al., 2002). They are easily fabricated by melting the tip of an optical fiber using a CO2 laser beam and have very high Q-factors in air (≥ 109) and in water (≥ 106).
Mi-crospheres were demonstrated to detect the presence of a single virus (Vollmer et al., 2008), protein (Vollmer et al., 2002), and DNA with detection limits of few pg/mm2 (Vollmer et al.,
2003). Despite being highly sensitive and easy to fabricate, microspheres remain very diffi-cult to integrate with microfluidics or for multiplexed sensing because of their bulky structure.
Microtoroids
Microtoroids are made of silica and are fabricated using lithographic techniques (Fig. 2.6). Photolithography is used to transfer the patterns of microdisks onto a silica wafer. Hydro-fluoric acid is then used to etch the silica to form the disks. Silicon pedestals are formed using a xenon difluoride (XeF2) plasma etch. The last step is the reflow of the disks to form toroids
using a CO2 laser. Microtoroids have high Q-factors (≥ 108) and are able to achieve a single
Figure 2.5 Silica optical microsphere (Vollmer et al., 2002)
microtoroids can vary of several micrometers, making the integration with microfluidics quite difficult. A monolithically integrated silica microtoroid with a bent waveguide have been de-monstrated (Zhang and Armani, 2013). The resulting microtoroid has a 70 µm diameter and a Q-factor of 3.2x10⁶ at 1550 nm. However, the fabrication process is quite laborious and is
complicated to integrate with microfluidics.
Figure 2.6 Scanning electron micrograph of an optical microtoroid (Zhang et al., 2010)
Microrings
Microring biosensors, shown in Fig. 2.7, are the only WGM sensors to be commercialized. They are fabricated on-chip using photolithographic techniques, and can be made of silicon, silica and organic polymers. They are ideal for integration into portable electronic devices and for multiplexed detection. Commercial silicon microrings have been used to detect the
presence of a cancer biomarker antigen in an undiluted serum (Washburn et al., 2009). Ho-wever, they have relatively low Q-factors (≥ 103), which makes them less sensitive than other
optical resonators, limiting their ability to detect ultra low concentrations of analytes or a single molecule binding.
Figure 2.7 Scanning electron micrograph of a silicon microring (Li et al., 2008)
Microdisks
Optical microdisks are fabricated the same way as microtoroids but without the reflow step at the end, as can be seen in Fig. 2.8. Their quality factors can range between 104 to 106. They
can easily be integrated once the waveguides are integrated (Grutter et al., 2012), and used for multiplexed sensing. Optical microdisks have been demonstrated to detect the presence of virus particles, proteins and DNA (Boyd and Heebner, 2001) .
2.3 Conclusion
Several biosensing techniques have been developed over the years to diagnose illnesses and detect the presence of infectious diseases caused by viruses and bacteria. Biosensors requiring labeling of the target analyte were the first to be studied and used. However, they can be very expensive, time-consuming, and the labeling process can interfere with the immunoreactivity of the antibodies. Label-free biosensors were then developed to overcome these problems. They can be divided into three main categories : electrochemical, mechanical and optical. Despite being very sensitive and widely employed in point-of-care, the limitations of both electrochemical and mechanical techniques lead the researchers to turn towards a new family of biosensors, optical biosensors, and more specifically whispering gallery microcavities. WGM
Figure 2.8 Scanning electron micrograph of an optical microdisk
resonators have been studied for the last decade and have many applications as biosensors. Each geometry of microcavities has its advantages and limitations for use as a biosensor. One geometry that can be a good compromise is optical microdisks. Optical microdisks have relatively high Q-factors, are easy to fabricate, to integrate with microfluidics and to use for multiplexed sensing. All of these characteristics make them ideal for biosensing applications. In this thesis, detection of bacteria will be performed for the first time on the surface of optical microdisks that will be properly functionalized to obtain a specific binding. The binding event will be observed as a shift in the resonance wavelength of the disk, also known as the reactive sensing mechanism, described in more details in the following chapter.
CHAPTER 3 THEORY OF WHISPERING GALLERY MICROCAVITIES
In this chapter, the theory of whispering gallery microcavities is explained. First, an overview of the phenomena of light confinement and propagation of the electromagnetic waves inside the cavity is presented. This is followed by the main characteristics of the optical microreso-nators. The second part of this chapter focuses on the different biosensing mechanisms that govern the use of WGM microcavities as biosensors.
3.1 Theory of WGM
3.1.1 Light confinement and eigenmodes
Whispering gallery mode microcavities are structures that can efficiently confine light at the microscale. They are named after Lord Rayleigh’s explanation of the "whispering gallery" of St. Paul’s Cathedral in London, where acoustic waves are reflected along the curved walls of the gallery, making it possible to hear a word whispered at the front end of the gallery at its far end (Vahala, 2004). In a similar way, the optical wave is confined inside the microcavity due to total internal reflection of light at the interface between the microcavity and its surrounding medium.
The refraction of light at the interface between two media is pictured in Fig. 3.1 as described by the Snell-Descartes law, also called the refraction law, presented in Eq. 3.1.
n1 sin ◊i = n2 sin ◊t (3.1)
Total internal reflection occurs when the angle of incidence (◊i) of light is larger than a critical angle (◊c) that is measured with respect to the normal to the surface. The critical angle is found according to Eq. 3.2, with n1 > n2,
sin ◊c =
n2
n1 (3.2)
Considering a microcavity made of silica and surrounded by air, the critical angle would be equal to 43.6¶. The total internal reflection of light inside an optical microdisk is shown in
Fig. 3.2.
In the following, a description of the eigenmodes of a microcavity as well as the methods to calculate them are presented, starting by finding the spatial distribution of the electric
Figure 3.1 Refraction and reflection of light at the interface between the optical microcavity and its surrounding medium
Figure 3.2 Total internal reflection of light inside a microdisk
and magnetic fields confined inside the cavity. Detailed explanations of the microresonators theory can be found in the following references : Vahala (2004), Heebner et al. (2008), Bures (2009) and Bergeron (2010). Although the microdisk is a three dimensional structure, the wave equation is solved in two dimensions (2D) using the effective refractive index (nef f) approximation. In this case, the 2D problem is appropriate to apply on thin disks, and it gives a good qualitative understanding of the nature of the modes.
components being the projection of the field on a coordinates system’s axis. There exists two eigen-states of polarization where the magnetic (or electric) field is perpendicular to the inci-dence yz and are called Transverse Magnetic wave [TM] where Hy = Hz = 0 (or Transverse Electric wave [TE] where Ey = Ez = 0) (Bures, 2009). Since both of these modes can be resolved similarly from the Maxwell’s equations, the following will detail the calculation of the electric field Ez(r, „, z). The other components can be easily found accordingly.
Figure 3.3 Schematic of a silica microdisk and the coordinates system used to find the modes and the electric field inside the cavity
In cylindrical coordinates (Fig. 3.3), the electric and magnetic fields of a monochromatic sta-tionary wave, assuming non-dispersive non-absorptive medium, can be expressed as follows :
E(r, t) = E(r, „) exp(≠iÊt) (3.3)
H(r, t) = H(r, „) exp(≠iÊt) (3.4) Y _ ] _ [ Ò · E = ≠µ0ˆˆtH and Ò.(‘0n2E) = 0 Ò · H = ‘0n2 ˆEˆt and Ò.(µ0H) = 0 (3.5)
with ˛E being the electric field, ˛H the magnetic field, ‘0 the vacuum permittivity, µ0 the
vacuum permeability and n the medium refractive index.
By deriving Eq. (3.3) and (3.4) according to Maxwell’s equations (Eq. 3.5), they can be rewritten as a scalar equation, known as Helmholtz wave equation with two variables, as described in Eq. 3.6 : 1 r ˆ ˆr A rˆEz(r, „) ˆr B + 1 r2 ˆ2Ez(r, „) ˆ„2 + k 2[1 ≠ n2(r)]E z(r, „) = k2Ez(r, „) (3.6) where k is the wave number or propagation constant (rad m≠1).
where m is the constant resulting from variable separation, and k n = — is the mode
propagation constant.
Resolution of the Eq. 3.8 is straight forward, and the azimuthal function can be expressed as a complex exponential equation, as demonstrated in Eq. 3.9, where A and B are the integration constants.
m(„) = A exp(im„) + B exp(≠im„) (3.9)
The radial equation (Eq. 3.7) can be reduced to the well-known Bessel equation. It can thus be written as a linear combination of Bessel functions of order m. Due to the boundary conditions, the radial equation can be written as a linear combination of a first-kind Bessel function of order m (Jm(nef fkr)) inside of the cavity (r<fl), and a first-kind Hankel function of order m (Hm(kr)) outside of the cavity (r>fl), as shown in Eq. 3.10 and Eq. 3.11, with
Am and Sm their integration constants respectively and fl being the radius of the cavity.
Rmr<fl(r) = AmJm(nef fkr) (3.10)
Rm
r>fl(r) = SmHm(kr) (3.11)
The general equations of the electric field for the TM mode have been established, the next step is to determine an exact solution to these equations. The integration constants will be calculated using the continuity of the electric field and its derivative at the interface between the cavity and its surrounding medium (air), as can be shown in Eq. 3.12 and Eq. 3.13.
Am dJm(nef fkr) dr --fl= Sm dHm(kr) dr --fl (3.13)
For a given value of m, it will be possible to determine the constants Am and Sm and the eigenvalues of the wavenumber k = Ê/c. Each of these eigenvalues will correspond to a certain radial mode number l. Each mode will thus be defined by two mode numbers, the radial mode number l (= 0, 1, 2, ...) and the azimuthal mode number m (= -l, -l+1, ..., 0,
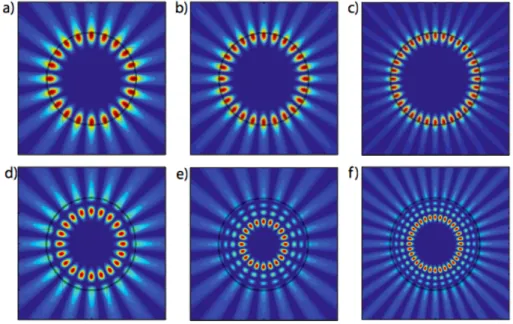
l-1, l). Fig. 3.4 shows the simulations for a 10 µm-diameter microdisk at a 5 µm wavelength,
done using COMSOL Multiphysics Modeling Software (Bergeron, 2010). These parameters were used to easily visualize m=10 modes, compared to greater disk diameters characterized at telecommunication wavelengths (1.5 µm) where m would be of the order of few hundreds.
Figure 3.4 TM modes inside a 10 µm-diameter circular cavity at a 5 µm wavelength. a) m =10, l = 1 b) m = 12, l = 1 c) m = 16, l = 1, d) m = 10, l = 2, e) m = 10, l = 4 f) m = 16, l = 4 (Bergeron, 2010)
3.1.2 Light coupling using tapered optical fiber
Once the eigenmodes of a silica microdisk are well known, the next step would be to examine the method used to excite these modes.
There exist several techniques to couple light inside optical microcavities, ranging from free-space illumination to evanescent coupling techniques (Vahala, 2004). For biosensing applica-tions, it is important to have high efficient coupling and low losses of power, which is why
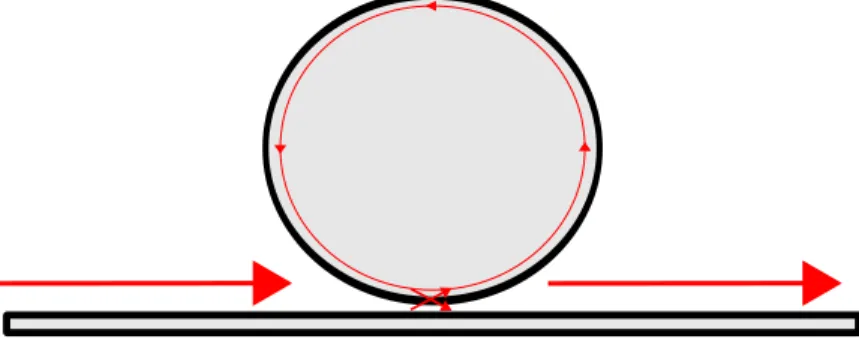
Figure 3.5 Coupling of light inside an optical microdisk using a tapered optical fiber
The evanescent field of the tapered fiber is part of its leakage losses. Stretching the fiber to obtain a 2 µm diameter contributes to the propagation of the evanescent field outside the fiber. The overlap of this evanescent wave with the microcavity modes will allow to quantify the energy transfer between the fiber and the microcavity. Considering that the coupling is weak, and using the theory of coupled modes (Little et al., 1997), it becomes possible to find the coupling coefficient (Ÿ) between the microcavity’s modes and the fundamental mode of the fiber. The fundamental mode of the electric field inside a microcavity (˛e2(x,y,z)) was
found in the previous section for TM polarization. The same procedure can be used to find the electric field of the fundamental mode (˛e1(x, y, z)) inside the tapered fiber. The electric
field of the fiber is a first kind Bessel function inside the core, and a modified second kind Bessel function on the outside (Bures, 2009).
Both fields are calculated using the same coordinates system, with the z axis being the propagation direction of the electric field inside the fiber, and the y axis being perpendicular to the plane of both structures. The instant coupling coefficient (Ÿ12(z)) describes the energy
transfer from the guide 1 (tapered fiber) to the guide 2 (microcavity) and can be calculated using the overlap integral shown in Eq. 3.14, with k being the wave vector, —1 the propagation
constant of the mode in the fiber and —2 that in the cavity, n the refractive index (RI) of the
undisrupted mode of the fiber and n the RI of its disrupted mode. The total energy is given by integrating the coupling coefficient over the length of the fiber, in the direction of the z axis, as calculated in Eq. 3.15.
Ÿ12(z) = Ÿú21(z) = k 2 2Ò|—1—2| ⁄ AŒ(n 2≠ n2)˛eú 1(x, y, z)˛e2(x, y, z)dA (3.14) Ÿ12(z) = Ÿú21(z) = ⁄ Œ ≠ŒŸ12(z)exp(≠i —z)dz (3.15)
3.1.3 Optical microcavities characteristics
In this section, the main characteristics of optical microcavities are described, including the resonance, the free spectral range and the quality (Q-)factor. These features will help compare the different shapes and sizes of optical microcavities and choose the most suited for the desired application.
Resonances
Light remains confined inside an optical microcavity and recirculates for a long time since ab-sorption loss in silica glass is less than 7 dB/km (Wu and Vollmer, 2014). As described earlier, the propagated light is reflected at the interface silica/air consecutively until it circumnavi-gates the entire cavity, and reaches its starting point. This interaction could be constructive, meaning that the wave is in phase with itself, and optical power can accumulate at that wavelength. If the interaction is destructive, the wave will be out of phase and accumulation of optical power is limited at this wavelength. It becomes thus possible to define a resonance wavelength as shown in Eq. 3.16 :
⁄= 2fiRnef f
m (3.16)
where R is the radius of the microcavity, nef f is the effective refractive index of the mode and m its azimuthal order. The effective refractive index of the microcavity is the index seen by the guided mode, and it varies with the surrounding refractive index.
Free spectral range (FSR)
The free spectral range of a microcavity is the wavelength difference between two consecutive resonances, m and m+1. Using the expression found in Eq. 3.16, the FSR can be calculated as follows :
⁄m =
2fiRnef f
Quality factor
The microcavity quality factor helps to quantify the efficiency of light confinement inside a microcavity. It is an expression of the time spent by light inside the microcavity (Eq. 3.21) (Vahala, 2004). The longer the light stays confined inside the cavity, the higher its quality fac-tor will be. The photon lifetime can be measured by introducing a light wave at the resonant frequency of the microcavity then cutting off the excitation signal. The power acquisition right after stopping of laser allows to determine the half-life of the photon.
Q= Ê· = 2fi‹· (3.21)
with Ê being the frequency and · the photon lifetime.
It can also be calculated by finding the resonance at full width at half maximum (FWHM) from the transmission spectrum (Eq. 3.22).
Q= ⁄
⁄ (3.22)
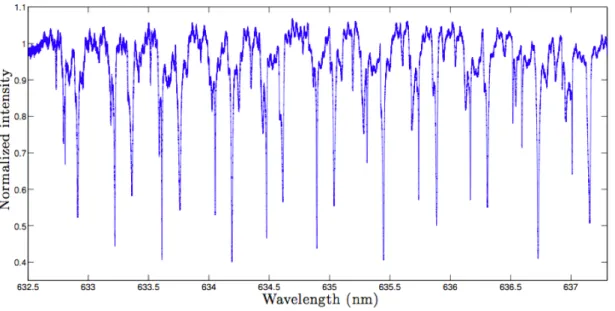
Fig. 3.6 shows a typical transmission spectrum of a 200 µm-diameter microdisk coupled to a tapered optical fiber. The free spectral range and the FWHM are shown on the graph. For a Q-factor around 106, the photon lifetime inside the disk is about 1 ns.
The quality factor is also an expression of the losses, intrinsic and extrinsic, in the optical microcavity (Armani, 2010). The total or intrinsic Q-factor can be written as :
1 Qtotal = 1 Qss + 1 Qrad + 1 Qmat + 1 Qcoup + 1 Qcont (3.23) where Qss is the surface scattering loss, Qrad the radiation loss, Qmat the material or
absorp-Figure 3.6 Typical resonance spectrum of a 200 µm-diameter microdisk coupled to a tapered optical fiber (Amrane, 2012)
tion loss, Qcoup the coupling loss, and Qcont the contamination loss.
In order to maximize the quality factor and the sensitivity of a microcavity, it is important to minimize the loss mechanisms. The surface scattering (Qss) and radiation losses (Qrad) rely on the quality and the resolution of the microfabrication process. The radiation loss increases when the radius of the microcavity is reduced. The absorption loss (Qmat) is insignificant for silica microcavities because of low absorption of silica at telecommunications wavelength (around 1550 nm). Qmat also depends on the effective refractive index of the cavity and can be expressed as follows :
Qmat=
2finef f
–ef f⁄ (3.24)
where nef f is the effective RI, –ef f the effective material or absorption loss and ⁄ the resonant wavelength. The absorption loss plays a crucial role when the microcavity is coupled in an aqueous environment, due to the high absorption coefficient of water in near-infrared (11.8 cm≠1). It becomes thus important to choose an appropriate wavelength to reduce the impact
of absorption loss. For example, at 625 nm, the absorption coefficient of water is about 0.003 cm≠1.
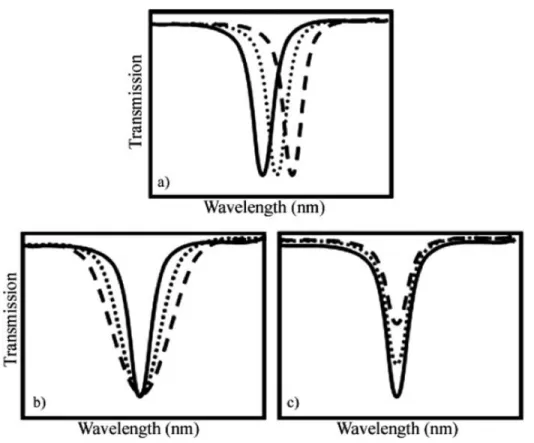
coupling.
Figure 3.7 Detection techniques using optical microcavities : a) spectral shift due to the re-fractive index change, b) line broadening due to material absorption and c) peak transmission change resulting from the variation of the optical coupling (Armani, 2010)
Reactive sensing principle
When particles bind to the surface of the microresonator, they will interact with its evanes-cent field, hence increasing the optical path length. This will lead to a shift towards lower
frequencies, i.e. longer wavelengths, as shown in the relation of Eq. 3.25 and Fig. 3.7(a). This is known as the reactive mechanism for biosensing (Vollmer et al., 2008). The wavelength shift is given by : ⁄ ⁄ = R R + n n (3.25)
where R is the radius and n the refractive index of the resonator.
The resonance condition described in section 3.1.3 yields the following equation :
⁄r=
2fiRnef f
m (3.26)
According to Eq. 3.26, the resonant wavelength can be varied by either changing the radius of the microcavity or changing the refractive index of the surrounding medium.
The resonance frequency is then expressed as :
Ê = 2fif = 2fi c ⁄r
= c m
n R (3.27)
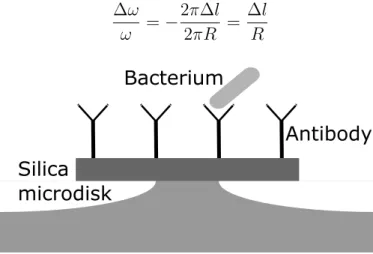
The binding of a biomolecule to the surface of a microresonator (Fig. 3.8) will increase its path length by 2fi l, leading to a shift in the resonance frequency as following :
Ê Ê = ≠ 2fi l 2fiR = l R (3.28)
Silica
microdisk
Bacterium
Antibody
Figure 3.8 Biodetection of a bacterium on a functionalized microdisk
For more complex cases where the protein or biomolecules are not uniformly distributed across the resonator surface, the analysis becomes less straightforward. The polarizability of the particles as well as the surface density will have an effect on the resonant frequency shift. This relation has been established for a single protein binding to the equator of a microsphere,
N ÿ i |E0(˛ri)|2 ≥= ‡p ⁄ |E0(˛r)|2dA (3.30)
with the surface density of the molecules binding to the surface of the microsphere being
‡s =
N
4fiR2 (3.31)
and the excess polarizability of the molecules expressed as :
–ex = 4fi‘0 3n m 2fi 4 Adn dc B m (3.32)
with nm the medium refractive index, dndc the differential refractive index of molecules in solvent, c the solvent concentration and m the mass of a single particle.
The resonant wavelength shift can thus be expressed as :
”⁄ ⁄ ≥=
–ex‡s
‘0(n2s≠ n2m)R
(3.33)
where –ex is the excess polarizability of the bound protein, ‡s the surface density, ‘0 the vacuum permittivity, ns and nm the refractive indices of the sphere and the medium respec-tively, and R the orbital radius of the sphere.
Line broadening
Changes in the linewidth of the resonance can also be a consequence of a binding event on the surface of the cavity. This is due to the increase of the absorption or scattering losses generated by the interaction of the WGM with the biomolecule. The change in linewidth of the resonant mode (Fig. 3.7(b)) due to the molecular absorption is defined as :
”“abs Ê0 ¥ Im[–] | ˛E(˛rp)|2 s V ‘(˛r)| ˛E(˛r)|2d˛r (3.34)
Mode broadening has been used to determine the concentration of an analyte (Ilchenko and Maleki, 2001) and for sensing individual polystyrene nanoparticles of 70 nm radius (Shao et al., 2013).
Transmission change
The intrinsic Q-factor of an optical microcavity is the result of several sources of losses as described in Eq. 3.23. Any binding event that occurs on the surface of the resonator can influence one or more of these Q-factors. Since most biosensing experiences are held in aqueous media, the absorption losses in water will increase. When coupling light via a tapered optical fiber, the addition or evaporation of the sample solution can interfere with the coupling efficiency between the fiber and the cavity. All these changes result in a variation of the optical coupling, which yields to a change in the transmission peak, as shown in Fig. 3.7(c).
The mode splitting principle
Another biosensing principle used is the mode splitting (Vollmer and Yang, 2012). This hap-pens when one resonant mode splits into two resonances when light interacts with nanoscale objects, such as a nanoparticle. Since light propagates clockwise (CW) and counterclockwise (CCW) inside a WG microcavity, the optical mode has a two-fold degeneracy. Both modes propagate at the same resonant wavelength but in opposite directions. When the WGM field interacts with a nano-molecule, the light is scattered from the molecule. A part of the scat-tered light is lost to the environment, while the rest is scatscat-tered back into the mode volume, coupling between the CW and CCW modes, thus lifting the degeneracy of the two modes. This yields to a split of the resonance into two resonances in the transmission spectrum (Fig. 3.9). Several reasons can lead to the observation of the mode splitting. The presence of surface defects, inhomogeneities and nanoparticles are some of them.
3.2 Conclusion
In this chapter, the theory of the whispering gallery mode microcavities along with their characteristics were given. Since this project is based on the use of the WGM microdisks as biosensors, the different biosensing principles were explained. This gives a clear idea of the mechanisms that take place when a binding event occurs on the surface of the resonator.
In the following chapter, the fabrication of silica microdisks is presented, along with the surface functionalization process that allows to obtain a specific biosensor, and the optical characterization setup used to conduct the biosensing experiments.
CHAPTER 4 WGM MICRODISKS : MICROFABRICATION, SURFACE FUNCTIONALIZATION AND OPTICAL CHARACTERIZATION SETUP
In this chapter, the microfabrication process of the whispering gallery microdisks as well as the experimental setup are presented.
This chapter starts by detailing the microfabrication process of WGM microdisks. Then, the surface functionalization process allowing specific sensing is described. Finally, the optical characterization setup is presented.
4.1 Microdisks fabrication
Optical microdisks are fabricated using standard microfabrication techniques. The fabrica-tion is carried out in a clean room where contaminating particles as well as environmental parameters such as temperature and humidity are controlled. Since the resonators are in the order of the micrometer, the presence of even one dust particle or high humidity environment can affect the photolithography process, and hence, damage the fabricated resonator.
4.1.1 Photolithography
The substrates used for fabrication are purchased from Addison Engineering Inc., and are made of Silicon (Si) with an 800 nm layer of thermal silicon dioxide layer on top (Bergeron et al., 2009). The substrate is dehydrated in a vacuum oven and a thin layer of HMDS is deposited to allow a better adhesion of the photoresist to the surface of the wafer (Madou, 2002). The process starts by performing UV photolithography to generate photoresist pat-terns of the 200 µm-diameter microdisks with AZ5214-EIR photoresist (Fig. 4.1 a)). The photoresist is spread out on the substrate using a spinner at 4000 rpm for 30 sec. This is followed by a soft bake of the sample at 110¶C for 1 min before exposing it using the UV lamp
at a wavelength ⁄ = 365nm of the Karl Suss MA-4 aligner. The wafer is then submerged in a AZ-726-MIF solvent solution for 40 sec to be developed. The last step of photolithography is a hard bake at 120¶C for 20 min. The thickness of the photoresist deposited is about 1.5 µm.
4.1.2 Silicon dioxide etch
The second microfabrication step is the isotropic etch of silicon dioxide using a Buffer Oxide Etch (BOE) solution (Fig. 4.1 b)). BOE is a mixture of Ammonium fluoride (NH4F) and