T
h
è
se
d
e
D
o
c
to
r
a
t
/
Ma
i
201
8
Université Paris II- Panthéon-Assas
Ecole Doctorale 455, Sciences Economiques et de Gestion, Sciences de l’Information et de la Communication.Thèse de doctorat en Economie
soutenue le 23 Mai 2018
Contre-mesures médicales contre les
risques NRBC : quelles solutions pour
un développement facilité dans une
économie de marché ?
Mark Lawrence Johnson
Sous la codirection :
Frédéric Dorandeu, Institut de Recherche Biomédicale des Armées (IRBA) & professeur de l’Ecole du Val-de-Grâce
Marianne Guille, Maître de Conférences à l’Université Paris II Panthéon-Assas
Membres du jury :
Stefan Elbe, Professeur à University of Sussex, Rapporteur
David W. Versailles, Professeur à Paris School of Business, Rapporteur Jean Belin, Maître de Conférences à l’Université de Bordeaux
JOHNSON Mark Lawrence | Thèse de doctorat | Mai 2018
ii
-Avertissement
La Faculté n’entend donner aucune approbation ni improbation aux opinions émises dans cette thèse ; ces opinions doivent être considérées comme propres à leur auteur.
JOHNSON Mark Lawrence | Thèse de doctorat | Mai 2018
iii
-Remerciements
J’aimerais exprimer ma reconnaissance à l’égard de toutes les personnes qui ont contribué à la réalisation de cette thèse. Tout d’abord, je remercie Frederic Dorandeu pour avoir inspiré, conçu et codirigé le projet, Marianne Guille pour sa codirection et sa coordination technique ainsi que Jean Belin pour ses contributions tout au long du projet ainsi que pour l’évaluation finale de la thèse.
Je remercie également Stefan Elbe et David W. Versailles, les deux rapporteurs, ainsi que Sacha Bourgeois-Gironde, pour avoir accepté de participer au jury de cette thèse. Un grand merci également à Joseph Lanfranchi et à Ali Skalli (Université Paris 2 Panthéon -Assas) pour leur relecture à la fin de la deuxième année de thèse. Leurs retours ont été motivants et leurs suggestions d’inclure l’économie comportementale et l’économie politique se sont avérées d’une aide précieuse.
Je remercie en outre Virginia G. Johnson de Regulatory Science, LLC, et Xiaomi Tong de Smart Consulting Group, LLC qui ont partagé leurs évaluations à propos de la R&D pour les contre -mesures médicales de CBRN, Stephen V. Reeves Major General, US (Ret) qui a fourni les estimations de coûts de la R&D militaire aux États-Unis ainsi que des commentaires concernant l’élaboration des cont rats, Claus Haugaard Sorensen (Commission Européenne) qui a exprimé son point de vue politique et géostratégique à propos de la réponse au virus Ebola. Merci à Kendall L. Hoyt de la faculté de médecine de Dartmouth pour son enthousiasme et les points de vu e exprimés, Nigel Hale de CBRNE Ltd pour son utilisation inspirante du cadre d’information sur les risques et les agents de BARDA (y compris Richard J. Hatchett, George Korch, et Joe Larsen) pour avoir pris le temps d’exprimer leurs connaissances à propos des initiatives d’offre de l’industrie. Francisco Lepe a également fait preuve de gentillesse en apportant son soutien aux activités de réseautage lors des événements de BARDA. Enfin, ma reconnaissance s’adresse également à Brooks Tigner de Security Europ e pour les révisions qu’il a effectuées ainsi qu’à ma famille qui m’a accordé l’espace personnel nécessaire à la rédaction de cette thèse.
JOHNSON Mark Lawrence | Thèse de doctorat | Mai 2018
iv
-Résumé
Contre-mesures médicales contre les risques NRBC : quelles solutions pour un développement facilité dans une économie de marché ?
Pour certaines maladies causées par des agents chimiques, biologiques, radiologiques et nucléaires (CBRN), il n’existe pas de contre-mesures médicales (MedCM) et bon nombre de celles qui existent pourraient ne pas être disponibles en cas de besoin. En cas d’accident CBRN, des efforts inadéquats de financement de la R&D et de mise à disposition par les gouvernements peuvent avoir de graves conséquences économiques nettement supérieures aux coûts d’initiatives préventives. Compte-tenu des contraintes budgétaires auxquelles de nombreux gouvernements sont confrontés, il est nécessaire de définir des priorités. Parallèlement à la mise en place d’indicateurs de décision de santé efficaces qui identifient et mesurent les effets de causalité de l’impact négatif sur la santé, le processus de décision doit également prendre en considération le rapport coût-efficacité pour rendre le financement durable.
Cette thèse a pour objectif de définir une voie vers une politique économique de santé publique visant à renforcer la disponibilité des MedCM pour les agents CBRN. Dans la première partie, les causes des défaillances du marché sont identifiées (lorsque les opportunités de profit ne compensent pas l’effort de R&D nécessaire). Dans la deuxième partie, des études de cas illustrent les caractéristiques et les conséquences économiques d’exemples d’accidents CBRN et des scénarios sont analysés afin de mettre en évidence comment la disponibilité de MedCM pourrait potentiellement devenir rentable. Enfin, la troisième partie propose des approches plus complètes pour mesurer et compenser les facteurs contribuant à la défaillance du marché en appliquant des modèles économiques spécifiques.
Mots clés : Economie comportementale ; Agents chimiques, biologiques, radiologiques et nucléaires ; Faisabilité économique ; Défaillances du marché ; Contre-mesures médicales ; Economie politique ; Politique économique de santé publique ; Offre et Demande
JOHNSON Mark Lawrence | Thèse de doctorat | Mai 2018
v
-Abstract
International Availability of Medical Countermeasures against Chemical, Biological, Radiological, and Nuclear Agents
For some diseases caused by chemical, biological, radiological, and nuclear (CBRN) agents, innovative medical countermeasures (MedCMs) do not exist while many of those that do might not be readily available. In case of a CBRN event, inappropriate medical research and development (R&D) funding and government procurement efforts can result in adverse economic consequences (e.g. lost income) far exceeding the costs of strong and comprehensive preparedness initiatives. Given the budgetary constraints many governments face, priorities must be defined. Parallel to determining effective health decision metrics that identify and weigh the causal effects of negative health impact, decision making must also consider cost-effectiveness to make funding sustainable. Moreover, international cooperation is necessary since the risks increasingly transcend borders due to global travel and the global threat of terrorism.
This dissertation ultimately seeks to define a path to public health economic policy to enhance the international availability of CBRN MedCMs. In Part I, the root causes of market failure are identified and depicted (i.e., where rewards for supply do not adequately compensate for the R&D effort). In Part II, case study examples illustrate the characteristics and economic consequences of CBRN incidents. Scenarios for each case are outlined to show where the availability of MedCMs in these situations could potentially be cost-effective. Finally, Part III construes more comprehensive approaches for gauging and offsetting the deterrence factors of market supply and demand by compiling and applying additional economic models and frameworks.
Keywords: Behavioural Economics ; Chemical, Biological, Radiological, and Nuclear agents ; Economic Feasibility ; Market Failure ; Medical Countermeasures ; Political Economics ; Public Health Economic Policy ; Supply and Demand
JOHNSON Mark Lawrence | Thèse de doctorat | Mai 2018 vi
-Table of Content
Résumé ... iv Abstract ... v Table of Content ... vi Text Abbreviations ... x Introduction ... 1Part I – Components of Market Failure... 7
Chapter 1 Clarifying Drug R&D Effort and Cost ... 9
1.1 Standard R&D Process and Cost Paradigm ... 10
1.1.1 Process ... 10
1.1.2 Costs ... 15
1.1.3 Controversy and Debates ... 20
1.2 CBRN MedCMs – R&D Comparisons ... 25
1.2.1 R&D Costs of Small vs. Large Molecules ... 25
1.2.2 Specific R&D Features for CBRN MedCMs ... 27
1.3 Conclusion... 33
Chapter 2 Supply-Side Deterrents related to MedCMs ... 35
2.1 Market Rewards and Characteristics ... 35
2.1.1 Conventional Diseases ... 36
2.1.2 Rare CBRN Agents ... 39
2.2 Escalation of Supply-Side Deterrence ... 46
2.2.1 Modern Business Challenges ... 46
2.2.2 The Evolving Business Model ... 49
2.3 Conclusion... 54
JOHNSON Mark Lawrence | Thèse de doctorat | Mai 2018
vii
-Chapter 3 Strengthening Cost-Effectiveness of Medical Countermeasure
Development against Rare Biological Threats – The Ebola Outbreak ... 59
3.1 The Ebola Outbreak ... 59
3.2 Response for Medical Intervention ... 61
3.3 Contributor to Lack of Preparedness ... 66
3.4 Reasons to Act ... 71
3.4.1 Indirect Impact of Public Panic ... 72
3.4.2 Political and Geostrategic Implications ... 73
3.4.3 Impact of Social Disruption and Public Panic on GPD ... 74
3.4.4 Impact on ROI ... 76
3.5 Conclusion... 79
Chapter 4 Evolution of Chemical Weapons to Modern Day Exposure and Funding of MedCMs ... 83
4.1 CWA Evolution for Military Purpose ... 85
4.2 Nerve Agents – Organophosphorus Compounds (OPs) ... 90
4.2.1 Health Risks and Medical Countermeasures ... 90
4.2.2 OP Exposure Routes ... 93
4.3 Deduction of Stakeholders and their Incentives to Fund Medical Intervention 99 4.3.1 Stakeholder and Incentive Modelling ... 99
4.3.2 Case Examples of Missed Opportunity for MedCMs against OPs ... 103
4.4 Conclusion... 108
Chapter 5 Economic Efficiency of MedCMs against Radiological and Nuclear Agents 111 5.1 Health Implications & Measures ... 112
5.1.1 Health Effects ... 113
5.1.2 Medical Countermeasures ... 117
JOHNSON Mark Lawrence | Thèse de doctorat | Mai 2018
viii
-5.2.1 General Implications ... 119
5.2.2 Determining Utility for MedCMs ... 123
5.3 Conclusion... 124
Part III – Supply and Demand Rationale ... 127
Chapter 6 Risk-Informed Demand ... 129
6.1 Risk-Informed Framework ... 133
6.2 Set the Context ... 137
6.2.1 Fulfilling Political Interests ... 137
6.2.2 Applying Behavioural Economics ... 139
6.3 Assess Threats and Risks ... 150
6.4 Identify Alternative Measures ... 155
6.4.1 Financial Impact of CBRN Events ... 156
6.4.2 Evaluating Cost-Benefit of CBRN MedCMs ... 159
6.5 Implement ... 161
6.5.1 Opportunity Costs ... 161
6.5.2 Prioritization of Hypothesized Threat ... 162
6.6 Manage ... 168
6.6.1 Funding and Sustainability ... 169
6.6.2 Collaborative Risk Mitigation and Effectiveness Models ... 186
6.7 Conclusion... 190
6.8 Appendix 1: Models for Assessing Cost-Effectiveness ... 193
6.8.1 Cost-of-Doing-Nothing Analysis ... 193
6.8.2 Augmentation to the DALY Approach ... 198
Chapter 7 Counteraction of Supply-Side Deterrents ... 201
7.1 Traditional Incentives ... 201
7.1.1 Orphan Drug Programmes ... 203
JOHNSON Mark Lawrence | Thèse de doctorat | Mai 2018
ix
-7.2 Developing Comprehensive Strategy to Incentivize Supply of CBRN MedCMs 209
7.2.1 Enhancement of Supply-Side Incentives ... 210
7.2.2 Decisional Framework ... 216
7.3 Conclusion... 218
7.4 Appendix 2: TATFAR Cooperation Initiative ... 221
General Conclusion ... 225
JOHNSON Mark Lawrence | Thèse de doctorat | Mai 2018
x
-Text Abbreviations
AAPCC American Association of Poison Control Centres
ACh Acetylcholine
AChE Acetylcholinesterase
AMC Advanced Market Commitment
AMR Antimicrobial Resistance
ARS Acute Radiation Syndrome
ASPR Assistant Secretary for Preparedness and Response
BARDA Biomedical Advanced Research and Development Authority
BSL Biological Safety Level
CBRN Chemical, Biological, Radiological, and Nuclear
ChE Cholinesterase
CDC Centers for Disease Control and Prevention
CGE Computable General Equilibrium
COC Cost of Capital
CWA Chemical Warfare Agent
CWC Chemical Weapons Convention
DALY Disability-Adjusted Life Year
DoD Department of Defense
EC European Commission
EMA European Medicines Agency
EPPM Extended Parallel Process Model
ESA European Space Agency
EU European Union
EVD Ebola Virus Disease
FDA Food and Drug Administration
FIF Financial Intermediary Fund
GDP Gross Domestic Product
JOHNSON Mark Lawrence | Thèse de doctorat | Mai 2018
xi
-GHSI Global Health Security Initiative
GSK GlaxoSmithKline
HHS Department of Health and Human Services
HSC Health Security Committee
IAEA International Atomic Energy Agency
IFFIm International Finance Facility for Immunization
IHR International Health Regulations
IP Intellectual Property
IPO Initial Public Offering
IS Islamic State
JPA Joint Procurement Agreement
M&A Mergers and Acquisitions
MEDC More Economically Developed Countries
MedCM Medical Countermeasure
MP³ Multi-Public-Private Partnerships
MPP Multi-Public-Partnership
NIH National Institutes of Health
NME New Molecular Entity
NPV Net Present Value
OP Organophosphorus Compound
OPCW Organization for the Prohibition of Chemical Weapons
PDP Product Development Partnership
PEF Pandemic Emergency Financing Facility
PhRMA Pharmaceutical Research and Manufacturers of America
PPP Public Private Partnership
PRV Priority Review Voucher
R&D Research and Development
RDD Radiological Dispersal Device
ROE Return on Equity
ROI Return on Investment
JOHNSON Mark Lawrence | Thèse de doctorat | Mai 2018
xii
-TATFAR Trans-Atlantic Task Force on Antimicrobial Resistance
Tufts CSDD Tufts Center for the Study of Drug Development
UK United Kingdom
UN United Nations
US United States
VSL Value of Statistical Life
WBG World Bank Group
WHO World Health Organization
WMD Weapons of Mass Destruction
WTP Willingness to Pay
YLD Years Lived with a Disability
YLL Years of Life Lost
SEYLL Standard Expected Years of Life Lost
TMP³ Transatlantic Multi-Public-Private Partnerships
JOHNSON Mark Lawrence | Thèse de doctorat | Mai 2018
1
-Introduction
Events such as the September 11, 2001 (“9/11”) attacks on the World Trade Center, Pentagon and other targets in the United States (US) – marked the necessity for countries to prepare for attacks aimed at killing as many people as possible without warning. The 9/11 events, which killed some 3,000 people, gave cause for the US, NATO and other allies to initiate a “Global War on Terrorism”. Given terrorism’s deadly new objective of mass killing, the use of chemical, biological, radiological, and nuclear (CBRN) materials was perceived as a great threat for future attacks. Given as well the global nature of international terror, appropriate measures today include a coordinated worldwide approach which aims to prevent, detect and mitigate the consequences of CBRN attacks (Sabol, Šesták, Polívka, & Mroz, 2015). By November 2001 health ministers from several nations – Canada, France, Germany, Italy, Japan, Mexico, the United Kingdom (UK) and the US – called for concerted global action to strengthen the public health response to the threat of international CBRN terrorism. They decided to create the Global Health Security Initiative (GHSI). The GHSI continues to reiterate the increasing importance of their purpose, as observed in 2016: “The rise in terrorist related events over the past year has reinforced that our collaborative efforts in response to CBRN threats remain a high priority” (Global Health Security Initiative, 2016).
At the same time the GHSI was established, the European Union’s (EU) Health Security Committee (HSC) was set up at the request of Europe’s national health ministers and used by the European Commission (EC) to coordinate health-security measures across the union. This enables EU governments to exchange information, evaluate health events, advise their health ministers, and carry out coordinated crisis response. In the US, the Biomedical Advanced Research and Development Authority (BARDA) launched its Project BioShield in 2004 to strengthen its availability of innovative
JOHNSON Mark Lawrence | Thèse de doctorat | Mai 2018
2
-medical countermeasures (MedCMs) against the threat of international CBRN terrorism. The EC began preparing against the same when it launched its CBRN action plan in 2009. The EC plan included a request for each EU member state to assess the amounts and types of CBRN MedCMs required for its national readiness plan and aimed to address associated regulatory issues. Despite the EC’s encouraging CBRN action plan, the MedCM preparedness situation for the 28 EU Member States remains unclear. Nonetheless, it did at least raise the possibility of sharing MedCMs across borders in case of an incident. Further stimulated by the experience of the 2009 H1N1 influenza pandemic, the role of the HSC was formalised in late 2013 to coordinate public health measures dealing with serious cross-border threats to health in the EU. As of November 2015, all EU member states with populations under five million signed the EU Joint Procurement Agreement (JPA). This allows for multi -country procurement of MedCMs against cross-border health threats. Although its element of central funding was not achieved, the mechanism could still be advantageous for smaller member states because it would increase their ability to secure supply, increase price savings and reduce operational costs and administrative burden (Azzopardi-Muscat, Schroder-Beck, & Brand, 2017). The EU’s larger countries, however, might perceive disadvantages associated with forfeiting their sovereign rights to negotiate directly with suppliers.
MedCMs are defined as either a drug, biological product or device that prevents, identifies or treats the consequences of exposure to CBRN agents (Stroud, Nadig, & Altevogt, 2010). To achieve an effective MedCM, medical research and development (R&D) for the discovery, testing and assessment of a compound against a well -defined therapeutic target is a prerequisite (Pammolli, Magazzini, & Riccaboni, 2011). Assuming efficacious research is carried out, populations could be protected via new prophylactic drugs and vaccines or post-exposure treatments such as antidotes and antimicrobials. The US Centers for Disease Control and Prevention (CDC) have classified biological agents of great concern as “Category A Biological Threats”. Examples of these agents include anthrax, plague, smallpox, tularaemia and viral haemorrhagic fevers such as Ebola (U.S. Centers for Disease Control and Prevention,
JOHNSON Mark Lawrence | Thèse de doctorat | Mai 2018
3
-2000), though smallpox was declared eradicated in 1980 by the World Health Organization (WHO) (Henderson, 1998). In addition to potential exposure via natural release, the pathogens responsible for many such diseases have been militarized in the past (e.g., in the US, UK, and former Soviet Union). While rarely seen in nature within developed countries, they pose high risk to national security even if they cannot be easily weaponized. Whether naturally, accidentally or intentionally released, the reasons, according to the CDC, are that they:
• can be easily disseminated or transmitted person-to-person
• cause high mortality, with potential for major public health impact • might cause public panic and social disruption (especially if the “human
hand” is proved to be behind an event)
• require special action for public health preparedness (U.S. Centers for Disease Control and Prevention, 2000).
Similarly, some chemical and radiological agents are high on the threat list of possible agents to be used by terrorist organizations, non-state actors or state-sponsored groups (e.g., Tokyo subway attack in 1995 by the cult Aum Shinrikyo with the highly toxic nerve agent sarin). Their release could also easily occur by accident (e.g. radionuclides released during the nuclear disasters in Chernobyl in 1986 or the Fukushima Daiichi plant in 2011) or even via industrial pollution. For example, studies suggest that the number of people per year who suffer from pesticide-related health effects, which often include organophosphorus compounds (OPs), could be quite significant. The annual incidence rates of acute pesticide poisoning in agricultural workers may be as high as 18.2 per 100,000 full time workers in developed countries and up to 180 per 100,000 workers in less developed countries such as Sri Lanka (Thundiyil, Stober, Besbelli, & Pronczuk, 2008).
Subsequent to the terrorist events of September 2001, the US government realised that sufficient technology and availability of MedCMs against the newly perceived health threats would not be provided by industry (U.S. Centers for Disease Control and Prevention, 2000). In the absence of an acute threat of a natural, intentional, or
JOHNSON Mark Lawrence | Thèse de doctorat | Mai 2018
4
-accidental release, the cause was the severely low-to-nil market demand for CBRN MedCMs that are rarely needed in a free market environment – a marketplace of few customers with low and volatile sales potential. Indeed, the R&D process to develop MedCMs is extremely lengthy, risky and expensive, meaning that developers and manufacturers of MedCMs are not economically motivated to address all these threats. That is, free market rewards and incentives are uncertain and usually insufficient to entice the resources of those developers and manufacturers with proven capabilities. Within normal conditions of a market economy, adequate assurances such as market rewards and incentives must be identifiable before developers and manufacturers are willing to strive for solutions to meet market demand. To entice industry to engage, not only is the prospect of profitable business needed but opportunities must be weighed against alternative prospects that might offer better business growth models.
Further complicating the availability of MedCMs is that there are numerous CBRN agents proficient enough to cause harm to individuals. Als o, there is the unpredictable nature of when the health risks of specific CBRNs might arise. Although some CBRN agents pose a low prevalence (proportion of individuals in a population at risk that are adversely affected) and incidence (number of new cases of a disease caused by CBRN agents over a given period divided by the population at risk), or even unlikely to emerge at all, some of them have the potential to cause catastrophic impact on society. Yet it is important to note that all MedCMs do not suffer the same problem. Unless otherwise specified, the focus of this dissertation is on the case of medicinal drugs that require licensure for their delivery and use since investment for drugs tend to be the most resource intensive in terms of time, risks, and costs.
Consequently, the US Project BioShield aimed to provide funding for R&D. A “Special Reserve Fund” was appropriated for the Department of Homeland Security, including 5.6 billion USD over 10 years (2004-2013) for the development and procurement of so-called qualified countermeasures to protect against CBRN agents. The countermeasures could be a drug, biological product or device that the US Department of Health and Human Services (HHS) secretary determines as a priority. Besides
JOHNSON Mark Lawrence | Thèse de doctorat | Mai 2018
5
-enabling the acquisition of late-stage MedCMs to be stockpiled, Project BioShield included other essential components such as increasing the authority of the National Institutes of Health (NIH) to accelerate advanced R&D. Also, the US Food and Drug Administration (FDA) was empowered to authorize use of unlicensed CBRN MedCMs in the event of an emergency (Russell, 2007; Gronvall, 2008). BioShield’s Pandemic and All-Hazards Preparedness Reauthorization Act of 2013 authorized up to 2.8 billion USD for 2014-2018 (U.S. Department of Health and Human Services, 2014a) for the continuation of these objectives.
Yet, for some diseases caused by CBRN agents, innovative MedCMs do not exist and many of those that do might not be readily available internationally. In the event of a release, inappropriate R&D funding and government procurement efforts can have adverse economic consequences (e.g. lost income for society) far exceeding the costs of strong and comprehensive preparedness initiatives. That is because the availability of relevant CBRN MedCMs can be cost-effective in helping minimise the loss of human life and impact on social and economic structures. Given the budgetary constraints many governments face, however, priorities must be defined. Moreover, international cooperation is necessary since risks increasingly transcend borders due to global travel and the global threat of terrorism. While conventional health decision metrics strive to identify and weigh the causal effects of negative health impact relative to each metric, decision making must also consider cost-effectiveness so that funding is sustainable. Yet there are indications that the potential impact certain CBRN agents pose to social and economic structures is not adequately reflected in current health decision metrics.
The rationale to support both market supply and demand can be reinforced by augmenting current economic models and frameworks. This dissertation aims to synthesize and discuss the existing evidence, and then define a path to public health economic policy for enhancing the international availability of CBRN MedCMs. In Part I, the root causes of market failure are identified and depicted. These include the lengthy, risky, and expensive R&D process required to produce CBRN MedCMs (Chapter 1) versus the associated market rewards which are low and uncertain (Chapter
JOHNSON Mark Lawrence | Thèse de doctorat | Mai 2018
6
-2). Chapter 2 shows that the associated market is not compatible with conventional industrial business models intended to combat company growth challenges. In Part II, case study examples (Chapters 3, 4 and 5) illustrate the characteristics and economic consequences of different types of CBRN incidents. Scenarios for each case, whether involving naturally, accidentally or intentionally released agents, are outlined to indicate where the availability of MedCMs in these situations could potentially be most cost-effective. Finally, Part III construes more comprehensive approaches to gauge and offset the deterrence factors of market supply and demand by compiling and applying supplementary economic models and frameworks. To achieve this, Chapter 6 introduces components of a risk-informed framework, emphasising the components’ utility for shaping the political motivation, funding and global collaboration needed to drive market demand. In Chapter 7, the counteraction of supply-side deterrents is examined by presenting incentive examples and showing how these tools can systematically exceed the impact of more traditional approaches.
JOHNSON Mark Lawrence | Thèse de doctorat | Mai 2018
7
-Part I – Components of Market Failure
The core concept of a “market failure” corresponds to situations where the pursuit of individuals’ pure self-interest leads to an inefficient allocation of goods and resources, often resulting in a net social welfare loss. These situations can be improved from a societal point of view and are often related to time-inconsistent preferences, information asymmetries, externalities or public goods. The concept is appli cable here since the risk and cost of the MedCM R&D process is not adequately balanced by market rewards that would normally incentivize product supply. This section describes the features of the medical R&D process and market mechanisms that fail to incentivize, and hence deter industry from developing MedCMs against many CBRN agents. Chapter 1 sets out to increase the lengthy, risky, and expensive drug R&D process’s transparency and to demarcate the lines of associated controversy. Chapter 2 portrays the root causes of market failure by contrasting the market rewards and characteristics offered for drugs that target conventional diseases with those that protect against CBRN agents.
“[The individual] neither intends to promote the public interest, nor knows how much he is promoting it… [H]e intends only his own security; and by directing that industry in such a manner as its produce may be of the greatest value, he intends only his own gain, and he is in this, as in many other cases, led by an invisible hand to promote an end which was no part of his intention” (Smith, 1776) .
JOHNSON Mark Lawrence | Thèse de doctorat | Mai 2018
9
-Chapter 1
C
LARIFYINGD
RUGR&D
E
FFORT ANDC
OSTMedical R&D is the study directed towards discovering, testing and assessing a compound against a well-defined therapeutic target (Pammolli et al., 2011). The estimation and reporting of drug R&D costs has significant influence on major issues for the pharmaceutical and biopharmaceutical industry. These include drug prices, regulatory policy, barriers to generic entry as well as laws involving drug importation from countries where drugs cost less (Adams & Brantner, 2006). For this reason, most estimates are subject to controversy depending on the particular interest involved (e.g. industry, healthcare payers, customers/patients). While verification of high R&D costs would lend industry the justification for pricing policy and laws that protect the market sales potential of its products, healthcare payers (and often consumers) are at the opposite end. That is, they might reap lower prices for medicine if R&D costs could be revealed as “overstated” and then demythologized. Even so, any generic prediction or assessment of costs for a particular pharmaceutical product (also referred to as “small” molecules) and biopharmaceutical (“large” molecules) probably lacks accuracy. This is due to many unique and unforeseen events as well as varying degrees of complexity and mechanistic knowledge available concerning a given disease. The significant sales potential and market stability of drugs that target conventional diseases create an attractive environment for substantial private R&D funding from the investor community. For example, it is expected that by 2020, global annual sales for medicines will reach 1.4 trillion USD (Aitken, 2015). This represents an increase of roughly 30 percent compared to 2015. As for the annual worldwide R&D investment in life science technologies, this currently equals nearly 170 billion USD (Industrial Research Institute, 2016). While this figure for life science technologies includes medical instruments and devices, and animal and agricultural bioscience, R&D in the biotechnology sector alone accounts for some 85 percent of the industries’ total R&D expenditure.
Given controversies surrounding R&D cost estimates, their implications for drug development and the need for government to fund many non-commercial CBRN
JOHNSON Mark Lawrence | Thèse de doctorat | Mai 2018
10
-MedCMs, a clear understanding of cost definition can enhance cooperation potential between industry and government. Hence, this chapter sets out to demarcate the lines of argument associated with this lengthy, risky, expensive and necessary R&D process. This is achieved by clarifying how cost and effort are defined and accumulated. Section 1.1 outlines a standard R&D paradigm derived from drug development studies that target conventional diseases, including depiction of its various controversies and how they stand up to periodic debate. Section 1.2 describes R&D characteristics that are more unique to CBRN MedCMs in order to assess whether significant variance to the standard paradigm occurs.
1.1 Standard R&D Process and Cost Paradigm
Although a number of factors make it difficult to accurately predict the related costs needed to successfully achieve a particular pharmaceutical or biopharmaceutical product, it is possible to frame a standard R&D process and cost paradigm based upon the available study of drug development. After illustrating the common trends when targeting conventional diseases in this section, the arguments concerning such cost estimations are then highlighted.
1.1.1 Process
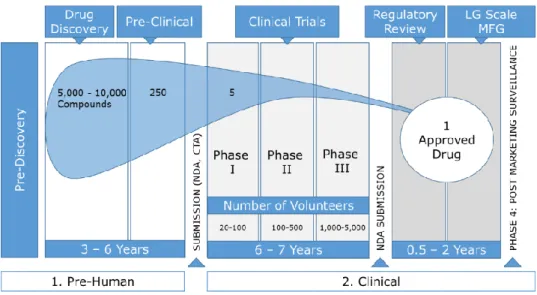
Based on an earlier comprehensive R&D study (DiMasi, Hansen, & Grabowski, 2003) hosted by the Tufts Center for the Study of Drug Development (Tufts CSDD), it was estimated to take about 10-15 years to develop one new drug. This is measured from the time of the drug’s discovery to its availability for patients. Figure 1 illustrates the various phases and statistical failure rates incurred before one drug can be successfully approved. The probability of success is very low while the probability of success increases only as each R&D trial phase is completed. For example, for every 5,000 -10,000 compounds – also known as new molecular entity (NME) – that enter the R&D pipeline, it was estimated that 250 reach a preclinical phase, five reach Phase I and ultimately only one from these NME receives market approval (Pharmaceutical Research and Manufacturers of America, 2007). While a new drug development
JOHNSON Mark Lawrence | Thèse de doctorat | Mai 2018
11
-process cannot be completely pre-determined, a standard R&D paradigm has evolved to frame the general process (DiMasi, Grabowski, & Hansen, 2016).
Figure 1 – Phases of R&D (Pharmaceutical Research and Manufacturers of America, 2007)
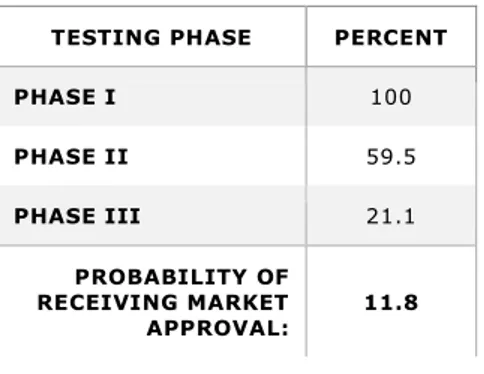
All phases of R&D – labelled pre-human and clinical in Figure 1 – must be successfully completed before marketing approval can be attained. Each individual phase represents a different probability that its relevant criteria can be successfully met; leading to confirmation that the NME is efficacious against the disease it targets and safe for humans. As previously indicated, the probability that a NME passin g through phase I could also successfully reach market approval has been assessed at about one -in-five (or 21.5 percent, to be exact). But according to more recent evaluations, this overall success rate has fallen from 21.5 to 11.8 percent (Tufts Center for the Study of Drug Development, 2014a; DiMasi et al., 2016). This lower overall success probability means that to achieve one successful candidate, nearly 8.5 co mpounds must be launched into phase I development. Assuming successful completion of the pre-human phase, the probabilities of entering each individual clinical trial phase are listed in Table 1. The reduction of overall success probability to 11.8 percent is likely attributable to factors that include increased clinical trial complexity and a greater focus on targeting chronic and degenerative diseases (Policy and Medicine, 2014). A
JOHNSON Mark Lawrence | Thèse de doctorat | Mai 2018
12
-description of Tufts CSDD’s database cost parameters that served as a basis for the earlier and more recent DiMasi et al. studies is offered in Table 2.
Table 1- Probability of Entering Clinical Trial Phases after Successful Pre-Human Phase Completion (DiMasi et al., 2016)
TESTING PHASE PERCENT
PHASE I 100 PHASE II 59.5 PHASE III 21.1 PROBABILITY OF RECEIVING MARKET APPROVAL: 11.8
Table 2 – Description of Tufts CSDD Database (DiMasi et al., 2003; Tufts CSDD, 2014a)
PERIOD GEOGRAPHY DATABASE DESCRIPTION
1980 –
1999 Both foreign and US-owned firms 68 randomly selected new drugs were obtained from a survey of 10 multinational pharmaceutical firms (DiMasi et al., 2003)
1995 – 2007 First tested in human subjects anywhere in the World
106 investigational compounds from ten randomly selected drug firms of varying size, which together accounted for 35 percent of top 50 firm pharmaceutical sales and pharmaceutical R&D expenditures, Data were also collected from the cost survey participants on their aggregate annual pharmaceutical R&D expenditures from 1990 to 2010 (Tufts Center for the Study of Drug Development, 2014a)
Throughout pre-human trial phases, researchers are typically dedicated to discovering and developing new drugs and assuring that promising drug candidates can be tested safely in humans before clinical trial phases can begin – see Table 3 for further detail. Three subsequent phases of clinical trials are structured to establish high confidence in the direct relationship between the NME and its effect on disease. Studies are then designed to compare the NME to placebo and/or alternative treatments. Treatment options for individual study subjects can be achieved either by a randomised or double-blinded selection process – where neither the researcher nor the subject is informed of the applied treatment option until after the study’s completion. Further clinical phases include the approval process, transformation from small-scale to large-scale manufacturing, and a continued monitoring of patients to ensure the reporting of any
JOHNSON Mark Lawrence | Thèse de doctorat | Mai 2018
13
-adverse reactions to the new drug. Additional details of the clinical phases are depicted in Table 4 (Pharmaceutical Research and Manufacturers of America, 2007) .
Table 3 – Description of the Pre-Human R&D Phases
TESTING PHASE DESCRIPTION
PRE-DISCOVERY
Researchers from government, academia and industry contribute to creating an understanding of the disease in order to reveal the cause of the condition. Objectives to achieve a basis for treating the problem are identifying and validating the target molecule (e.g. a single gene or protein) that is involved in the disease and one which will interact with a drug molecule (Pharmaceutical Research and Manufacturers of America, 2007).
DRUG DISCOVERY
Early research aimed to identify the most efficacious new drug molecule (or “lead compound”) that can interact with the chosen target to alter the course of a disease. There are various ways to discover lead compounds. For example, compounds can be found in nature (e.g. bacteria in soils and mouldy plants), De novo (e.g. creating molecules from scratch, computer modelling, high-throughput screening, robotics) as well as biotechnology (e.g. genetically engineering living systems to produce disease -fighting biological molecules). Despite initial potential of drug compounds, early prioritization is required to determine key safety and efficacy compatibilities. By conducting tests in living cells, animals, and via computer models, compatibilities of drug’s pharmacokinetics can be determined. Pharmacokinetics include its absorbability in blood stream, distribution to proper site of action in the body, safely and effectively metabolized, excreted from the body, and nontoxic properties. Based on results of such initial tests, it is possible to optimize lead candidates by altering its structure. For example, a drug molecule can be altered to be less likely to react with other non-related chemical pathways; thus, reducing side-effects. Even at these early stages, alternatives concerning suitable large-scale manufacturing, delivery mechanisms (e.g. how drug is taken), and formulations (e.g. drug recipe) are considered (Pharmaceutical Research and Manufacturers of America, 2007).
PRECLINICAL
This development phase can be highlighted as trying to understand via lab and animal testing how the lead compound works and if the drug is safe enough for human testing. During this phase, researchers are also challenged with how to create large enough drug quantities to conduct clinical trials. Although this is the first scale up as related to manufacturing, this small scale is far different than the scale up which would be needed if the drug is approved for market (Pharmaceutical Research and Manufacturers of America, 2007).
JOHNSON Mark Lawrence | Thèse de doctorat | Mai 2018
14
-Table 4 – Description of Clinical R&D Phases
TESTING PHASE DESCRIPTION
SUBMISSION (IND, CTA)
Before clinical testing in humans can begin, researchers must submit an investigational new drug (IND) application to the FDA (in the US) or clinical trial application (CTA) to EMA (European Medicines Agency) in Europe. The submission data includes results from the preclinical phase, description of the drug candidate’s chemical structure and how it works, potential side-effects, manufacturing information, as well as a detailed description of the trial plan – e.g. where and by whom the tests will be performed (Pharmaceutical Research and Manufacturers of America, 2007). C L IN IC A L T R IA L S Phase I
A phase I clinical trial is typically defined with a group of healthy volunteers (about 20 to 100) who are administered the drug to confirm the drug is safe in humans. In addition to again testing the drug’s pharmacokinetics (as explained in the drug discovery phase), the drug’s pharmacodynamics (e.g. side effects vs. desired effects) can be monitored. Hence, safe dosing ranges and feasibility for further development can be determined (Pharmaceutical Research and Manufacturers of America, 2007).
Phase II
Traditionally, phase II clinical trial requirements include testing the drug candidate’s effectiveness in about 100 to 500 patients with the disease or condition under study. Evaluation focuses on possible short-term side effects (adverse events) and risks associated with the drug as well as if it is working by the expected mechanism; thus, improving the condition in question. Lastly, dose strengths and schedules are optimized in this phase (Pharmaceutical Research and Manufacturers of America, 2007).
Phase III
This key phase clinical trial studies the drug candidate in a large number of patients (about 1,000 – 5,000) to generate statistically significant data about safety, efficacy, and the overall benefit-risk relationship of the drug. Especially since this phase can involve hundreds of testing sites around the world, it is most expensive and time intensive. In addition to studying main benefits of the drug, other requirements are finalized during this phase – e.g. plans for full scale manufacturing, approval application and labelling requirements (Pharmaceutical Research and Manufacturers of America, 2007).
REGULATORY REVIEW: NEW DRUG APPLICATION (NDA)
AND APPROVAL
Upon completion of all three clinical trials, the sponsoring company analyses the full data sets. If all findings can demonstrate both safety and efficacy, the company requests market marketing approval. Following rigorous review, authorities can either 1) approve the medicine, 2) send the company an “approvable” letter requesting more information or studies before approval can be given, or 3) d eny approval (Pharmaceutical Research and Manufacturers of America, 2007).
LARGE SCALE MANUFACTURING
The transformation from small-scale to large-scale manufacturing is a major project. Because production processes for each drug are sensitive, complex, and unique, often a new facility must be built (or an old one reconstructed). Each facility must meet strict guidelines for Good Manufacturing Practices (GMP) (Pharmaceutical Research and Manufacturers of America, 2007).
ONGOING STUDIES AND PHASE IV
TRIALS
Upon launch of a drug on the market, companies are required to monitor patients and report any adverse events to authorities. In fact, sometimes phase IV studies can be required to evaluate long-term safety or how the drug affects specific patient subgroups (Pharmaceutical Research and Manufacturers of America, 2007).
JOHNSON Mark Lawrence | Thèse de doctorat | Mai 2018
15
-1.1.2 Costs
In the absence of defining R&D costs more precisely, there is high potential that growing controversy concerning costs could derive from misunderstanding. For example, it may be intuitive to focus solely on the actual direct expenses invested to complete the pre-human and clinical R&D phases for one successfully approved product candidate. However, to depict a cost evaluation that is economically viable and comparable, it is often necessary to amortise the expenses of previous but failed NMEs and to differentiate between forms of expenditures that typically compile total costs. As summarized in Table 5, key cost areas which require differentiation are actual cash outlays (or out-of-pocket costs) and the cost of capital (COC), also referred to as opportunity costs. Both combined out-of-pocket and COC expenses represent capitalised costs.
Table 5 – Components Applied to Defining Costs
COSTS DESCRIPTION
ACTUAL CASH OUTLAYS (OR
OUT-OF-POCKET COSTS)
1. Costs incurred during the R&D process for the one specific NME which could be successfully approved.
2. Costs of developing NMEs which failed before a successful candidate could be determined.
COST OF CAPITAL (COC) – OR OPPORTUNITY COSTS
3. When R&D funding is provided by private investors – which is most frequently the case for NMEs that target conventional/commercial diseases), a discount rate is applied which best matches the expected return investors must forego during development when they invest in pharmaceutical R&D instead of an equally risky portfolio of financial securities. Over the full lengthy R&D timeline, these capitalized costs can reach roughly the same level as the out -of-pocket expenses itself (Adams & Brantner, 2006; DiMasi et al., 2016).
So how much does it cost to develop a new drug? In 2003, a cost analysis study represented by the Tufts CSDD came up with an estimate of pharmaceutical R&D capitalised costs for conventional diseases at 802 million dollars (DiMasi et al., 2003). Hence, a rounded ballpark figure of 1 billion USD became one of the most widely referenced figures when citing the development costs for one new pharmaceutical drug. From this total capitalized cost estimate of 802 million, one half represented actual out-of-pocket expenses, with the other half being COC with a discount rate of 11 percent.
JOHNSON Mark Lawrence | Thèse de doctorat | Mai 2018
16
-As explained in Table 5, when R&D funding is provided by private investors, a discount rate is applied. Obtaining real COC for study purpose can be viewed in Table 6. The nominal values were first computed, then the expected rate of inflation was subtracted. The nominal COC in 1994 is from a capital asset pricing model study (Myers & Howe, 1997). The estimates for 2000, 2005, and 2010 are based on the DiMasi et al. (2003) methodology derived from the Tufts CSDD large pharmaceutical company sample data. The estimated nominal COC for pharmaceuticals was fairly stable during 1994-2000 (i.e., 14.2 percent to 14.9 percent, respectively). However, a substantial decrease after 2000 can be observed particularly after the global recession (DiMasi et al., 2016). The key driver related to lower COC is that reduced interest rates diminish alternative foregone investor opportunity costs.
Table 6 – Nominal and Real COC for the Pharmaceutical Industry, 1994 – 2010 (DiMasi et al.,
2016)
1994 2000 2005 2010
NOMINAL COC (%) 14.2 14.9 13.3 11.4
INFLATION RATE (%) 3.1 3.1 2.5 2.0
REAL COC (%) 11.1 11.8 10.8 9.4
Responding to criticisms about the Tufts CSDD publication’s total capitalised cost estimate of 802 million, a market watch evaluation (Adams & Brantner, 2006) independently validated these cost estimates. While applying modification to methodology as well as scrutinising various inputs (e.g. accessing an alternative international database called “Pharmaprojects” to obtain pharmaceutical cost calculations), it was possible to increase the evaluation process’s transparency. A description of database parameters collected from Adams & Brantner (2006) is listed in Table 7. Although maintenance was initially provided by PJB Publications, the database was acquired by Informa in 2003 where it is maintained and accessed via its business intelligence division called Pharma Intelligence. In contrast to the Tufts CSDD database, which maintained confidential information about co mpanies and products, estimates from the Pharmaprojects database were collected via global public
JOHNSON Mark Lawrence | Thèse de doctorat | Mai 2018
17
-information sources (e.g. press releases, academic presentations); thus, it allowed others to verify the results. Despite scrutiny of each step of the Tufts C SDD analysis, Adams & Brantner (2006) concluded total capitalized drug development costs (in year 2000 dollars) to be slightly higher than the Tufts CSDD study (~868 million vs. 802 million USD). In fact, their assessment went further to suggest that, depending on the therapy under development, the figure ranged between 500 million USD and more than 2 billion USD. While their study strongly supported the high pharmaceutical R&D estimations provided by the Tufts CSDD, the authors also urged cautio n when using one generalized figure to represent the cost of drug development.
Table 7 – Summary of Pharmaprojects Database (Adams & Brantner, 2006)
DATABASE PERIOD GEOGRAPHY MAINTENANCE CONTENT USD YEAR
PHARMAPROJECTS
DATABASE 1989 and 2002 Both foreign and US-owned firms
PJB Publications Public information (e.g. press releases, academic
presentations) – Includes information on 3,181 compounds
2000
Consequently, the highly referenced but ballpark figure of 1 billion USD continued to represent the total costs of developing a new drug. However, in 2014 the Tufts CSDD announced their most recently updated cost estimates (DiMasi, 2014b; Tufts Center for the Study of Drug Development, 2014b; DiMasi et al., 2016). With a sustained focus on conventional diseases, this latest cost estimate reaches a total of nearly 2.6 billion USD in capitalized costs (2.558). Of the 2.6 billion USD, 1.395 billio n USD are actual out-of-pocket costs (see Figure 2). The proportion of COC accounted for 45 percent of total costs, whereas, in the Tufts CSDD study from 2003, it was 50 percent. The reduced portion of capitalization is attributed to a shorter pre-human trial period and a lower discount rate (10.5 percent, instead of 11 percent). While the prevailing low interest rates likely contributed to a lower discount rate, the reasons for a shorter pre-human trial remain speculative. One possible influence may be attributed to pharmacogenomics, the study of the influence that genetic factors play in drug response. Some suggest pharmacogenomics may accelerate drug development pipelines
JOHNSON Mark Lawrence | Thèse de doctorat | Mai 2018
18
-as it identifies new targets for treatment and boosts the success of drug development. From only a few pharmacogenomic products in the US in 2001, an increasing trend led to several dozen by 2011 (Gibson, Raziee, & Lemmens, 2015). By adjusting the USD value of the Tufts CSDD 2003 study estimate of 802 million USD to the same dollar year (2013) so it can be compared with the most recent study, this would equal 1.044 billion USD. Thus, the new figure of roughly 2.6 billion USD represents an increase of 145 percent between the two study periods – or compounded annual growth rate of 8.5 percent (Tufts Center for the Study of Drug Development, 2014b). For this latest study, it notes that the estimated average costs of post-approval R&D studies (e.g. testing new indications, new formulations, new dosage strengths, and monitoring safety and long -term side effects) equals an additional 312 million USD, thus, potentially lifting costs to 2.87 billion USD.
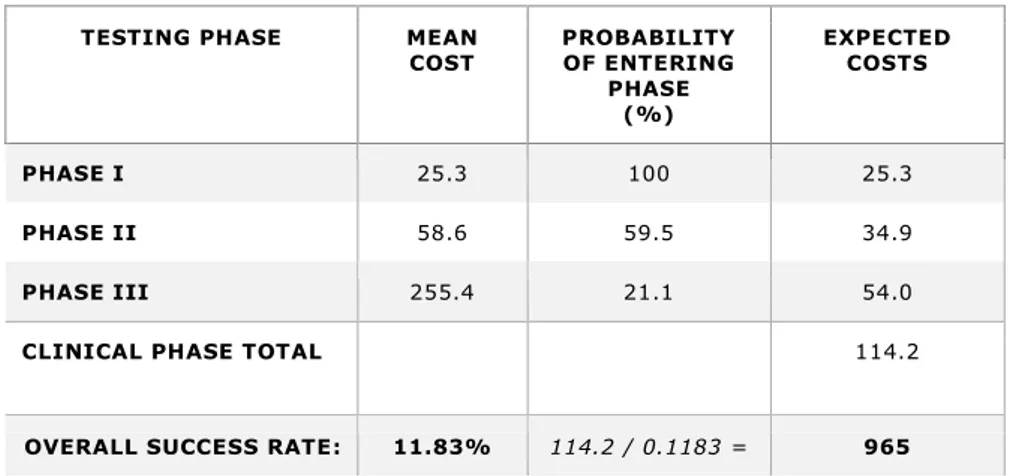
To illustrate the methodology for calculating average out-of-pocket clinical period costs for investigational compounds in the most recent estimat e, key factors for each phase (phase I to phase III) are listed in Table 8. First, to calculate expected costs per approved new compound, the mean cost of each individual phase is multiplied by the probability that the NME will be worthy enough to enter the phase, that is: able to successfully complete the previous phase. In this particular example, entering phase I is certain because the base reflects the assumption that all previous pre-human trials have already been successfully completed. The resulting total expected cost of these three phases is 114.2 million USD. Secondly, to portray the costs incurred of including failed NMEs, this total is then divided by the previously indicated overall success rate of 11.83 percent that a NME will be approved; thus, the total for the clinical trial phases equals 965 million USD. By adding 430 million USD for the previously incurred cost of pre-human trials, the aforementioned total of 1.395 billion USD for actual out -of-pocket cost becomes apparent. It should be mentioned that almost 31 percent of th e out-of-pocket costs represent those incurred in the preclinical phase (430/1.395). Even though the probability is that NMEs will likely fail to enter later phases, this demonstrates that significant costs arise at the early development stages. In order t o derive COC, the mean COC costs of each individual phase are subjected to the same
JOHNSON Mark Lawrence | Thèse de doctorat | Mai 2018
19
-methodology as demonstrated in Table 8, with their identical probabilities of success serving as the basis for calculation.
Figure 2 – Out-of-Pocket and Capitalized Cost per Approved New Compound (DiMasi, 2014a)
Table 8 – Average Out-of-Pocket Clinical Period Costs for Investigational Compounds – in millions of 2013 dollars (DiMasi, 2014a; DiMasi et al., 2016)
TESTING PHASE MEAN
COST PROBABILITY OF ENTERING PHASE (%) EXPECTED COSTS PHASE I 25.3 100 25.3 PHASE II 58.6 59.5 34.9 PHASE III 255.4 21.1 54.0
CLINICAL PHASE TOTAL 114.2
OVERALL SUCCESS RATE: 11.83% 114.2 / 0.1183 = 965
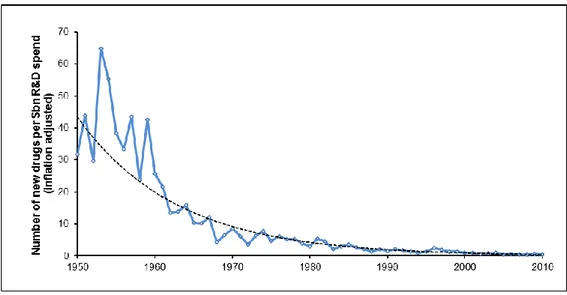
To gain a perspective on the trend of total capitalized cost development over the last decades, Figure 3 depicts the results of diverse past studies. To enable comparison, each original study figure has been adjusted to year 2013 dollars. The particular cost drivers identified for the most recent cost assessment study include costs for increased NME failures, increased clinical trial complexity, larger clinical trial sizes, higher cost
JOHNSON Mark Lawrence | Thèse de doctorat | Mai 2018
20
-of inputs from the medical sector used for development, greater focus on targeting chronic and degenerative diseases, changes in protocol design to include efforts to gather health technology assessment information, and testing on comparators (i.e., alternative treatments or placebos used as a reference in clinical trials) to accommodate payer demands for comparative effectiveness data (Policy and Medicine, 2014).
Figure 3 – Trends in Capitalized Pre-Human, Clinical and Total Costs per Approved Drug (DiMasi
et al., 2016)
1.1.3 Controversy and Debates
Tufts CSDD estimates have generated controversy. Some critics argue that Big Pharma lies about R&D costs to increase profits (Huff, 2011) or they posit there is some sort of conspiracy theory generated by pharmaceutical lobbyists. Others more objectively request specific information and/or criticize the inputs and methodology applied by Big Pharma to portray their R&D costs. For example, Light and Warburton (2011) set out to discredit DiMasi et al. (2003) by inferring that all the co-authors are industry-supported economists; thus, their estimates are intentionally overstated. Alth ough Light and Warburton acknowledged the estimate of 802 million USD to be the most widely cited figure (by government officials and industry trade associations), they argued that
JOHNSON Mark Lawrence | Thèse de doctorat | Mai 2018
21
-Tufts CSDD has received substantial industry funding. Moreover, they point to the fact that for years the Tufts CSDD has functioned as a repository for pharmaceutical companies to submit selected and closely guarded figures on R&D costs. Consequently, these critics say its sample basis is probably skewed with higher R&D costs, wi th any related decisions for calculation methods reflecting an inherent bias. In fact, there are those who argue that while industry leaders and lobbyists warn that lower prices would inhibit innovation by reducing R&D spending potential, the opposite is t he case. They posit that the current situation rewards companies to develop new medicinal products with little added advantage (the so-called “me too” products). This happens, they claim, because companies are vested to compete for market share by simply r aising prices on their “me too” products rather than develop clinically superior medicines with public funding to lower company costs and risks.
A more specific criticism concerns the sampling and data used in the Tufts CSDD hosted study (DiMasi et al., 2003) and the accusation that many key data facts are not indicated in it. For instance, Light and Warburton (2011) state there is lack of transparency on how time was estimated for the COC. Furthermore, they argue that the authors of the Tufts study did not mention any sort of data cleaning to reflect a fair representation of costs. Data cleaning refers to efforts to ensure that costs are correctly allocated and accurately calculated. Hence, it is unknown how companies exactly calculated their R&D costs. Given that situation, one could surmise that R&D costs might include items such as general administrative (G&A) overhead and major equipment, large fees paid to doctors to promote clinical trials as key opinion leaders during premarketing activities, cost of land and buildings not used exclusively for R&D and, finally, large legal expenses – e.g. developing patents and intellectual property (IP) protection. Indeed, because the time and cost of drug discovery is unknown and extremely variable (e.g. three months to 30 years) – with some discoveries (e.g. penicillin) happening by accident – no R&D estimate can rightfully include this in an analysis. More specifically, these authors maintain that drug discovery is often achieved by academic institutes and government laboratories, and not industry. Nonetheless, Tufts CSDD includes 121 million USD at the start of their analysis which
JOHNSON Mark Lawrence | Thèse de doctorat | Mai 2018
22
-adds 52 months to the average time from a compound’s synthesis to initial human testing. When compounded by the COC, this accounts for more than one -third of the 802 million USD estimate. They also criticize several other points of the Tufts CSDD 2003 study such as the omission of taxpayer subsidies or tax reductions/credits specifically tied to R&D expenditures, the addition of capitalization costs and the exaggeration of trial costs, R&D time and risks. Likewise, the use of mean costs (and not average) drive up R&D cost estimates. Finally, they conclude that, based on independent sources and reasonable argumentation, one could have calculated a median R&D cost of 43 million USD per new drug instead of the 802 million USD estimate of 2003.
In direct response to Light and Warburton (2011), Tufts CSDD defended the institute’s position in an official statement (Kaitin, 2011) by declaring:
“…DiMasi’s peer-reviewed article has received worldwide recognition for its scholarship and scope, and its methodology has been critically examined and validated by the U.S. Office of Technology Assessment and others… Light and Warburton restate arguments about the methods and data used for our R&D cost study that they have had published elsewhere… (DiMasi,
Hansen, & Grabowski, 2005a; DiMasi, Hansen, & Grabowski, 2005b)...
…In short, every one of Light and Warbuton’s adjustments are invalid. Furthermore, two peer-reviewed papers by current and former FTC [US Federal Trade Commission] economists… validate our work using other methods and public data (Adams & Brantner, 2006; Adams & Brantner,
2010)…”
In support of their claim that Light and Warburton (2011) merely make use of erroneous adjustments to simulate lower R&D cost estimates, the Tufts CSDD argued:
JOHNSON Mark Lawrence | Thèse de doctorat | Mai 2018
23
-“They inappropriately mix median values reported for individual drugs with what are mean values for the costs of clinical failures and preclini cal fixed costs, and for which the concept of a median has no meaning; they misconstrue the nature of the corporate income tax and incorrectly consider manufacturing tax credits; they use discount rates that are meant for other contexts but that are inappropriate here; they treat line extension approvals as separate and independent units of observation alongside their original approvals; and they grossly misstate the meaning of and misuse figures in our paper on industry-reported data on expenditures on self-originated drugs, licensed-in drugs, and already-approved drugs”.
However, the Tufts CSDD itself was again the target of more criticism after it updated its study estimates of capitalised costs to nearly 2.6 billion USD (DiMasi, 2014b; Tufts Center for the Study of Drug Development, 2014b). In this case, the Union for Affordable Cancer Treatment (UACT) raised several probing questions in a public letter (Gray et al., 2015). For example, UACT questioned whether drug companies provided funding for Tufts CSDD research, whether orphan drug tax credits (up to 50 percent of the clinical trials) are ignored, and whether acquired public funding of research lowers private cost estimates. The Tufts CSDD responded in a statement (DiMasi, 2015) where DiMasi denied that neither he, Tufts CSDD nor co-authors who are at different universities receive any outside funding earmarked for study or related publication activities. DiMasi also asserted that Tufts CSDD publicly discloses its finances, which clearly state that, as a non-profit, they receive unrestricted grants from pharmaceutical, biotechnology and other companies, which represent approximately 40 percent of their operating expenses (Tufts Center for the Study of Drug Development, 2016). Concerning questions related to the inclusion of orphan drug tax credits, DiMasi said the Tufts CSDD study openly states that R&D estimates are pre-tax. This is because their objective is to measure investment by private developers, regardless of who ultimately pays. DiMasi adds that the inclusion of tax credits would distort the picture when comparing cost estimates over time because tax structures change. Furthermore, while orphan drug tax credits may be important for particular drugs, they
JOHNSON Mark Lawrence | Thèse de doctorat | Mai 2018
24
-represent only a small share of U.S. aggregate R&D spending by its domestic biopharmaceutical industry: thus, it not empirically relevant. Measuring total payments (not broken down by the actual payer) can provide a more stable comparison in an environment where structures vary across time and geography. This comparison basis can allow better interpretation of unresolved debates, especially given the estimation and reporting of drug R&D costs can have significant influence on major issues across industry such as drug prices, regulatory policy and barriers to generics (Adams & Brantner, 2006). Inevitably, when one single estimate of total capitalised cost is widely applied internationally as a benchmark (e.g. ~2.6 billion USD in 2014, 802 million USD in 2003), this could be perceived as an attempt to leverage industry interests. Given that notion, it is plausible that distinctions between countries and their R&D funding initiatives such as reduction of direct public (ex-ante) and increase of (ex-post) financial support via tax credits are difficult to accurately reflect and counterbalance.
On the issue of whether acquired public funding of research lowers private cost estimates, DiMasi argues that their estimates measure onl y what private developers actually spend on development. In this vein, if private developers absorb useful public -funded research, then the resulting lower cost would be reflected in their estimates. Along the same lines, Avorn (2015) raises many of the same issues addressed in previous criticisms. Simultaneously, within the same issue of the review, DiMasi, Grabowski, & Hansen (2015) took the opportunity to make the additional point concerning the offering of lower cost corporate bonds as an alternative to raising R&D funding. Directed toward the use of high capitalisation costs that make u p roughly 50 percent of the total estimated R&D costs, they avowed that pharmaceutical companies are heavily reliant on equity-finance. Asserting that investors would not fund R&D activities at lower rates, they posit that the discount rate used in their s tudy reflects the rate actually incurred on average during the relevant time periods.