UMR 225 IRD - Paris-Dauphine
UMR DIAL 225
Place du Maréchal de Lattre de Tassigny 75775 • Paris Cedex 16 •Tél. (33) 01 44 05 45 42 • Fax (33) 01 44 05 45 45 • 4, rue d’Enghien • 75010 Paris • Tél. (33) 01 53 24 14 50 • Fax (33) 01 53 24 14 51
E-mail : [email protected] • Site : www.dial.prd.fr
D
OCUMENT DE
T
RAVAIL
DT/2014-04
Adjustment of the Vietnamese
Labour Market in Time of
Economic fluctuations and
Structural Changes
Xavier OUDIN
Laure PASQUIER-DOUMER
Thai PHẠM MINH
François ROUBAUD
Dạt VU HOANG
2
ADJUSTMENT OF THE VIETNAMESE LABOUR MARKET IN TIME OF ECONOMIC FLUCTUATIONS AND STRUCTURAL CHANGES1
Xavier Oudin
IRD, UMR DIAL, 75010 Paris
PSL, Université Paris-Dauphine, LEDa, 75016 Paris [email protected]
Laure Pasquier-Doumer IRD, UMR DIAL, 75010 Paris
PSL, Université Paris-Dauphine, LEDa, 75016 Paris [email protected]
Thai Pham Minh VASS-CAF
François Roubaud IRD, UMR DIAL, 75010 Paris
PSL, Université Paris-Dauphine, LEDa, 75016 Paris [email protected]
Dat Vu Hoang VASS-CAF [email protected]
Document de travail UMR DIAL
Février 2014
Abstract
In this paper, we consider how labour market adjusts to economic fluctuations, considering structural transformation at work as well as short term changes. We utilise series calculated from population censuses and data published in the statistical yearbooks of GSO for long term series, and Labour Force Surveys from 2007 to 2012 for short term data. The paper highlights the deep transformation of the labour market in the last decades. The labour force has doubled in 25 years and the share of agriculture has declined below 50%. Labour supply absorption was thus one of the main challenges for the Vietnamese economy. The household sector has been the main job provider over the years, in agriculture as well as in non-farm activities. The labour market has adjusted to the recent economic slowdown through different channels. If unemployment does not rise, some people withdraw from the labour force and the number of non-active people has grown. The quantity of labour is also affected by a significant reduction of hours worked. While the non-farm sector generates more jobs for skilled workers, there is a shift of unskilled labour towards agriculture. Due to demographic factors, labour supply absorption and creation of new jobs become a less acute problem. As Vietnam benefits of the demographic dividend, the situation on the labour market should be favourable during the present decade to implement structural policies.
Key Words: Labour Market– Long term and Short term Adjustment – Employment - Vietnam Résumé
Dans cet article, nous examinons les ajustements du marché du travail aux fluctuations économiques, compte tenu des transformations structurelles en cours ainsi que des changements à court terme. Nous utilisons pour cela des données des recensements de la population ou publiées dans les annuaires statistiques de l’Office Général de la Statistique pour les séries à long terme, et les enquêtes emploi conduites entre 2007 à 2012 pour les données à court terme. Cet article souligne la profonde transformation du marché du travail au cours des dernières décennies. La population active a doublé en 25 ans et la part de l'agriculture est passée en dessous du seuil de 50 %. L’absorption de l'offre de travail a donc été l'un des principaux défis pour l'économie vietnamienne sur cette période. Le secteur des entreprises familiales agricoles et non-agricoles a été le principal pourvoyeur d'emplois au cours de ces années. Le marché du travail s'est adapté au récent ralentissement économique à travers différents canaux. Le chômage est resté stable mais le nombre de personnes inactives a augmenté. La quantité de travail a également été affectée par une réduction significative du nombre d'heures travaillées. Alors que le secteur non agricole a généré plus d'emplois pour les travailleurs qualifiés, un flux de travailleurs non-qualifiés vers l’agriculture a été observé. En raison de facteurs démographiques, l'absorption de l'offre de travail et la création de nouveaux emplois ne sont plus le principal problème. En revanche, l’évolution récente du marché du travail appelle à la mise en œuvre de politiques structurelles en vue d’améliorer les conditions de travail, la période étant particulièrement favorable pour mener ces politiques puisque le Vietnam profite actuellement du dividende démographique.
Mots clés : Marché du travail- Ajustement à long et court terme- Emploi- Vietnam
JEL Code: J11, J21, J81 1
This paper is part of the Vietnam Annual Economic Report (VAER) 2013, edited by Dr. Nguyen Duc Thanh. The authors thank the board of advisors of the report and Dr. Nguyen Thang for their useful comments. The views expressed here engage only the authors and not the institutions they belong to.
3
Introduction
One of the main challenges Vietnam has to face during the present time is to absorb labour supply. Every year, new cohorts of youth come to the labour market, looking for a job. The economy offers or not a variety of jobs in different sectors and at different skill levels. The capacity of the economy and its different sectors to create jobs sufficiently in quantity and in quality for these new comers is a major issue. In particular, the effect of the economic slowdown on the creation of jobs and the adjustment through which labour supply matches labour demand are crucial and have to be better understood in order to adapt policies.
In less than 30 years, since Doi Moi, the labour force of Vietnam has doubled while the total population grew by only 50%. Structural changes have occurred in the characteristics and in the distribution of the labour force along the demographic evolution. In the recent years, the demographic trend changed dramatically, leading to a reduction of the labour force growth rate.
This paper aims at enlightening the changes that occurred on the labour market in Vietnam during the five past years (2007-2012) with regard to the structural changes in the past decades. It relies on the Labour Force Surveys from 2007 to 2012, but also on census data and other data on labour published by the GSO (in statistical yearbooks in particular) to assess the long-term trends.
This paper is organised in two sections. In section 1, we consider the structural changes since the 1989 census. We focus on the demographic trend that explains the labour force growth and then look how the increment of the labour force was absorbed by the different components of the labour market. In section 2, we analyse more in detail the recent adjustment of the labour market to economic fluctuations.
1. Structural changes on the labour market in the past decades (1990-2012)
The growth of the labour force and its structure by age is primarily and mostly determined by demographic factors. The past fertility rates 15-20 years ago and the mortality at different ages determine the number of people coming to age of work.
However, not all people in age of work will join the labour force. The share of those participating to the labour force varies through time and in different categories of the
4
population. After the demographic factors, the labour force participation rate is the second factor that determines the number of people who join the labour force. In this section, we successively consider these two factors.
1.1. Long term trend of the labour supply
1.1.1. The demographic trend of labour force increment
Every year, new cohorts of young men and women come to the working age. Although the age of entering the labour force evolves through time, most individuals will join the labour force between the age of 15 and 24. Thus, the number of people reaching these ages determines the number of new entrants in the labour force.
The size of the cohorts of individuals reaching the age of work depends on the fertility two decades ago and, to a lesser extent, on the mortality at young ages. Fertility was high until the 1980s and reached a peak in the mid-1980s. So, the cohorts who have come to the age of work in the 2000s are quite numerous.
At the same time, a number of persons in older cohorts cease working and retire from the labour force. Here again, the size of the cohorts in age of withdrawal from the labour force depends on demographic factors, i.e. past fertility and past and present mortality.
In order to estimate the potential increment of the labour force, we look at the trend of cohorts in age of entering the labour force and those in age of leaving the labour force. We use the cohort of 19 years old as a proxy for the population reaching the age of entering the labour market and the cohorts of the 64 years old for females and 67 years old for males as a proxy of those coming to age of retirement. We use these ages because they are the median ages of entering and leaving the labour market respectively (according to the LFS 2012).
The 19 years old cohorts (the number of people reaching the age of 19 every year) have reached a plateau of 1.8 million persons between 2003 and 2010 that reflects the high fertility of the mid-1980s2. After 2010, it starts declining but should remain at a level of around 1.5 million according to the projections. The cohorts of 64 years old for females and 67 years old for males have been quite stable in number in the last two decades but is now (from 2012)
2 We use the US Bureau of Census international database for estimate and projection of the total population by
age. These data are built from the three censuses of 1989, 1999 and 2009 (see http://www.census.gov/ population/international/data/idb/informationGateway.php).
5
growing rapidly. The reason is that those coming to these ages now have benefited from a drastic reduction of mortality compared to previous generations. From a level of 0.32 million in the last two decades, it is expected to reach 0.9 million in 2025.
These two flows being quantified, we can calculate the potential increment of the labour force, which is the difference between those in age of entering and those in age of leaving the labour market. As the effective number of people who leave the labour market every year is not known, this demographic proxy is quite useful. Around 75-80% of this potential increment participates effectively to the labour force (the labour force participation rate of population aged 15 and over is 76% in 2012).
Figure 1: Potential increment of the labour force 1989-2025
Sources: US Bureau of Census international database; author’s calculation.
The potential increment of labour force has reached its momentum between 2002 and 2010 (Figure1). The growth rate of the potential increment of the labour force has now initiated its decline. In the coming years, the decline will be accelerated because cohorts reaching the retirement age become more numerous. The potential increment of the labour force should be halved between 2010 and 2022.
Despite a decline in the number of young people reaching the age of 19, this number will stay at high levels, around 1.5 million in the near future. However, the pressure on labour supply will be lessened because of the growing number of people who will leave the labour market, making more jobs available. The rise of the older cohorts is something new in the Vietnamese labour market. The bigger number of people who are expected to leave the labour force in the
0 200 400 600 800 1 000 1 200 1 400 1 600 1 800 2 000 1 9 8 9 1 9 9 1 1 9 9 3 1 9 9 5 1 9 9 7 1 9 9 9 2 0 0 1 2 0 0 3 2 0 0 5 2 0 0 7 2 0 0 9 2 0 1 1 2 0 1 3 2 0 1 5 2 0 1 7 2 0 1 9 2 0 2 1 2 0 2 3 2 0 2 5 T h o u sa n d Population 19y population 64F + 67M Potential increment of the LF
6
coming years means that more jobs will become available and fewer jobs will need to be created.
The slowdown of the growth of young cohorts and the growing share of older people in the labour force has an impact on the age distribution of the labour force. The mean age of the labour force rose quickly, from 32 years in 1990 to 37 years in 2012. In 1990, 52% of the labour force was under 30 years old. In 2012, this proportion is only 35%. This is not only due to the demographic evolution but also to changes in the participation rates of youth and older people.
1.1.2. Evolution of the labour force participation rate
The growth of the labour force depends on the combination of the potential increment of the labour force (the demographic trend) and of the labour force participation rate of those coming to age of work and those reaching the age of retirement. The demographic trend gives the potential number of people who could join the labour force. The labour force participation rate gives the actual number of people joining the labour force.
Labour force participation rates depend on the labour demand driven by the economic growth (and the employment content of growth), but also on social behaviours. They are more significant by age and by gender than aggregated as there are important differences in behaviour between young, middle aged and older people, or between men and women. They are also different in urban and rural areas. For example, women' participation is high in Vietnam compared to India, South American countries or Arabic countries. Within Vietnam (as in other countries), participation rate are higher in rural areas than in urban areas. These behaviours may be explained by history, cultural values, political system (gender policies), and economic characteristics. They evolve through time as does the social and economic context.
The labour force participation rates also fluctuate with the labour demand. When the demand is high, people who were not in the labour force get incentives to participate, even at mature ages. On the contrary, in case of economic slowdown, some people will withdraw from the labour force rather than declaring themselves as unemployed, in particular in Vietnam where the scope and coverage of unemployment insurance is weak.
We present here the evolution of the labour force participation rates using the population censuses of 1989, 1999 and 2009. Data have been corrected to smooth outlier data, following
7
a methodology described in details in Oudin (2013). This evolution, on a time span of 20 years, shows the structural changes in labour market behaviours that come with the economic growth, the changes in the economic policy, the transformation of the economic system with the development of the private and household sectors, the urbanisation process and other features of the modernisation of the economy.
Figure 2: Labour Force Participation Rates, 1989-2009
Sources: Population censuses 1989, 1999 and 2009 (GSO); authors' calculations.
The overall labour force participation rate does not change much in 20 years (Figure 2). During the period, around 77% of the population aged 15 and over is in the labour force (77.4% in 1989, 76.2% in 2009). However, there are important changes of the labour force participation rate in some categories of the population while the distribution of the population by age or by rural-urban areas is significantly modified. In fact, the impact of the drop of the labour force participation rate in some categories is balanced by the rise of participation in other categories. The main changes are as follow:
a) Drop in the labour force participation rate of young boys and girls
The labour force participation rate of the population aged 15 to 19 has diminished from 1989 quite quickly. From 72% and 79% respectively for males and females in the rural areas in 1989, the labour force participation rate of youth aged 15 to 19 has dropped to 41% and 35% in 2011. In urban areas, the labour force participation rate of youth aged 15 to 19 has dropped from 54% for males and 53% for women to 21% and 17.5% respectively. In rural as well as in urban areas, the drop has been steeper for women who now participate less to the labour force at this age than males.
30 40 50 60 70 80 90 100 1989 1999 2009 % Young Males (15-24) Young Females (15-24) Males 25-54 Females 25-54 Males 55+ Females 55+ ALL (15+)
8
The “median age of starting work” (the age at which the labour force participation rate reaches 50% or the age at which half a cohort has joined the labour force is used here as a proxy for the median age) is now at 21 years old in urban areas and 18 in rural areas, for both genders (LFS 2012). In 1989, this age was 18 for urban areas, 16 for rural areas. The drop of the labour force participation rate of the 15-19 age category is mostly driven by a rise in the enrolment rates at the highest level of education.3 The highest increase of enrolment rate of females may explain why their labour force participation rate has become lower than the one of males.
Similar trend, but with less emphasis, can be seen for the 20 to 24 age category.
b) Change in the labour force participation rate adult women
The labour force participation rate of adult women (25-54 years old) is extremely high, 90% in 2012. It is one of the highest female labour force participation rates in the world. It is higher in rural areas were women work nearly as much as men. If the overall labour force participation rate of adult women declines with time, this is entirely due to the fast drop under 30 years. At ages of 30 and over, on the contrary, there is a significant rise of the labour force participation rate, particularly over 40. It is worth noticing that this rise is more important in urban areas where the labour force participation rates of females are lower. Growing female participation rates to the labour force are concomitant to the fall of fertility.
c) Rise in the labour force participation rate of old people
The increase of the labour force participation rate of the older age population is one of the most striking evolution in labour force participation rates. It is confirmed in the recent period by the LFS. Intuitively, one would rather expect a decrease of the average participation of old people to the labour force for the following reasons:
• the share of very old people is growing in the old population; those aged 75 and over represented 21% of the total population aged 60 and over in 1989, and 31% in 2009 (US Bureau of Census).
• the share of farmers declines quickly as does the share of population living in rural areas. This is the category of population where old people work most. For example,
3 The upper secondary participation rate has more than doubled between 1998 and 2008 (from 22.9% to 50.3%,
World Bank 2011). The increase was higher for women (from 22.5 to 55.3%) than for men (from 23.3% to 45.9%).
9
the labour force participation rates in rural areas for population aged 60 and over is 49% in 2009 (40% in 1989) for males, 36% (24% in 1989) for females (Population Census). In the LFS 2012, these rates are respectively 54% and 41%.
Some opposite evolution may explain that, overall, the labour force participation rate of old people is on the increase. First, the legal retirement age of 55 for females and 60 for males is really applied only in the public sector and in a small portion of the private sector. This is a declining share of the labour force, even at older ages. Moreover, the pensions are low and many people who retired from the public sector start another activity. Others, in particular self-employed and workers in household businesses or farms, continue working as long as they are valid. Second, the rate of morbidity at age 60 declines as life expectancy increases. People who reach their sixties, and there are many more now than two decades ago, are also healthier and more capable to have an economic activity than in the past.
1.2 Growth of the Labour force and Labour absorption
Having framed the demographic context and the structural evolution of the participation rates, we can have a closer look at the growth of the labour force and its composition. We use here series of figures published by the GSO in statistical yearbooks and, more recently, on LFSs. The GSO figures are calculated after the results of population censuses in 1989, 1999 and 2009. We have calculated trends (or moving averages) in order to get clearer pictures. This method is useful to present long term changes but the data cannot be used to make any statement on short term changes as corrected figures may differ from original ones.4
1.2.1. Growth of the labour force
The labour force has grown at a high pace in the last two decades. Its annual growth rate should now reduce with the decelerating growth of the population 15 and over. In the 1990s, the total population grew by 1.5% per year on average, the population 15 and over by 2.6% and the labour force too (Table 1). In the past decade, the population growth rate reduced to 1.2% on average, while the population 15 and over continued to grow at 2.3%. For the present decade, the rate of growth of the total population is coming near1% and the rate of growth of the population 15 and over is now slowing down, as less numerous cohorts come to the
10
working age. In 2010-2012, the population of 15 and over grows at an annual rate of around 1.6%.
This is the trend of the labour force growth rate. It should reduce in the future (down to around 1% in 2020 according to population projections)5. However, the labour force can evolve differently if there are changes in the labour force participation rates. If labour demand is high, some people out of the labour force may decide to participate in the labour market, and conversely if the demand is low.
Table 1: Average rates of growth of population and labour force (%) 1990-99 2000-09 2010-12
Total population 1.50 1.19 1.00 Population 15 and over 2.59 2.33 1.65 Labour Force 2.53 2.46 1.69 Farm employment
1,80 -0,57 0,68 Non-farm employment
4,67 7,16 3,25
Sources: Statistical yearbooks GSO, LFS (2010, 2012). Authors’ calculations
From now on, unless sudden changes in the labour force participation rates occurs, which seems unlikely, the growth of the labour force should diminish rapidly, following the same trend as the population 15 and over. The potential yearly increment of the labour force will be below half a million in 2020.
1.2.2. Evolution of the labour force
Since1990, the labour force has grown annually by around one million persons, from 30 million in 1990, to 40 in 2000 and 50 in 2010. In 2012, it is around 52 million (Figure 3).6 The increment can be broken out by different criteria. We successively consider the increment
5 Although GSO(GSO, 2011a) and USBC projections differ on a number of items (total population, sex rate at
birth, past fertility…) they agree on the reducing growth rate of the total population as well as the population 15 years old and over.
6 The labour force is not precisely known. The GSO publishes estimates (on its website, in its statistical
yearbooks, and LFS reports) which differ one from the other. We use here a recalculation from the population 15 and over multiplied by the labour force participation rates. The labour force is recalculated using USBureau Census data for the population,, and the censuses and LFS for the labour force participation rate. The labour force participation rates are calculated by sex, 5 years age categories and urban/rural areas (all together 40 series), and adjusted (Oudin, 2013).
11
of the labour force by farm vs. non-farm labour, then by industry and finally by institutional sector.
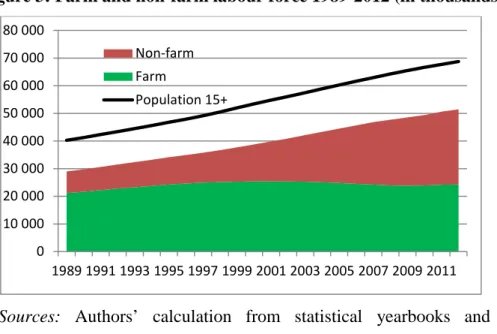
In the past, the share of agriculture in total employment used to be very high (Figure 3). In the mid-eighties, it reached 80% and declined slowly up to the end of the 1990s (67% in 1999). In the last ten years, the decline of the share of agriculture has accelerated. It is now at 47% of the labour force, according to the LFS 2012.
Figure 3: Farm and non-farm labour force 1989-2012 (in thousands)
Sources: Authors’ calculation from statistical yearbooks and population
censuses, GSO.
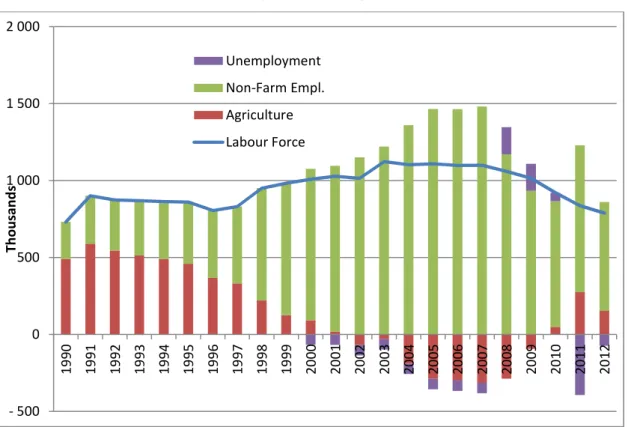
This occurred in the context of a fast growing labour force. Up to the year 2001 where it reached 25 million, employment in agriculture has been growing. Although its share tended to diminish, agriculture continued to grow in number and absorbed a significant part of the increment of the labour force up to the beginning of the 2000s (Figure 4). It thus played an important role in labour absorption. The land reform has contributed to keep employment in the farm sector for a while, at least in the decade of the 1990s. At that time, the growth of employment in agriculture has probably contributed to avoid unemployment.
Since 2002, the trend of employment in agriculture is oriented downwards (Figure 3).This means that the natural increment of the non-farm labour force is now supplemented by people leaving the farm labour force to the non-farm labour force. However, in case of economic slowdown and contraction of the demand for labour in the non-farm sectors, there can be a temporary resurgence of employment in agriculture. It has happened in 2010-2012 (Figure 4).
0 10 000 20 000 30 000 40 000 50 000 60 000 70 000 80 000 1989 1991 1993 1995 1997 1999 2001 2003 2005 2007 2009 2011 Non-farm Farm Population 15+
12
Figure 4: Yearly increment of the labour force by farm and non-farm sector 1990-2012 (in thousands)
Sources: Corrected data: authors’ calculation from statistical yearbooks and
population censuses, GSO.
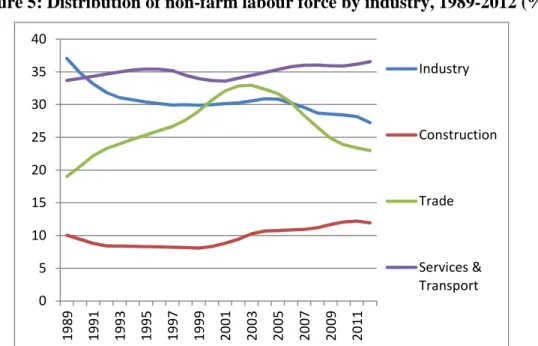
We now consider the evolution of employment in non-farm sectors. The non-farm labour force has grown at a rate of 4.7% on average between 1990 and 1999. The growth accelerated between 2000 and 2009 to reach an impressive annual rate of more than 7%. The non-farm labour force actually doubled during that period. But the pace has been different by sectors and periods, so the relative distribution of non-farm employment has been modified significantly.
After the Doi Moi was launched, there has been a relative fall of employment in manufacturing industries, as state owned enterprises (SOEs) were restructured and many workers were laid off. Foreign investment has permitted employment in the manufacturing sector to keep growing at the same pace as total employment between the mid-1990s and the mid-2000s, but it now grows less rapidly than the average. In the same time, the surge of household businesses mainly benefitted to the trade sector. Self-employed vendors and family businesses in trade have mushroomed right after the Doi Moi up to 2003. At that time, trade comprised one job out of three in farm employment. Since then, the share of trade in non-farm employment has declined.
- 500 0 500 1 000 1 500 2 000 1 9 9 0 1 9 9 1 1 9 9 2 1 9 9 3 1 9 9 4 1 9 9 5 1 9 9 6 1 9 9 7 1 9 9 8 1 9 9 9 2 0 0 0 2 0 0 1 2 0 0 2 2 0 0 3 2 0 0 4 2 0 0 5 2 0 0 6 2 0 0 7 2 0 0 8 2 0 0 9 2 0 1 0 2 0 1 1 2 0 1 2 T h o u s a n d s Unemployment Non-Farm Empl. Agriculture Labour Force
13
Oppositely, employment in construction and services have relatively declined or stagnated up to the beginning of the 2000 decade. Employment in the construction sector is much sensitive to economic fluctuations. The high growth rate of the GDP in the 2000 decade was accompanied by a boom in the construction sector. More recently, in 2012, with the economic slowdown, the growth of employment in construction is momently stopped.
The rapid growth of employment in the service sector (including transportation and public administration) in the 2000 decade is probably more a structural trend and shows a modernisation of the economy with the development of activities linked to education and training, health, business services, finances, etc.
Figure 5: Distribution of non-farm labour force by industry, 1989-2012 (%)
Sources: Authors’ calculation from statistical yearbooks, population censuses and LFSs,
GSO.
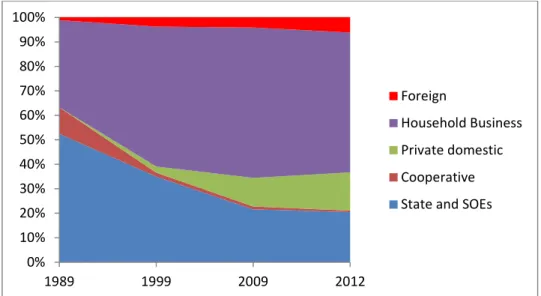
The launching of the Doi Moi policy has had a direct impact of the distribution of employment by institutional sector (or by ownership). By attracting foreign investment, allowing private sector and giving more political space for households’ ventures, the Doi Moi has radically transformed the labour market in Vietnam.
Figure 6 gives a view of the evolution of the non-farm labour market by institutional sector.
One of the main features of the transformation of the labour market is the shrinking of the share of the State sector in employment. The SOEs reforms in the 1990s have led to a drastic reduction of the SOEs, and this process is still continuing. As a consequence, the State’s share in employment has shrunk from 52% in 1989 to 35% in 1999 and 20% in 2012. However, the
0 5 10 15 20 25 30 35 40 1 9 8 9 1 9 9 1 1 9 9 3 1 9 9 5 1 9 9 7 1 9 9 9 2 0 0 1 2 0 0 3 2 0 0 5 2 0 0 7 2 0 0 9 2 0 1 1 Industry Construction Trade Services & Transport
14
State sector still recruits workers. Nearly 10% of new non-farm jobs between 1999 and 2012 were created by the State sector.
It is also worth noting that the domestic enterprises sector is the most dynamic sector since the beginning of the 2000s, with the highest rate of growth among all sectors. The Foreign enterprises sector is also growing fast. But these two sectors only employ 15.6% and 6.2% of non-farm employed labour force respectively in 2012.
The main evolution of the labour market in the past decades is the expansion of the household businesses sector. Households businesses, that include family enterprises and self-employment, account for 57% of the non-farm employment in 2012 as compared with 35% in 1989. Nearly two thirds (65%) of the new non-farm jobs were created in this sector in the last 25 years. Even if it has shrunk recently, the household business sector remains the main employer of non-farm labour market. As long as labour increment was very high, household businesses provided jobs to a significant part of the new comers. With the decline of the labour force increment, it is possible that the share of this sector will be reduced as the recent evolution suggests it.
Figure 6: Distribution of non-farm labour force by institutional sector, 1989-2012
Sources: Authors’ calculation from statistical yearbooks, population censuses and LFSs
(2007-2012), GSO.
1.3. The demographic dividend
Vietnam is structurally in a favourable situation concerning the labour market. It has entered in the period of the demographic dividend. The demographic dividend is the period when the
0% 10% 20% 30% 40% 50% 60% 70% 80% 90% 100% 1989 1999 2009 2012 Foreign Household Business Private domestic Cooperative State and SOEs
15
share of the dependent population is low. The demographic dividend is considered as a very favourable period for economic growth (Bloom , Canning, Sevilla, 2003). As labour incomes are shared with fewer people, it means that living conditions are improved. This also boosts savings which in turn favours economic growth. At the same time, the declining share of children allows to invest more on education and the low proportion of old people is not yet a burden for the society.
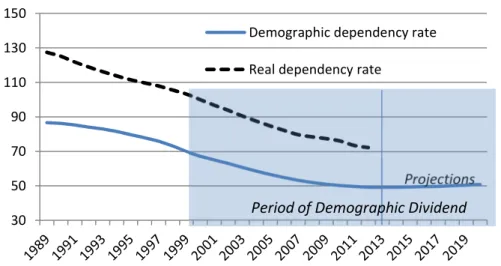
There are two indicators that measure the dependency. One is the demographic proxy, the demographic dependency rates which is the ratio of the number of people not in working age for 100 in working age (15 to 60 years). It is an indicator of structure of the population by age. When it is low, it means that the share of young and old population is reduced. This happens after the fall of fertility, and when the share of old persons in the total population is not yet important. This indicator is valid only if most of the people in working age can find a job and if there is no major change in the labour force participation rates. This is obviously the case in Vietnam who thus meets the conditions to benefit from the demographic dividend. The other indicator is the real dependency ratio, which describes better the real burden of dependent population on workers. It is defined as the ratio between non active and unemployed population to the employed population. It follows the same trend as the demographic dependency rates, at a different scale. The lower these two indicators, the more favourable the situation for labour market.
Figure 7: Dependency Rates
Sources: Authors’ calculation from statistical yearbooks, population censuses, GSO.
In 1989, 100 workers had to take care of 127 persons (Figure 7). This means that their income was shared with that number. In 2012, the number of dependents for 100 workers has fell
30 50 70 90 110 130 150
Demographic dependency rate Real dependency rate
Projections Period of Demographic Dividend
16
down to 71. It corresponds to a growth of income per head of 33% for the period or 1.3% per year. In other words, the change of the age structure of the population and the growth of the employed population that resulted from it brought a complement of 1.3 percentage points of growth per year. This favourable situation will continue in the coming decade if macroeconomic conditions are good and if job creation is sustained.
In 2013, Vietnam is in the most favourable situation in its history in terms of demographic structure and labour outcomes. The young dependent population has declined and this allows to invest more in education. The older population is still not numerous and does not represent a heavy burden to the society.
17
2.
Adjustment to recent economic fluctuations (2007-2012)
After reviewing the structural changes on the labour market in the long run, this section adopts a shorter term perspective, and is dedicated at scrutinizing its adjustment mechanisms to the recent economic fluctuations. In the 2011 edition of the VAER, which considers labour market issues for the first time ever, we focused on the short term impacts of the international crisis (2007-2009; Razafindrakoto et al., 2011). In this edition, the five years spell at hand (2007-2012) provides the opportunity to analyze the labour market behaviour and response to the economic slowdown. In particular, it is now possible to assess in which respect the recent trends are countervailing the structural transformation operating over the last decades. This section is based on the Labour Force Surveys (LFS) conducted by GSO from 2007 to 2012. Following similar surveys collected by the MOLISA between 1996 and 2007, GSO has launched a regular survey in 2007, re-conducted in 2009 (in parallel with the population census), 2010 (two rounds), and transformed into a continuous survey (data collected all year long, providing quarterly indicators) since 2011, with the long term assistance of some of the authors. In spite of (limited) remaining weaknesses, the GSO LFS significantly improved its quality (sampling frame, scope and content), confirming previous diagnosis (Roubaud et al., 2008; Razafindrakoto et al., 2011; Pierre, 2012). With this new LFS scheme, Vietnam is now in a position to better understand labour market issues, with a special attention to the key question of informality.
2.1 Quantitative adjustments
2.1.1. Labour Absorption and Unemployment
At the macro level, the economic slowdown mechanically generated tensions on the labour market. However, these were eased by the structural trends depicted in section 1. In particular, the labour force increment just started to decline (Figure 8, panel A). Due to the demographic momentum, the average yearly increment in 2007-2012 is 0.9 million compared with 1.1 million in the years 2002-2006, and it is expected to decrease further down to 0.6 million in 2020. Thus, labour absorption is less a binding constraint, as shown by the evolution of the unemployment7, which remained under control (Figure 8, panel B). Total unemployment rate
7The standard international definition of unemployed persons are those individuals without work, currently
18
fluctuates at a very low level (around 2%), which can be roughly considered as the natural unemployment rate in Vietnam. The evolution of the urban unemployment, a more conventional measure, shows a similar pattern, at higher levels. From around 4% before the international financial crisis of 2008-2009, urban unemployment rates were decreasing slightly, down to less than 3% at the end of the period (2011-2012). The economy, even with a reduced rate of growth at 5%, is able to absorb the labour supply which now grows at a rate below 2% per year. More structurally, unemployment is not countercyclical as expected. While the GDP growth rate has lost 3 percentage points from 2007 to 2012, the unemployment rate has been quite stable. Unemployment rate is inelastic to economic growth, confirming our previous assessments (Cling et al., 2010a; Razafindrakoto et al., 2011). This result is not surprising as the scope and coverage of safety net for unemployed people are weak in Vietnam, and consequently, they cannot afford to remain unemployed (ILO, 2009; MOLISA and ILO, 2009 ; and Lim, 2011). Therefore, labour market does not clear through unemployment or jobs quantity in Vietnam as in industrialized countries, where unemployment insurance systems are much more developed, but through adjustment of jobs structure and jobs quality, as suggested in the remaining of this paper.
slightly different. According to GSO, unemployment population are those who aged 15 and over and meet the three following conditions during the reference week: (1) they did not work, but wanted to work and have been available for work and (2) they have been seeking for a paid job or (3) they did not have seek for a job because (i) they were temporarily away from work, but with no guarantee to continue working with previous job (ii) they were arranged a new job after temporary leave from work; (iii) they have left job without receiving salaries/wages; or (iv) they believe that they cannot find a job (due to their health limitation, or unsuitable technical qualifications,…). Therefore, it is quite difficult to compare the unemployment rate of Vietnam with other’s countries because of different definition.
19
Figure 8: GDP Growth, labour absorption and unemployment, 2007-2012 (%)
A. Labour force growth B.Unemployment rate and NEET
Sources: GSO (2013) and LFS (2007- 2012),GSO, 2008 is interpolated; authors’calculations.
This statement should be qualified by a focus on youth. Youth (15-24 years old) unemployment rate in Vietnam is three times higher than the general unemployment rate. Furthermore, youths account for roughly half of the unemployed population. The concept of NEET (Not in Employment, Education or Training), also called joblessness is also very useful to understand the difficulty of the youth in the labour market, as it takes into account the discouraged young people (Lim, 2011). Joblessness is defined as the proportion of all young people who are neither in education and training system nor occupied active workers. The joblessness rate has fluctuated between 8% and 10% in 2007-2012 period (Figure 9B). Remarkably, the rate is increasing during the 2010-2012 slowdown (from 8.3% to 10.3%), highlighting the increase of discouraged young people as response to the current economic slowdown.
Youth unemployment and joblessness are then of higher concern in Vietnam than general unemployment, in particular because of their negative impact on social cohesion and productivity (WDR, 2013). However, with a youth unemployment rate of around 5-6% during the period 2007-2012, Vietnam is at the lower bound of what is observed in other countries including comparable countries of South East Asia (ILO, 2013).8 This also applies to
8The average youth unemployment rate is around 14% in the South East Asia and the Pacific region and 12%
worldwide in the period 2007-2012 (http://www.ilo.org/global/research/global-reports/global-employment-trends/youth/2013/WCMS_212431/lang--en/index.htm). 0 1 2 3 4 5 6 7 8 9 GDP growth LF growth (trend) 0 2 4 6 8 10 12 2007 2008 2009 2010 2011 2012 GDP growth Total Unemp. Urban Unemp. Youth Unemp. Joblessness
20
joblessness, as comparable countries such as Philippines and Indonesia suffer much higher rate (around 25% in 2010 according to ILOSTAT, 2013).
2.1.2. Structure of the labour force
At first glance, the job structure suggests that the economic slowdown does not change the big picture. The distribution by industries remains remarkably stable. Between 2010 and 2012, the average share of the primary sector (including agriculture, forestry and fishery) accounts for a little less than half of the occupied labour force (48%), while the secondary sector (including manufacturing, mining and construction) represents 21% and the tertiary sector (trade and other services) 31%. During the previous period under review (2007-2009), the respective proportions were almost the same. In terms of institutional sectors, the changes, although limited, were more noticeable. As observed with the long-term trends, a progressive process of formalization can be observed (Figure 9). While the share of public employment kept constant (around 11%), private formal sector jobs grew steadily at the expense of the informal sector (and agriculture). Taken together, foreign enterprises, domestic enterprises and formal non-farm household businesses gathered 16% of total employment in 2007. They sum up to nearly 21% five years later.
A closer look at each sector shows interesting results. First and at odds with previous trend, the share of agriculture job has not declined anymore since 2010, farming sector acting as a buffer in time of hardship (Figures 3 and 9). Second and similarly at the other end of the sectoral ladder, employment in the foreign enterprises increase just enough to maintain its share since 2010 (around 3% of total employment). Third, domestic enterprises have developed steadily in spite of adverse circumstances, and have become the most dynamic sector. It contributed to 43% of the gross nonfarm job increment between 2007 and 2012, far beyond household businesses (30%). Fourth, nonfarm household business sector was still (and by far) the main job providers in urban areas, even if its share began to decrease over the period. Nearly one job out of three belongs to this sector (and around 60% of non-farm jobs). There are mainly located in the informal sector, which will remain a huge concern for the years to come. All in all, the period economic slowdown initiated in 2008 did not generate any major breaks in the labour force structure, which pursues its long term dynamics. However, the speed of changes has decelerated, while the future is uncertain. As a consequence, the most optimistic views about the Vietnamese economy (transform Vietnam in an industrialized country) will not be achieved in the short run.
21
Figure 9: Distribution of main jobs by institutional sectors 2007-2012 (%)
Sources: LFS (2007- 2012), GSO, 2008 is interpolated. Total: occupied population (15 years
old and over); authors’ calculations.
2.1.3. Working hours and underemployment
One first important quantitative mechanism through which the Vietnamese labour market adjusts to the adverse economic conditions is the number of hours worked. In time of slowdown, the number of working hours per job declined. In 2007, the average working week in the main job was 44 hours. Five years later, it was only 42 hours a week (Figure 10). At the macro level, this 5% decrease is far from negligible, as it represents billions of working hours destroyed on a yearly basis. Working hours reduction has been at the highest when the crisis hit the hardest, and then stabilizing at a low level further on. This flexibility is a clear advantage of Vietnam labour market compared to more developed country where job creation (and consequently unemployment) is the main adjustment variable to a contraction of labour demand. Adjustment of working hours is in direct relation with sectoral regulations. Household businesses (farm and nonfarm) are the most responsive and particularly concerned by the decrease of working hours during the slowdown. FDI and domestic private enterprises were less prompt to answer the new environment. Though delayed during the international financial crisis, the adjustment process began afterwards. However, working hours fluctuations were smooth enough not to alter the hierarchy between sectors: formal private sector employees work the most (FDI at the top), informal sector and mainly farmers the less.
0% 10% 20% 30% 40% 50% 60% 70% 80% 90% 100% 2007 2008 2009 2010 2011 2012 Agriculture Nonfarm Household Businesses Domestic enterprise Foreign enterprises State sector
22
Figure 10: Number of working hours in the main job by institutional sectors 2007-2012 (%)
Sources: LFS (2007- 2012),GSO, 2008 is interpolated. Total: occupied population (15 years
old and over); authors’ calculations.
Time related underemployment (TRU) is the most common labour market indicator directly linked to working hours. Its evolution over the period confirms the adjustment process at stake. As assessed in our previous work, TRU rate doubled during the international financial crisis (Razafindrakoto et al., 2011). The upsurge was quickly absorbed, from 2010 and onwards, TRU rate returning to its pre-crisis minimal levels, providing evidence of the structural resilience of the Vietnamese labour market. Once again, disaggregating by institutional sectors appears much more informative than by industries (Figure 11). For the latter divide, both levels and temporal profiles are quite similar. TRU rates by institutional sectors are much more heterogeneous. Among non-farm activities, household businesses (and among them informal sector) present the highest TRU rate. They were also the most affected by the financial crisis. All sectors returned to their long term levels since 2010. Though statistically non significant, TRU rates are slightly on the rise in 2012 (mostly in construction and manufacturing sector); a trend to be confirmed in the years to come.
35 37 39 41 43 45 47 49 51 53 55 2007 2008 2009 2010 2011 2012
Public including SOE
FDI
Private enterprise
Informal non farm household business Nonfarm household business
Agriculture
23
Figure 11: Time related underemployment rate 2007-2012 (%; nonfarm) A. By industries B. By institutional sectors
Sources: LFS (2007- 2012),GSO, 2008 is interpolated. Total: occupied population (15 years
old and over); authors’ calculations.
2.1.4. Multiactivity
Holding a second job is also a way to compensate for unsatisfactory labour conditions (whether in terms of working hours, earnings, etc.) in time of hardships. At the same time, not all kind of jobs provide the opportunity to hold a second job. For instance, the more you work in your main job, the less you can be involved in a second job at the same time; similarly, the more you earn and the less incentive you have to look for a second job. As expected, the economic slowdown did impact multiactivity rate (Figure 12). From 18% in 2007, it bursts up to 25% in 2009 and 27% in 2010. After a steep decline in 2011 (20%), it began to rise again in 2012 (25%), a 7 percentage points higher level than its pre-crisis level. This dynamics is mainly driven by farming activities, which register both the highest level of multiactivity and its sharpest increase (and are the most numerous). However, the 2007-2009 increase, and to a lesser extend the 2011-2012 one, are shared by all sectors. The structure of secondary jobs also changed significantly. The share of agriculture (in the total of secondary jobs) increased continuously between 2007 and 2011 and gained 10 percentage points in the period under review (from 76% in 2007 to 86% in 2012), mainly at the expense of informal sector jobs (from 19% to 10% respectively); the share of formal sector in secondary jobs being marginal for obvious reasons. This shift confirms the buffer role of farming activities (not only for farmers) stressed above.
0,0 0,5 1,0 1,5 2,0 2,5 3,0 3,5 4,0 2007 2008 2009 2010 2011 2012 Manufacture Construction Trade Services 0 1 2 3 4 5 2007 2008 2009 2010 2011 2012 Public + SOE FDI
Private enterprise Formal NA HHBs Informal NA HHBs
24
Figure 12: Multiactivity by institutional sectors 2007-2012 (%)
A. Rates B. Distribution
Sources: LFS (2007- 2012),GSO, 2008 is interpolated. Total: occupied population (15 years
old and over); authors’ calculations.Data not available in 2010 (for the allocation of second jobs between formal and informal sector).
2.2 Qualitative adjustments
2.2.1. Earned income
Earned income is of principal concern to understand the labour market. It is the main determinant of the living standards of the workers, as illustrated in the WDR 2013 (World Bank, 2012), and it approximates the labour costs. Unfortunately, LFS surveys provide information only on the earned income of wage workers.9 As wage workers represent around one third of the occupied population, a large segment of the labour market remains in the shadow.
The real earned income of wage workers10 has experienced a sustained growth in the period 2007-2012, with an average annual rate of 7.3%. Meanwhile, the real GDP has grown at the
9Since 2010, only wage workers are asked about their earned income.
10 We analyze the real income instead of the nominal income to take into account the price fluctuations and then
to approximate the purchasing power of the workers. The nominal income is deflated to January 2007 price by the monthly Consumer Price Index of GSO. We calculate the real income for the main job only to understand the
0% 10% 20% 30% 40% 50% 2007 2008 2009 2010 2011 2012 Public sector FDI
Private enterprise Formal NFHB Informal sector Agriculture All 0% 10% 20% 30% 40% 50% 60% 70% 80% 90% 100% 2007 2009 2011 2012 Agriculture Informal sector Formal sector
25
average annual rate of 5.9%. This lower rate suggests that wage workers may have benefitted more from the growth than self-employed or family workers. Wage workers with secondary education level and wage workers of the manufacturing sector have benefitted most of this positive dynamic, as shown in Table 2. This result could be explained by the high demand for medium-skilled labour in the manufacturing sector. The increase is slightly higher for women (7.6% compared to 7.2% for men) and for young adults (under 40 years old).
Table 2: Real monthly earning of wage workers (main job) by education and industry, January 2007 price
All Education level Industry sectors
Real income (in 1000 VND) Primary or lower Secondary school High school College or higher Agri-culture Manu-facture
Constru-ction Trade Services 2007 1,360 998 1,123 1,402 2,120 987 1,234 1,228 1,505 1,579 2012 1,938 1,401 1,696 1,928 2,893 1,303 1,877 1,735 2,003 2,215 Average annual
growth rate
(%) 7.3 7.0 8.6 6.6 6.4 5.7 8.8 7.1 5.9 7.0
Sources: LFS (2007, 2012), GSO; authors’ calculation.
Economic fluctuations in the period 2007-2012 may affect the pace of growth of wages through several channels. In time of slowdown, enterprises may moderate wages and premium in order to remain competitive. On the other hand, they can change the structure of their labour force, by hiring less or laying off unskilled workers, but by maintaining their skilled workers who are costly to substitute. In that case, average earned income of wage workers could increase, if laid-off unskilled workers move into non-waged jobs in agriculture or in the informal sector.
As shown in Figure 13, the rate of growth of income of wage workers seems to be impacted by economic fluctuations, but in different ways, depending on the institutional sectors. In the FDI sector, the pace of growth of earned income has followed very closely the economic
effect of economic fluctuations on income, as the workers may compensate the loss of earning in their main job by starting another activity.
26
growth. In time of slowdown, FDI enterprises moderate the pace of income growth, in particular between 2011 and 2012, where the rate of growth of income has become slightly slower than the rate of economic growth (4.7% versus 5.03%, GSO). Wages constitute then a variable of adjustment to economic fluctuation in the FDI sector.
Figure 13: Real monthly earning of wage workers in main job by institutional sector
Sources: LFS (2007, 2009, 2011, 2012), GSO, 2008 and 2010 are interpolated11; authors’ calculation.
Public and private enterprises sector has reacted to the 2008-2009 slowdown but with a time lag. In these sectors, the growth rate of income has increased during slowdown and then has reduced during the two years following the slowdown (the annual rate of income growth in domestic enterprises is 14% between 2007 and 2009, versus 2.4% between 2009 and 2011). In the same way, the pace of income growth was high between 2011 and 2012. The positive income dynamic in time of slowdown is also observed with other sources of data. According to the VHLSS data, the increase of income (for the whole occupied population) was the highest during the period 2008-2010 with a rate of 9.3% per year,12 compared to the periods
11LFS 2010 cannot be used for this analysis because it does not allow to distinguish the earned income of the
main job from those of other activities.
12
However, during the VHLLSS 2008 implementation, interviews were mostly conducted in the second half of the year, while the slowdown hit Vietnam the hardest during the whole year 2008 and up to the first quarter of 2009. Then,part of the effect of the slowdown is captured in the period 2006-2008.
0 500 1000 1500 2000 2500 2007 2008 2009 2010 2011 2012 (i n t h o u sa n d V N D )
Public including SOE
FDI Private enterprise Formal NA household business Informal NA household business
27
2006-2008 and 2004-2006 where the increase was 8.4% and 6.2% per year respectively (GSOb, 2011).
One reason of this positive dynamic and the time lag in the impact of slowdown could be the shift observed in the educational level of the labour force in these sectors. Domestic enterprises have increased substantially the share of high-skilled workers between 2011 and 2012 (+11.5% of workers with higher education) and have diminished the proportion of low-skilled worker (-8.2% of workers with primary education or less).13 This trend is much stronger than the average changes in the educational level in the period 2007-2012 (+5.9% per year of workers with higher education; -5.2% of workers with primary education or less). Therefore, in the domestic enterprises, the mode of adjustment to economic slowdown was not through cutting wages,14 but through laying or reduction of recruitment of low-skilled workers.15 As a consequence, the number of agricultural workers was pushed, highlighting the strong nexus between farm and non-farm activities for low-skilled workers. In time of recovery, domestic enterprises start to recruit low-skilled workers again, explaining the time lag of the effect of economic fluctuation on income. In the public sector, the same trend is observed, even if it is more similar to the average trend in the period 2007-2012, suggesting a low adjustment of public sector wage to economic fluctuations.
In the household businesses sector, the growth of income for wage workers heavily decelerates after the 2008-2009 slowdown, without recovery. Both in formal and informal businesses, the annual rate of wage growth is lower than the rate of GDP growth since 2009 (around 4%). Consequently, the wage gap between the household businesses sector and the other sectors has increased during the three last years.16
13The share of workers with high education has increased from 18.2% in 2011 to 20.3% in 2012, while the share
of workers with primary education or less has reduced from 19.9% to 18.3%.
14Some of the adjustment may have consisted in a reduction of the non-wage part of the earnings (bonuses,
overtime, etc.), but this part is more difficult to observed.
15
Unfortunately, we cannot observe the changes in the educational structure of the labour force in the 2008-2009 slowdown, as the level of education is not included in the 2009 LFS.
16Wage workers represents less than one third of the workers in the household businesses sector. Wage workers
had an higher earned income than own-account workers, who constitute the majority of the workers in this sector.
28 2.2.2. Share of wage workers
The status of wage worker is often associated with more stable and regulated situation. The share of wage worker in the labour force is supposed to increase with economic growth, because of a shift in employment from agriculture to the manufacturing and services sectors. In the 2007-2012 period, a slight shift in employment status can be observed, with an increase of the proportion of wage workers of 2% in average per year (from 32.6% in 2007 to 36% in 2012). The increasing share of wage workers in the non-farm household businesses sector accounted for most of this dynamics, with an annual growth rate of 3.4% compared to 0.2% or less in other institutional sectors.17 Furthermore, it is concentrated in the trade and manufacturing sectors, with growth rates of 4.4% and 3.4%, respectively.
The growing share of wage worker appears to be a structural phenomenon, as it has not systematically adjusted to economic fluctuation during the period under review. However, the speed of this process has dramatically decelerated with the economic slowdown initiated in 2008. Compared to the high growth period (2002-2006), the pace of increase has been halved. According to VHLSS surveys, the share of wage employment experienced a growth of 4% per year in average in the period 2002-2006 (GSO, 2011). The slowing down of the rhythm of this structural change has become more pronounced recently, with a near zero rate of increase between 2011 and 2012. It has even become negative in the household businesses sector, as in construction and trade sectors. In this context, the road to become an industrialized country, generally characterized by a share of wage employment around 80%, is still long.
2.2.3. Informal employment
Informal employment is an important dimension of the quality of jobs, as it reflects the capacity of jobs to help workers to cope with shocks. On the other hand, pioneering works of the IRD-DIAL/GSO team reveal that the informal economy is an important component of Vietnam’s labour market (Cling et al., 2010). This has played critical role in absorbing labour supply in Vietnam as well as possibly worked as a buffer for the labour market during economic slowdown periods (Razafindrakoto et al., 2011). In practice, informal employment
17The share of wage workers is very high in public sector and FDI (almost 100%), as in private enterprises
(around 93%), leaving no much room to an increase. Wage workers are not so prominent in the household businesses sector, neither in agriculture (around 35% in formal household businesses, 30% in informal ones, and 9% in agriculture).
29
is defined as employment not covered by the official social protection schemes (compulsory or voluntary) and this definition is applied to investigate the component of the labour market in Vietnam during the period under review.
Figure 14: Non-farm informal employment by industries and institutional sectors18
Sources: LFS (2007, 2009, 2011, 2012), GSO; authors’ calculation.
Generally, a decreasing trend in the informal employment is observed (Figure 14), especially between 2009 and 2011. In the non-agricultural sector, the share of the informal employment has reduced by 7.3 percentage points, from 71.8% in 2007 to 64.5% in 2012. Similar to the case of the share of wage workers, the contraction of informal employment seems to be driven by structural change19 as the 2008-2009 slowdown did not alter the downward trend. However, the slowdown in the 2011-2012 period did and there was a slight increase in the share.
Going down to the industry level, there is no common pattern across industries. Informal employment in construction was high and stable during the period. The ratio was also high
18Agriculture is excluded because informal employment in this sector is almost 100%. Then, due to the high
share of agriculture in employment, including agriculture masks trends in other sectors.
19 The association between the economic growth and informal employment is popularly agreed to be negative.
The study of Verdera (2013) for Latin American countries empirically confirms this link.
0 20 40 60 80 100 2007 2008 2009 2010 2011 2012 All Nonagricultural employment Manufacture Construction Trade Services 0 20 40 60 80 100 2007 2008 2009 2010 2011 2012 Public including SOE
FDI
Private enterprises
Formal NA household business Informal NA household business
30
but fluctuating in the trade sector. Meanwhile, there was a reduction in service and manufacturing industries. However, the economic slowdown 2011-2012 has decelerated this process in the services sector and this resulted in an increase of the global informal employment.
Under the institutional dimension, changes in informal employment are mainly driven by private enterprises. There has been also a reduction of informal employment in FDI enterprises but the employment share of this sector has been small and it cannot contribute much to the changes of the global informal employment. A huge reduction of 12.3 percentage points between 2010 and 2009 in private enterprises has resulted in a breaking reduction in informal employment between the two years. There has been a continuous reduction in the following year, mainly caused by a suspect decrease of informal employment in household businesses. This decrease in household businesses is hard to be explained, and may be due to measurement error. Therefore, we should reserve a caution in discussing the reduction between 2011 and 2010. Taking into account all above analyses, we can conclude that there has been a decreasing trend in informal employment. The decrease mainly occurred between 2009 and 2010 and possibly in the following year. However, the deceleration of the reduction has been confirmed at least since 2011.
31
Conclusion
As the growth of the labour force tends to diminish sharply because of young generations coming to age of work are smaller, the characteristics of the labour force evolve rapidly. Above all, it releases the tension brought about by an overabundant labour supply in the previous years. As labour supply is reduced, the constraint of absorbing large cohorts in the labour market is now released. Labour absorption is not anymore the main issue. A reduced growth rate of the GDP at 5% is sufficient to absorb new entrants. However, the conditions of this absorption are of principal concern.
Structural changes are sometimes counteracted by short term changes, sometimes confirmed. Yet, the overall impression that prevails is that the Vietnamese labour market is highly resilient in a time of economic slowdown.
The present context, with a reduction of the economic growth, can accelerate the structural evolution. This is for instance the case for the replacement of low skilled workers by more educated ones. It is in the structural trend, since younger generations who are better educated progressively replace less educated old generations, but it is also a response of enterprise to the economic conditions, when they lay-off or at least do not replace low skilled workers while employment of skilled workers continues to grow. This also explains that the labour income of wage workers grows despite the reduction of the GDP growth rate. However, the process may contribute to raise the income gaps between skilled and unskilled workers, as the latter have to move into more vulnerable and less paid employment.
The present economic conditions may also act against the structural trend. While the farm labour force is structurally declining, there has been a surge in farm employment in the last three years. Most probably, this is a consequence of the fewer opportunities of unskilled jobs in non-farm sectors. It is also an indication of how the Vietnamese labour market does work. The farm sector is not isolated from other sectors and acts as a buffer in time of hardship. It also provides second jobs and thus additional income to many workers who are hit by the economic slowdown. As a consequence, unemployment stays at a low rate, because it is not subsided. But labour participation is shrinking slightly, so the number of people without a job increases.
Yet, even with a reduced growth rate, the labour market continues to modernize in the sense that the forms of employment that it provides are more and more those of corporate enterprises in the domestic or foreign sector, i.e. wage labour. Informal employment does not
32
increase, despite the reduction of the growth rate. The labour market can modernize despite adverse economic conditions because labour supply has evolved dramatically in the last years. There are less people coming to the labour market and they are better educated. However, the economic slowdown has negatively impacted the pace of this process.
In addition, the Vietnamese labour market is still highly dependent on the household sector. The performance of other sectors in the recent years must not make forget that the household sector remains the main job provider. Even if one can expect that its share will diminish progressively, it will remain the most important sector for job generation in the coming years.
Vietnam is presently in the most favourable period of the demographic dividend. This probably explains the capacity of resilience of the labour market in a period of economic slowdown. The situation will remain favourable in the coming years. This is a good opportunity to implement policies aiming at improving labour conditions and productivity.