HAL Id: hal-01406467
https://hal.sorbonne-universite.fr/hal-01406467
Submitted on 16 Dec 2016
HAL is a multi-disciplinary open access
archive for the deposit and dissemination of
sci-entific research documents, whether they are
pub-lished or not. The documents may come from
teaching and research institutions in France or
abroad, or from public or private research centers.
L’archive ouverte pluridisciplinaire HAL, est
destinée au dépôt et à la diffusion de documents
scientifiques de niveau recherche, publiés ou non,
émanant des établissements d’enseignement et de
recherche français ou étrangers, des laboratoires
publics ou privés.
Distributed under a Creative Commons Attribution - NonCommercial| 4.0 International
Electrochemical DNA biosensors based on long- range
electron transfer: investigating the efficiency of a fluidic
channel microelectrode compared to an
ultramicroelectrode in a two- electrode setup.
Marie-Charlotte Horny, Mathieu Lazerges, Jm Siaugue, Antoine Pallandre,
Daniel Rose, Fethi Bedioui, Claude Deslouis, Anne-Marie Haghiri-Gosnet,
Jean Gamby
To cite this version:
Marie-Charlotte Horny, Mathieu Lazerges, Jm Siaugue, Antoine Pallandre, Daniel Rose, et al..
Elec-trochemical DNA biosensors based on long- range electron transfer: investigating the efficiency of a
fluidic channel microelectrode compared to an ultramicroelectrode in a two- electrode setup.. Lab on
a Chip, Royal Society of Chemistry, 2016, 16, pp.4373 - 4381. �10.1039/c6lc00869k�. �hal-01406467�
PAPER
Cite this:Lab Chip, 2016, 16, 4373
Received 8th July 2016, Accepted 22nd September 2016 DOI: 10.1039/c6lc00869k www.rsc.org/loc
Electrochemical DNA biosensors based on
long-range electron transfer: investigating the
efficiency of a fluidic channel microelectrode
compared to an ultramicroelectrode in a
two-electrode setup
†
M.-C. Horny,
adM. Lazerges,
bJ.-M. Siaugue,
cA. Pallandre,
dD. Rose,
aF. Bedioui,
bC. Deslouis,
aA.-M. Haghiri-Gosnet
dand J. Gamby*
adHere, we describe the transposition of an ultramicroelectrode (UME) setup into a microfluidic chip configu-ration for DNA biosensors. The hydrodynamic properties of the fluidic channel microelectrode were scre-ened with an [FeIJIII)IJCN)6]3−/[Fe(II)(CN)6]4−redox couple by cyclic voltammetry to provide a basis for further
biological processes. A 23-base DNA probe was self-assembled into a monolayer on gold microelectrodes both in classical configuration and integrated in a microfluidic setup. Special interest was focused on the DNA target mimicking the liver-specific micro-ribonucleic acid 122 (miRNA122). Long-range electron transfer was chosen for transducing the hybridization. This direct transduction was indeed significantly en-hanced after hybridization due to DNA-duplexπ-stacking and the use of redox methylene blue as a DNA intercalator. Quantification of the target was deduced from the resulting electrical signal characterized by cyclic voltammetry. The limit of detection for DNA hybridization was 0.1 fM in stopped flow experiments, where it can reach 1 aM over a 0.5μL s−1flow rate, a value 104-fold lower than the one measured with a
conventional UME dipped into an electrolyte droplet under the same analytical conditions. An explanation was that forced convection drives more biomolecules to the area of detection even if a balance between the speed of collection and the number of biomolecules collected has been found. The latter point is discussed here along with an attempt to explain why the sensor has reached such an unexpected value for the limit of detection.
1. Introduction
A key consideration for biosensors is the limit of detection imposed by the molecular level changes in the expression of biomolecules to be able to perform reliable diagnostics before symptoms of a disease appear. In the context of a new
genera-tion of cheap and portable biosensors, biomolecules present in vivo at physiological levels have to be detected quickly while maintaining high specificity.
In recent years, research studies have focused on micro-ribonucleic acids (miRNAs) as they have been detected in
se-rum and plasma of humans at stable and reproducible levels.1
Indeed, being specific regulators of gene expression under baseline conditions, miRNAs have more pronounced func-tions in case of stress or disease, decreasing or increasing their levels in serum and plasma,2thus opening the possibil-ity of using miRNAs as diagnostic biomarkers of various diseases.3–5They have also been shown to allow precise
differ-entiation and classification of cancers.6,7 For instance,
miRNA122 is only produced by liver cells in case of injury
(hepatitis, alcoholism, obesity).8Commonly, miRNA detection
studies use real-time PCR (polymerase chain reaction).9
Al-though PCR is a powerful technique, it has limitations due to protocol times, cost, accurate quantification, and the need for complete fine tuning of the temperature during multiple
aSorbonne Universités, UPMC Univ Paris 06, CNRS, Laboratoire Interfaces et
Systèmes Electrochimiques, 4 place Jussieu, F-75005, Paris, France. E-mail: Jean.gamby@lpn.cnrs.fr
bUTCBS, U 1022 INSERM, UMR 8258 CNRS, Paris Sciences Lettres University,
Ecole Nationale Supérieure de Chimie de Paris, 11 rue Pierre et Marie Curie, 75005 Paris, France; Sorbonne Paris Cité, Université Paris Descartes, Faculté de Pharmacie de Paris, 4 avenue de l'observatoire, 75006 Paris, France
cSorbonne Universités, UPMC Univ Paris 06, CNRS, UMR 8234, Laboratoire
PHysico-chimie des Electrolytes et Nanosystèmes InterfaciauX (PHENIX), 4 place Jussieu, F-75005, Paris, France
dCentre de Nanosciences et de Nanotechnologies, CNRS, Univ. Paris-Sud,
Université Paris-Saclay, C2N– Marcoussis, 91460 Marcoussis, France
† Electronic supplementary information (ESI) available. See DOI: 10.1039/ c6lc00869k
Open Access Article. Published on 23 September 2016. Downloaded on 30/11/2016 10:25:03.
This article is licensed under a
Creative Commons Attribution-NonCommercial 3.0 Unported Licence.
View Article Online
stages of hybridization/denaturation; thus it still requires fur-ther development to improve its robustness.2,8,10
DNA hybridization is more and more chosen as the most prized method compared to direct sequencing due to a better understanding of the long range electron transfer mechanism
through DNA duplex π-stacking.11 The electronic coupling
within its inner core of a stacked array of heterocyclic aro-matic base pairs is very sensitive to local disruptions such as mismatches, making a DNA biosensor particularly sequence specific. In a DNA biosensor, the target sequence is recog-nized by a complementary DNA probe and hybridized. The hybridization of two basis according to Watson and Crick's rules12is converted into an electrical signal.
In order to be efficient, three key steps have to be con-trolled in a DNA biochip: (i) probe immobilization on a solid substrate, (ii) hybridization (or recognition) of the comple-mentary target strand and (iii) conversion of the hybridiza-tion event into a physical signal (i.e. transduchybridiza-tion). The strat-egies to achieve probe immobilization, target recognition and detection are numerous. A plethora of biosensors can be found in the literature, which differ in the biological process followed, the choice of transduction exploited, and the electrode material used. The literature has a significant num-ber of papers that classify and compare different kinds of biosensors. In the domain of probes grafted on a solid sub-strate for direct hybridization with an unlabelled DNA target by using electrochemical transduction, a wide range of con-centrations are reported in the literature from femtomolar to attomolar and even zettomolar concentrations. For instance, Riccardi et al.13achieved a 2× 10⁻¹⁶M limit of detection by monitoring the changes in oxidation of gold polypyrrole due to DNA hybridization. Differential pulse voltammetry (DPV) was used for direct DNA oxidation on a conducting polymer leading to 10−17 M (ref. 14) and 10−15 M limits of detection
with genomic DNA on polydeoxycytidine.15 Non-faradic
bio-sensors coupled with impedance techniques for screening
the interface charge density have reached a 10−18M limit of
detection on GaN nanowires16and a 10−20M limit of
detec-tion on boron-doped diamond with a polyethyleneimine layer.17Chen et al.10have reported a 10−16M limit of detec-tion with their nanogap sensor with sandwich arrays of gold/ SiO2/gold using long-range electron transfer toward the redox
indicator.
In this work, a traditional two-electrode configuration setup comprising a gold ultramicroelectrode (UME) and a large counterelectrode inspired by the work of Lazerges
et al.18 is compared to its counterpart integrated into a
microfluidic system. The combined use of a microband electrode and a fluidic channel termed a channel microelec-trode offers (i) the obtention of a fast steady state current re-sponse (around one millisecond) due to a very thin diffusion layer compared to the convection layer and (ii) a way to dras-tically improve the efficiency of the sensor in terms of the volume of the analytes and system dynamics with easy
ma-nipulation of samples.19–25 These aims are achieved by the
use of an [FeIJIII)IJCN)6]3−/[Fe(II)(CN)6]4−redox couple in a
chan-nel microelectrode during the immobilization and hybridiza-tion steps in order to set an equilibrium potential at 0 V as both microelectrodes are in gold. DNA hybridization is followed by cyclic voltammetry (CV) with the redox couple allowing surface property analysis, such as surface modifica-tion, when binding events of target DNA occur on the sensor surface. The selectivity of the electrochemical DNA biosensor using an UME was already verified in a previous study using the same protocol scheme where a double-stranded DNA
(miR122) had a single mismatch in the sequence.26
2. Materials and methods
2.1. Chemicals
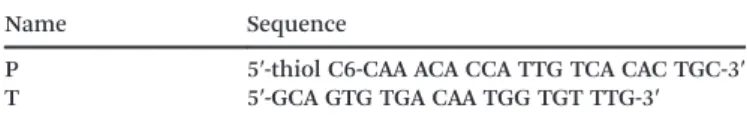
Sodium chloride (NormaPur), methylene blue (Alfa Aesar), potassium ferricyanideIJIII), and potassium hexacyanoferrateIJII) (Sigma-Aldrich) were used in the experiments without further purification. The thiol-labeled DNA probe (P) and comple-mentary target (T) were purchased from Integrated DNA Technologies (Belgium). Their sequences are shown in Table 1. The target DNA used mimics the fragment of interest miRNA-122 for the diagnosis of liver cells in case of injury (hepatitis, alcoholism, obesity).
2.2. Microfluidic chip fabrication
All lithographic masks were designed using L-Edit software (Tanner EDA). The device was microfabricated by assembling an upper PDMS part with a microchannel and a lower part containing gold microelectrodes patterned on a glass sub-strate. Glass substrates were cleaned with a piranha solution (H2SO4/H2O2, 1 : 1) prior to use. The glass slides were then
spin-coated with AZ5214 resin followed by inverted lithogra-phy on an MJB4 aligner. Substrates were then cleaned by a re-active ion etching (RIE) process to remove all resin residues and then metallized with a 200 nm layer of gold on top of a 20 nm titanium layer followed by a classic lift-off process.
The fluidic circuit is obtained from a master mold made of SU-8. Fabrication of the mold starts with the cleaning of
the silicon wafer and lithography of a 16 μm thick layer of
8. A 1 cm thick layer of PDMS is poured onto the SU-8 master mold to obtain a negative replica after curing the
fluidic network at 70 °C overnight. The PDMS and the glass
substrates with the electrodes are washed with isopropanol and dried with nitrogen. Then, the PDMS part is treated with nitrogen plasma to favor the adhesion of the PDMS onto the glass slide. The manual alignment of the PDMS and electrodes is performed under binocular conditions for the correct electrode alignment on the microfluidic channel (see Fig. 1C).
Table 1 Thiol-labeled DNA probe (P) and target (T) sequences
Name Sequence
P 5′-thiol C6-CAA ACA CCA TTG TCA CAC TGC-3′ T 5′-GCA GTG TGA CAA TGG TGT TTG-3′
Lab on a Chip Paper
Open Access Article. Published on 23 September 2016. Downloaded on 30/11/2016 10:25:03.
This article is licensed under a
Creative Commons Attribution-NonCommercial 3.0 Unported Licence.
2.3. Ultra-microelectrode fabrication
The 25μm ultra-microelectrode (UME) was home-made using
99.99% pure Goodfellow gold wire sealed in glass capillaries. The counterelectrode was a 2 mm diameter gold wire sealed in a Teflon cylinder (Metronic, France). The gold UME was
polished with 3μm silicon carbide disks and rinsed with
de-ionized water.
2.4. Probe immobilization and target hybridization
The DNA probe immobilization was performed by incubating the
UME electrode for two hours in a 500μL volume of 10 μg mL−1
DNA probe diluted in 0.5 M NaCl. Then the UME electrode was rinsed with deionized water. Between probe immobilization and target recognition, the UME is in contact for 30 minutes with 0.5 M NaCl to test the stability of the self-assembled monolayer (SAM). Target hybridization was performed in a 500 μL solution of DNA target of decreasing concentration in 0.5 M NaCl solution for 30 minutes followed by rinsing with 0.5 M NaCl solution. An [FeIJIII)IJCN)6]3−/[Fe(II)(CN)6]4−redox couple and a methylene blue
(MB) redox catalyst were added to a 0.5 M NaCl solution for electrochemical detection.
ss-DNA probe immobilization in a microfluidic chip was
performed by circulating a 0.15μM DNA probe in 0.5 M NaCl
and then stopping the flow for two hours. The flushing and the test of stability of the SAM are the same as for the UME. High frequency electric impedance spectroscopy (HFEIS) measurements were performed to estimate the probe density (see the ESI†). A value of 1.1 × 10⁻¹¹mol cm−2SAM coverage was found to roughly match the 4.47× 10⁻¹⁰mol cm−2 experi-mental value found for close-packed short-thiol SAM on gold by Rouhana et al.27
Hybridization was performed under various flow condi-tions with samples of target DNA of increasing concentra-tions in 0.5 M NaCl for 30 minutes.
2.5. Electrochemical detection
For the electrochemical measurement, the UME was im-mersed in a 25μL electrolyte drop, while for the microfluidic chip, a flow of 0.2μL s−1was selected.
Cyclic voltammetry was performed using the two-electrode setup displayed in Fig. 1A. For simplicity, this design will be called the conventional UME setup (Fig. 1A) in contrast to the microfluidic setup (Fig. 1B and C).
Please note that the thiol-gold bond is formed spontane-ously on the surface of both the WE and CE, and thus both electrodes are functionalized with ss-DNA probes. However, for several reasons, the measured current at each step (bare gold, ss-DNA immobilization or ds-DNA hybridization) will be mainly attributed to the WE current response (see Fig. 2). First, the CE was intentionally positioned after the WE (vs. flow), in order to favour DNA-probe immobilization and then DNA-target hybridization on the WE. Second, as the counter-electrode (6× 10⁻³cm2surface area) in the fluidic channel is about 66-fold larger than that of the working microelectrode
(9 × 10⁻⁵cm2), it can be considered as a pseudo reference
Fig. 1 Schematic representations (not to scale). A. Conventional working UME (φ = 25 μm) dipped into FeII/FeIII and methylene blue
(MB) electrolyte on top of the counterelectrode (φ = 2 mm). B. Microchannel electrode configuration. Detection area and fluidic channel microelectrodes with their dimensions. WE stands for working electrode (width, w = 300 μm, length xe= 30 μm), CE stands for
counterelectrode (w = 300 μm, xe= 2 mm), and h and d represent the
fluidic channel height and width, respectively. Note that here w = d. C. Global picture of the microfluidic device comprising several pairs of two-microelectrode networks for multi-detection possibility. The flu-idic microchannel (filled with a red colour dye) with two inlets allows the injection of the sample and the redox couple.
Open Access Article. Published on 23 September 2016. Downloaded on 30/11/2016 10:25:03.
This article is licensed under a
since its current density variation is lower compared to that of the working microelectrode.
2.6. Apparatus
Cyclic voltammetry measurements were performed using EC-lab software from Biologic SP-300 electrochemical station. Both setups have a two electrode configuration. The scan rate
was set to 10 mV s−1 for the microfluidic setup to obtain
quasi-identical forward and backward waves. For the conven-tional configuration, a scan rate of 25 mV s−1was selected.
High frequency electric impedance spectroscopy (HFEIS) measurements were performed by coupling a frequency
re-sponse analyser (Solartron FRA 1255B) with a dielectric inter-face (Solartron DI 1296A) to the apparatus. The frequency range used for measurements was varied from 1 MHz to 0.1 Hz. The sinusoidal AC signal excitation between microelec-trodes is set to 100 mV peak to peak, since DC was fixed at 0 V.
The microfluidic setup was connected to a programmable
syringe pump allowing a flow rate in the range from 0.01 μL
s−1to 5μL s−1.
3. Results and discussion
3.1. Hydrodynamic conditions in the microfluidic channel and mass transport to the microelectrode
The high aspect ratio (d/h) of the fluidic channel (h and d are the height and width of the channel, respectively) ensures a quasi one-dimensional Poiseuille flow. The only velocity
com-ponent is vx in the flow direction, which depends on y, the
coordinate orthogonal to the two parallel planes with a well-known developed parabolic profile, as follows:
(1)
where y varies between −h/2 and +h/2, ∂p/∂x is the pressure
gradient along the flow direction, and μ is the dynamic
viscosity.
One can define the volumetric flow rate Q as follows: (2)
and the wall velocity gradient S as follows:
(3)
This results in the following relation between Q and S: (4)
The concentration distribution of a solute obeys the mass transport equation:
(5)
The diffusion–convection term is reduced to and
the diffusion term to .
The solution of eqn (4) when the electrode acts as an ideal mass sink is obtained with the boundary conditions c = 0 on the electrode and∂c/∂y = 0 on the insulating areas.
Fig. 2 Sigmoidal voltammograms of an equimolar solution of 3 mM [FeIJIII)IJCN)6]3−/[Fe(II)(CN)6]4− and 0.5 M NaCl centred at zero potential
with the two configurations (see Fig. 1). The current densities of the working electrode (WE, left axis in blue) and the counterelectrode (CE, right axis in red) are normalized according to each electrode area. (A) Conventional UME set-up as illustrated in Fig. 1A. Cyclic voltammetric response of an UME as a WE electrode using 10 mV s−1 as the scan rate. B. Microfluidic setup as illustrated in Fig. 1B. Cyclic voltammetric response of a WE microband electrode using 0.05μL s−1as the fixed value of the flow rate and 10 mV s−1as the scan rate.
Lab on a Chip Paper
Open Access Article. Published on 23 September 2016. Downloaded on 30/11/2016 10:25:03.
This article is licensed under a
Creative Commons Attribution-NonCommercial 3.0 Unported Licence.
Given these conditions, L. P. Reiss and T. J. Hanratty28 have predicted the limiting diffusion current to a thin
rectan-gular microelectrode of width w and length xe placed
cross-wise to the flow direction:
Ilim= 0.807nFc∞D2/3xe2/3wS1/3 (6)
where n is the number of electrons exchanged, F is the
Fara-day constant (96 485 C mol−1), c∞ is the concentration of
electroactive species (mol cm−3) and D is the diffusion coeffi-cient of the electroactive species (cm2s−1). xe, w, h and d are
the dimensions (μm) shown in Fig. 1B.
Eqn (6) implies that the diffusion layer thickness is small
enough with respect to h so that vx within is approached by
its linear approximation, as follows:
(7)
For consistency, y is taken here as a local orthogonal coor-dinate from the wall (i.e. y and vxare null at the wall).
Compton29 has proposed an equivalent expression as a
function of the volumetric flow rate (see eqn (1)):
(8)
Note that here w = d.
Therefore, for both eqn (6) and (8) to be valid, it is re-quired that the diffusion layer which develops from the lead-ing edge of the microelectrode (i.e. for x = 0) remains very small at its leaving edge, i.e. for x = xe.
The local diffusion layer thickness is defined as fol-lows:30,31
(9)
whereΓ, the Gamma function, is the factorial function.
In Nernst layer approximation and using Fick's law, eqn (6) or (8) can be obtained from eqn (9) by a straightforward integration.
Therefore, from eqn (9) and (4), one can also check whether the used microelectrode fulfills the condition of a sufficiently small diffusion layer thickness at x = xe.
As an example, for Q = 10−3cm3 s−1corresponding to the
higher imposed volumetric flow rate, and with D = 10−5cm2
s−1, xe= 30μm, h = 40 μm and d = 300 μm, one obtains δxe∼
2.5μm.
This value corroborates the above assumption of a linear velocity profile within the diffusion layer. For much lower Q values, this assumption could not be justified.
In a first step, a test experiment was conducted with a fast redox system. To this end, an equimolar solution of 3 mM [FeIJIII)IJCN)6]3−/[Fe(II)(CN)6]4− and 0.5 M NaCl was introduced
into our designed microchip flow channel containing the
two-microelectrode setup under laminar flow conditions. The results are displayed in Fig. 2.
Sigmoid shape voltammograms are observed as expected for a laminar flow. They are centred at zero potential. Indeed, in this two-electrode setup, the working electrode and the counterelectrode are made from the same metal and are im-mersed in the same electrolyte containing the redox couple. Indeed, the 2 mm gold counterelectrode (very high area
com-pared to the 30 μm gold working electrode) can be
consid-ered as a pseudo-reference electrode allowing a feeble poten-tial drift during measurements.
In order to compare the currents from the conventional setup and the microfluidic setup, the obtained current
curves, IWE, were normalized with the surface of each
work-ing electrode (Sconventional= 1.96× 10⁻⁵cm2and Smicrofluidic=
9.0 × 10⁻⁵ cm2) resulting in a comparable current density,
JWE, at a given potential (in mA cm−2) as shown in Fig. 2.
Moreover, in each configuration, the current density, JWE, on
the working electrode is compared to the one on each counterelectrode, JCE, which is negligible. The scan rate was
optimized at 10 mV s−1 to obtain a steady state current
re-sponse and to minimize the gap between the forward and backward current curves. Moreover, the qualitative differ-ence in the fluidic voltammogram (non-symmetric), where the reduction current is slightly higher than the oxidation current, is due to the difference between the diffusion coef-ficients of [FeIJIII)IJCN)6]3− (D = 6.6 × 10⁻⁶ cm2 s−1) and
[Fe(II)(CN)6]4− (D = 5.6× 10⁻⁶cm2s−1) in NaCl as supporting
electrolytes. For instance, the theoretical ratio between the diffusion coefficients ((DFeIJIII)/DFeIJII))2/3) is equal to 1.12 that
is close enough to the 1.15 experimental ratio between the limiting current in reduction (Ilim,reduction at −0.4 V) and the
limiting current in oxidation (Ilim,oxidation at +0.4 V)
according to eqn (6).
To analyse the hydrodynamics in the fluidic channel microelectrode, a flow rate of increasing value was imposed. The results are shown in Fig. 3. The limiting current plateau is flow dependent as the diffusion layer near the microelec-trode is controlled by the forced convection. While the voltammogram of the UME (Fig. 2A) shows the expected S-shape, the one corresponding to the fluidic channel micro-electrode (Fig. 2B) indicates an apparent more sluggish reac-tion. The cathodic plateau current for example is attained
be-low −0.4 V, whereas this is achieved at −0.1 V for the UME.
The more plausible explanation is the larger value of the ohmic drop between the WE and CE in the fluidic channel.
High frequency electric impedance spectroscopy (HFEIS)32
measurements were performed to estimate the ohmic resis-tance (see eqn S2 in the ESI†).
In Fig. 4, the intensity of the reduction plateau current that has been normalized with eqn (6) is plotted against the volumetric flow rate, (Q)1/3. It can be observed that the devia-tion with respect to the value given by eqn (6) in the low flow rate range is significant. A similar behaviour was observed by Ordeig et al.33in their simulation with a gold microelectrode. They ascribed this low flow rate behaviour to the effect of
Open Access Article. Published on 23 September 2016. Downloaded on 30/11/2016 10:25:03.
This article is licensed under a
edge diffusion at the microelectrodes and channel wall ef-fects which were not taken into account in eqn (6) or (8) at lower flow rates.
3.2. DNA hybridization protocol with the conventional UME Thiols adsorb on gold substrates building self-assembled
monolayers (SAMs) according to eqn (10).21
2R‐SH(aq)+ 2Au(s)→ 2RS ‐ Au(s)+ H2(g) (10)
The use of thiol micromolar concentrations minimizes the contributions of any added impurities to the adsorption ki-netics21onto which reproducibility and stability of the mea-surements are critically dependent. Moreover, with a micro-molar concentration, a full monolayer is built within two
hours.27A value of 1.1 × 10⁻¹¹mol cm−2SAM coverage was
found (see the ESI†). DNA hybridization detection is based
on long range electron transfer through the DNA double
strand via π-stacking as described previously. The
[FeIJIII)IJCN)6]3−/[Fe(II)(CN)6]4−redox couple was use to
discrim-inate a single strand DNA immobilized from a double strand hybridized. Indeed, DNA is wrapped within a nega-tively charged sugar phosphate backbone which prevents dif-fusion of the also negatively charged redox complex inside the SAM. However, the current density before hybridization (red curve, Fig. 5A) is not zero probably due to edge effects and holes in the SAM. After hybridization (blue curve, Fig. 5B), the current–voltage slope is steeper indicating that hy-bridization occurred. The DNA hyhy-bridization response sensi-tivity was obtained with the use of a MB redox intercalator. In brief, methylene blue (MB) is used as both a redox catalyst and a DNA-duplex organic intercalator having an affinity con-stant of 106M−1. The MB reduction step is reversible with a redox potential of 0 (vs. NHE) that is lower than that of [Fe(III)(CN)6]3− reduction. The electrons jump from the gold
electrode to the intercalated MB and are then accepted by the
ferrocyanate in solution. The MB oxidized form is
Fig. 3 Limiting current intensity response of a WE microchannel electrode vs. volumetric flow rates (see Fig. 1B). The channel is filled with an equimolar solution of 3 mM [FeIJIII)IJCN)6]3−/[Fe(II)(CN)6]4− and
0.5 M NaCl. The scan rate is fixed at 10 mV s−1, and five flow rates are shown here: (i) 0.05, (j) 0.08, (k) 0.1, (l) 0.2, and (m) 0.5μL s−1.
Fig. 4 Limiting current ratio between experimental current, Iexp, and
Levich equation current, ILevich, as a function of the 1/3 volumetric flow
rate for the microfluidic setup.
Fig. 5 Effect of hybridization on cyclic voltammetry current with the two configurations. A. Two electrodes in the UME configuration where the kinetic current on a 25μm diameter microelectrode is obtained for FeIJII)/FeIJIII) (3 mM) MB (10−8M) in 0.5 M NaCl in the absence and in the presence of a DNA target. B. LOD determination using the conventional UME set-up (see Fig. 1A) recorded at−0.1 V (see panel A). C. Effect of increasing hybridization target concentrations on the microchannel electrode sensor for a working flow rate of 0.5μL s−1. D. LOD determination using the microfluidic set-up (see Fig. 1C) with sev-eral pairs of microelectrodes (blue circles) recorded at −0.2 V (see panel C).
Lab on a Chip Paper
Open Access Article. Published on 23 September 2016. Downloaded on 30/11/2016 10:25:03.
This article is licensed under a
Creative Commons Attribution-NonCommercial 3.0 Unported Licence.
regenerated for a further electrochemical reduction. The LOD determination and standard deviation on measurements will be discussed in section 3.3.1.
3.3. Hybridization detection in the microfluidic setup 3.3.1. Modelling and theoretical calculations. In order to clarify the mass transport competition between convection
diffusion and reaction kinetics, the rules of thumb
established by Squires et al.34 from Newman's works35were
revealed to be very useful in parallel with Comsol
Multiphysics modelling. The description of hybridization re-action relies on a simple chemical kinetics: DNA targets (T) can hybridize on DNA probes (P) immobilized on the gold surface according to eqn (11).
(11)
The hybridization rate is expressed as follows:
rhyb= khyb·ΓP·[T]0 (12)
where [T]0 andΓP(bm/Na) are the concentration of T-DNA at
the wall and the surface concentration of P-DNA on the sensor.
As shown in eqn (11) and (12), the partial order of reac-tion for each reactant is one and the global order is two. As a
consequence, the observed hybridization rate, robs, between
T-DNA and P-DNA can be viewed as a second order reaction, with robs in M s−1 and kobsin M−1 s−1 representing the
ob-served hybridization kinetic rate constant.
We consider, from time t = 0, the concentration of T at the wall which is lower than the concentration of T in the bulk, i.e. 0< [T]0 ≤ [T]bulk, because the hybridization
reac-tion is considered as slow. However, at infinite time t∞ (i.e.
30 minutes at least for the hybridization time step in our ex-periments), the concentration at the wall tends to the bulk concentration, [T]0 = [T]bulk, and because any P was
hybrid-ized (ΓP)=0, the hybridization rate tends to zero.
As a consequence, the concentration of DS at infinite time, [DS]t=∞, is equal to the initial concentration of (ΓP)t=0,
and then the measured current corresponding to the hybridi-zation step at infinite time becomes proportional to the ini-tial concentration, (i)t=∞∝ (ΓP)t=0.
The dehybridization rate of DS, rdes, is proportional with
the double stranded DNA concentration and it is considered as a zero order reaction since the amount of the adsorbed DS-DNA on the gold microelectrode can be considered as unchanged:
rdes= kdes (13)
with kdes in M s−1 representing the dehybridization kinetic
rate constant.
As a consequence, the ratio (kdes/khyb) is defined as the
equilibrium dissociation constant, KD, which is given in M.
We also consider that the dehybridization rate is negligible in comparison with the hybridization rate, as follows:
rdes≪ rhyb (14)
The transport of target T is described in the analyte stream according to eqn (5) with the obtained value for the
diffusion coefficient of T-DNA being around 10−11 m2 s−1
which is much lower than that of the redox probe, that is in
accordance with an expected thin diffusion layer (DT-DNA ≪
DFeIJIII)).
The flow entrance on the sensor is described as a radial velocity vector. At the outlet, the outflow condition used is given as follows:
n·(−D∇C) = 0 (15)
The hybridization of target DNA at the functionalized sur-face gives rise to a net flux at the corresponding boundaries as follows:
NT=−rhyb+ rdes=−rhyb (16)
The hybridization rate depends on the target concentra-tion in the stream and it was taken into account in numerical calculations where two Comsol Multiphysics modules were coupled (surface reaction and transport of diluted species). In other words, hybridization of targets on the probe creates a concentration gradient which permits the diffusion of spe-cies to the surface. Indeed, diffusion dominates near the sensor while convection predominates further. The analytical resolu-tion of this problem gives a diffusion layer thickness for x = xe
that varies with the flow rate using eqn (9) and (4) as follows. The calculation reveals that the depletion zone is thinner than the sensor surface, as follows:
(17)
As listed in Table 2, the δxe value corresponding to each
imposed volumetric flow rate can be deduced.
Finally, the flow through the depletion zone can be ap-proximated as follows:
(18)
An example of calculation is tested below for 10 fM as ini-tial concentration, 0.2μL s−1as flow rate, a binding-site den-sity, bm, equal to 6.7 × 10¹² sites cm−2 calculated from the
value of SAM's coverage given in section 3.2 and, the equilib-rium dissociation constant of DNA at room temperature that is taken equal to KD= koff/kon= 10−11M.36Consequently, one
can estimate that 4.1 molecules per second will reach the
Open Access Article. Published on 23 September 2016. Downloaded on 30/11/2016 10:25:03.
This article is licensed under a
sensor surface at this working concentration and this flow rate. In other words, 0.24 seconds between binding events can be estimated. As the dehybridization rate constant was supposedly negligible due to the strongly bound DNA duplex
at room temperature,37the expected number of target
mole-cules to be bound to the sensor is given by eqn (19).
NB= JD·t (19)
with t being the hybridization time step.
By taking into account these data, a number of molecules (7.6× 10³) can be estimated during a hybridization time step of 30 minutes. Moreover, the target molecules collected are only those in the thin diffusion layer. The goal is to select an accurate flow in our device configuration that will allow a suf-ficient number of DNA targets to be captured and sensed in 30 minutes reaction time. Although taller channels enable faster flows and quicker measurements, they reduce the rela-tive fraction of biomolecules collected and thus increase the volume of reaction (V) needed. It is obvious that the detection limit imposed by the sensor is related to the local concentra-tion at which one molecule will be bound to the sensor. To this aim, the theoretical number of targets for different ini-tial concentrations and various flow rates are calculated and then listed in Table 2.
As shown in Table 2, it is necessary to strike a balance be-tween a slow flow where all target molecules could be col-lected and a fast flow where target molecules are swept away before they can enter the diffusion layer and be collected. It is obvious that a fast flow increases the volume of solution discarded which is a disadvantage when expensive biological samples are used. Another reason for the choice of an inter-mediary flow rate is that the SAM on gold (thiol-Au) is a frag-ile system. Indeed, the risk of SAM degradation could in-crease and distort the probe current measurement. As a
consequence, for the next experiments, a flow rate of 0.5μL
s−1was selected because it discards less than 1 mL of
solu-tion with an expected theoretical LOD between 1× 10⁻¹⁸and
1× 10⁻¹⁶M.
3.3.2. Experimental LODs and comparison. According to the previous calculation, hybridization run experiments were
performed for an optimized flow rate of 0.5 μL s−1. The
immobilized SAM of single-stranded DNA results in a low current level (red line, Fig. 5C) for which the slope increased with the working concentration of its complementary strand
(blue lines, Fig. 5C). When working with thiolated SAM absorbed on gold substrates, the risk of SAM's desorption must be taken into account. The control experiment has to be periodically recorded because the measured current in-creases after a 30 minute immersion in the background electrolyte. This deterioration of the SAM might come from the gold substrate attacked by the chlorides. For this reason, the probe immobilization and target recognition were prefer-entially conducted in saline solution (0.5 M NaCl solution) in order to reach a dense and compact SAM to ensure reproduc-ibility and biosensor efficiency (to prevent diffusion of redox species through the DNA monolayer).
To gain confidence with the experimental results, the stan-dard deviation (SD) on each experimental point was calcu-lated using the definitions established by Armbruster et al.38 In our case, blank current density measurements, JssDNA, were
recorded (30 minutes in the presence of single-stranded DNA in 0.5 M NaCl without target DNA). Then, the current density, JdsDNA, was measured after the hybridization of the double
stranded DNA (30 minutes in 0.5 M NaCl with target DNA). Finally, the difference between JdsDNAand JssDNA was plotted
with the DNA target concentration, and the LOD was esti-mated by taking the intersection between the linear section of the experimental data and 3-fold of the SD line. As shown in Fig. 5B and D, the error bars were generated using the standard deviation of the means of the difference between the ssDNA current density and the blank current density obtained with the conventional and microfluidic configura-tions. The obtained experimental LODs are summarized in Table 3 where a subfemtomolar and an attomolar concentra-tion can be reached as it was theoretically estimated for stopped flow and with flow, respectively (see Tables 2 and 3).
Conclusions
We describe here the transposition of a conventional two-electrode set-up into a microfluidic one allowing the increase in the system's dynamics and thus the increase in the num-ber of DNA targets hybridizing on the sensor achieving 1 aM as the LOD. This unexpected LOD is due to a forced convec-tion which diminishes the diffusion layer thickness and re-sults in a faster collection of the DNA targets toward the sen-sor. Thus, more targets are collected and contribute to the increase of the hybridization signal.
The advantages of the microfluidic setup in comparison with the UME conventional setup are an easy to use two-electrode configuration for fast screening and a more
Table 2 Theoretical estimation of the number of targets bound to the sensor (NB), volume of solution (V) discarded, and thickness of the
diffu-sion layer (δx
e) for various flow rates (Q) and initial concentrations (c0)
Q (μL s−1) δxe (μm) V (μL) NB(number of targets) 10−14M 10−16M 10−18M Static 31.2 0.009 4.2× 10⁴ 4.2× 10² 4.2 0.2 0.91 360 1.4× 10⁵ 1.4× 10³ 14 0.5 0.67 900 1.9× 10⁵ 1.9× 10³ 19 0.8 0.57 1440 2.3× 10⁵ 2.3× 10³ 23
Table 3 Comparison of the limits of detection (LODs) according to the setup (conventional or microfluidic) and flow rate (Q)
Setup Conventional UME Microfluidic stopped flow Microfluidic with flow Q (μL s−1) — — 0.5 LOD (M) 10−14 10−16 10−18 Lab on a Chip Paper
Open Access Article. Published on 23 September 2016. Downloaded on 30/11/2016 10:25:03.
This article is licensed under a
Creative Commons Attribution-NonCommercial 3.0 Unported Licence.
efficient control of the distance between electrodes. Indeed, there is less risk of damage to the SAM of single-stranded DNA by manipulating the microelectrode, thus decreasing the standard deviation of blank measurements. Another ad-vantage of the electrobiochip described here is the possibility of multi-detection for parallel analysis of numerous miRNAs especially relevant in the case where a cancer manifests through multiple miRNAs, generating a map of miRNA con-centration changes.
Acknowledgements
This work was supported by the LabEx MiChem part of French state funds managed by the ANR within the Investissements d'Avenir programme under reference
ANR-11-IDEX-0004-02. The authors would also like to thank the
“Cen-tre de Nanosciences et de Nanostructures” for its financial
support through the clean room facilities in Marcoussis, France.
References
1 Q. Shi, X. Yang and D. L. Mendrick, Biomarkers Med., 2013, 7, 307.
2 E. Van Rooij, Circ. Res., 2011, 108, 219.
3 T. Adachi, M. Nakanishi, Y. Otsuka, K. Nishimura, G. Hirokawa, Y. Goto, H. Nonogi and N. Iwai, Clin. Chem., 2010, 56, 1183.
4 X. Ji, R. Takahashi, Y. Hiura, G. Hirokawa, Y. Fukushima and N. Iwai, Clin. Chem., 2009, 55, 1944.
5 G. A. Calin, C. D. Dumitru, M. Shimizu, R. Bichi, S. Zupo, E. Noch, H. Aldler, S. Rattan, M. Keating, K. Rai, L. Rassenti, T. Kipps, M. Negrini, F. Bullrich and C. M. Croce, Proc. Natl. Acad. Sci. U. S. A., 2002, 99, 15524.
6 A. M. Gurtan and P. A. Sharp, J. Mol. Biol., 2013, 425, 3582. 7 A. Lujambio and S. W. Lowe, Nature, 2012, 482, 347. 8 L. Moldovan, K. E. Batte, J. Trgovcich, J. Wisler, C. B. Marsh
and M. Piper, J. Cell. Mol. Med., 2014, 18, 371.
9 B. S. Ferguson, S. F. Buchsbaum, J. S. Swensen, K. Hsieh, X. Lou and H. T. Soh, Anal. Chem., 2009, 81, 6503.
10 X. Chen, S. Roy, Y. Peng and Z. Gao, Anal. Chem., 2010, 82, 5958. 11 S. O. Kelley, E. M. Boon, J. K. Barton, N. M. Jackson and
M. G. Hill, Nucleic Acids Res., 1999, 27, 4830.
12 J. D. Watson and F. H. C. Crick, Nature, 1953, 171, 737. 13 C. D. S. Riccardi, H. Yamanaka, M. Josowicz, J. Kowalik, B.
Mizaikoff and C. Kranz, Anal. Chem., 2006, 78, 1139.
14 K. Arora, N. Prabhakar, S. Chand and B. D. Malhotra, Sens. Actuators, B, 2007, 126, 655.
15 E. Alipour, M. H. Pournaghi-Azar, M. Parvizi, S. M. Golabi and M. S. Hejazi, Electrochim. Acta, 2011, 56, 1925.
16 C. P. Chen, A. Ganguly, C. Y. Lu, T. Y. Chen, C. C. Kuo, R. S. Chen, W. H. Tu, W. B. Fischer, K. H. Chen and L. C. Chen, Anal. Chem., 2011, 83, 1938.
17 J. Weng, J. Zhang, H. Li, L. Sun, C. Lin and Q. Zhang, Anal. Chem., 2008, 80, 7075.
18 M. Lazerges, V. T. Tal, P. Bigey, D. Scherman and F. Bedioui, Sens. Actuators, B, 2013, 182, 510.
19 J. S. Rossier, M. A. Roberts, R. Ferrigno and H. H. Girault, Anal. Chem., 1999, 71, 4294.
20 K. Stulik, C. Amatore, K. Holub, V. Marecek and W. Kutner, Pure Appl. Chem., 2000, 72, 1483.
21 C. Amatore, C. Sella and L. Thouin, J. Electroanal. Chem., 2006, 593, 194.
22 I. Streeter, N. Fietkau, J. Del Campo, R. Mas, F. X. Munoz and R. G. Compton, J. Phys. Chem. C, 2007, 111, 12058. 23 D. Suwatchara, M. C. Henstridge, N. V. Rees and R. G.
Compton, J. Phys. Chem. C, 2011, 115, 14876.
24 H. Wang, Y. Liu, C. Liu, J. Huang, P. Yang and B. Liu, Electrochem. Commun., 2010, 12, 258.
25 M. Faure, A. Pallandre, S. Chebil, I. Le Potier, M. Taverna, B. Tribollet, C. Deslouis, A.-M. Haghiri-Gosnet and J. Gamby, Lab Chip, 2014, 14, 2800.
26 A. Nassi, F. X. Guillon, A. Amar, B. Hainque, S. Amriche, D. Maugé, E. Markova, C. Tsé, P. Bigey, M. Lazerges and F. Bedioui, Electrochim. Acta, 2016, 209, 269.
27 L. L. Rouhana, M. D. Moussallem and J. B. Schlenoff, J. Am. Chem. Soc., 2011, 133, 16080.
28 L. P. Reiss and T. J. Hanratty, AIChE J., 1963, 9, 154.
29 R. G. Compton, A. C. Fisher, R. G. Wellington, P. J. Dobson and P. A. Leigh, J. Phys. Chem., 1993, 97, 10410.
30 M. A. Lévêque, Ann. Mines, 1928, 13, 283. 31 S. C. Ling, J. Heat Transfer, 1963, 85, 230.
32 M. Faure, B. Sotta and J. Gamby, Biosens. Bioelectron., 2014, 58, 61.
33 O. Ordeig, N. Godino, J. Del Campo, F. X. Muñoz, F. Nikolajeff and L. Nyholm, Anal. Chem., 2008, 80, 3622. 34 T. M. Squires, R. J. Messinger and S. R. Manalis, Nat.
Biotechnol., 2008, 26, 417.
35 J. Newman, in Electroanalytical Chemistry, ed. Bard A., Dekker, New York, 1973, vol. 6.
36 P. W. Stevens, M. R. Henry and D. M. Kelso, Nucleic Acids Res., 1999, 27, 1719.
37 T. E. Ouldridge, A. A. Louis and J. P. K. Doye, J. Chem. Phys., 2011, 134, 085101.
38 D. A. Armbruster and T. Pry, Clin. Biochem. Rev.,
2008, 29(Suppl 1), S49.
Open Access Article. Published on 23 September 2016. Downloaded on 30/11/2016 10:25:03.
This article is licensed under a
![Fig. 2 Sigmoidal voltammograms of an equimolar solution of 3 mM [Fe IJ III ) IJ CN) 6 ] 3− /[Fe( II )(CN) 6 ] 4− and 0.5 M NaCl centred at zero potential with the two configurations (see Fig](https://thumb-eu.123doks.com/thumbv2/123doknet/14493333.526312/5.892.82.416.60.639/sigmoidal-voltammograms-equimolar-solution-nacl-centred-potential-configurations.webp)


