Opinion Paper
Caroline Le Goff
a,*, Jordi Farre-Segura
a, Violeta Stojkovic, Patrice Dufour, Stéphanie Peeters,
Justine Courtois, Adrien Nizet, Nathalie De Vos and Etienne Cavalier
The pathway through LC-MS method development:
in-house or ready-to-use kit-based methods?
https://doi.org/10.1515/cclm-2019-0916
Received August 29, 2019; accepted January 21, 2020
Abstract: Historically, the determination of low con-centration analytes was initially made possible by the development of rapid and easy-to-perform immunoas-says (IAs). Unfortunately, typical problems inherent to IA technologies rapidly appeared (e.g. elevated cost, cross-reactivity, lot-to-lot variability, etc.). In turn, liquid chromatography tandem mass spectrometry (LC-MS/MS) methods are sensitive and specific enough for such analy-ses. Therefore, they would seem to be the most promis-ing candidates to replace IAs. There are two main choices when implementing a new LC-MS/MS method in a clini-cal laboratory: (1) Developing an in-house method or (2) purchasing ready-to-use kits. In this paper, we discuss some of the respective advantages, disadvantages and mandatory requirements of each choice. Additionally, we also share our experiences when developing an in-house method for cortisol determination and the implementa-tion of an “ready-to-use” (RTU) kit for steroids analysis. Keywords: in-house method; kit ready to use; mass spectrometry.
Introduction
Clinical chemistry, as a medical discipline, plays an essential role in clinical decision-making as two out of
three medical decisions rely on laboratory tests [1]. Hence, laboratories need to strictly monitor the analytical perfor-mances of these tests to provide the best quality results. The robust detection of minute amounts of a compound contained within matrices of various complexities poses a tremendous analytical challenge [2]. A clear example of this situation is hormone quantification, one of the most troublesome determinations in a clinical laboratory. Generally, hormones are found in circulation at very low concentrations (i.e. in the picomolar range). Historically, the determination of these low levels was made possible by the development of rapid and easy-to-perform immu-noassays (IAs). Unfortunately, typical problems inherent to IA technologies are well-known, i.e. their elevated cost per analysis, lot-to-lot differences leading to calibration biases, interferences caused by heterophilic antibodies, cross-reactivity issues and high-dose hook effects, among others [1, 3–6]. Additionally, antibody-based methods can have good sensitivity but may lack specificity [4, 7, 8].
Also, in turn, liquid chromatography tandem mass spectrometry (LC-MS/MS) is the most promising candi-date to replace IAs. This technique enables qualified end-users to develop analytical methods for an extremely wide range of potential target analytes with high analytical sensitivity, specificity, precision, accuracy and excellent reproducibility, allowing for the simultaneous analysis of several analytes [2, 9].
This could explain why this technique is becoming an essential tool in clinical laboratories, allowing for a higher-end analytical ability overcoming the major limita-tions of IAs [10, 11].
In-house development of an LC-MS/MS method is not an easy task and can sometimes take a very long time, depending on the nature and complexity of the analysis. Companies, such as Chromsystems (Gräfelfing, Germany), Biotage (Uppsala, Sweden) and Perkin-Elmer (Waltham, MA, USA), offer “ready-to-use” (RTU) kits to avoid end-user method development and approximate to a plug-and-play operation.
However, on the 26th of May 2022, legislation will change, and in-house methods will need to fulfil the
aCaroline Le Goff and Jordi Farre-Segura contributed equally to this
work.
*Corresponding author: Caroline Le Goff, Department of Clinical
Chemistry, University Hospital of Liege (CHU-ULiege), Liege, Belgium, E-mail: [email protected]
Jordi Farre-Segura, Violeta Stojkovic, Patrice Dufour, Stéphanie Peeters, Justine Courtois, Adrien Nizet and Etienne Cavalier:
Department of Clinical Chemistry, University Hospital of Liege (CHU-ULiege), Liege, Belgium
Nathalie De Vos: Department of Medical Chemistry, Free University
general safety and performance requirements set out in annex I of the Regulation (EU) 2017/746 of the European Parliament and of the Council of 5 April 2017 on in vitro diagnostic medical devices (IVDR).
Health institutions manufacturing medical devices for in vitro diagnostic use shall achieve the analytical performances and, in particular and where applicable, the analytical sensitivity, analytical specificity, true-ness (bias), precision (repeatability and reproducibility), accuracy (resulting from trueness and precision), limit of detection (LOD) and limit of quantification (LOQ), meas-uring range, linearity, cut-off, including determination of appropriate criteria for specimen collection and handling, control of known relevant endogenous and exogenous interference and cross-reactions. The IVDR emphasizes the importance of patient safety during the lifetime of the device and therefore requires supplemental clinical performance (such as, where applicable, diagnostic sen-sitivity, diagnostic specificity, positive predictive value, negative predictive value, likelihood ratio, and expected values in normal and affected populations) and a risk management system with continuous risk evaluation.
Upon request of the competent authority, the health institution will need to provide information about its in-house method, including a justification of its use, declar-ing that the target patient group’s specific needs cannot be met or cannot be met at the appropriate level of perfor-mance by an equivalent device available on the market.
Thus, a dichotomy exists between the two available paths regarding LC-MS/MS analysis, i.e. the exploitation of RTU kits or the development of in-house methods. Each of them poses different requirements for successful opera-tion as described in the present paper with two illustrating examples of analysis.
Ready-to-use kits
An RTU kit for the LC-MS/MS analysis of steroids (Steroid
MassChrom) acquired from ChromSystems® will be used
as an example. This kit was initially set up in our LC-MS/ MS system by a company engineer who also trained the analysts on how to perform the required sample prepara-tion. In such a case, as recommended by the manufac-turer, only a performance evaluation is required to start using the recently installed method.
The evaluation of performance and establishment of the reference range values for 13 steroids was completed by using the above-mentioned kit. The system we used for this study consisted of a QT6500 mass spectrometer
from Sciex (Framingham, MA, USA) coupled to a Nexera X2 liquid chromatograph from Shimadzu (Kyoto, Japan). Details about the solid phase extraction (SPE), chromato-graphic column and mobile phases are proprietary, and thus, they are not known by the final user. SPE plates were treated with the supplied materials duly labelled with the step in which they were to be used for. After conditioning, 500 μL of serum/quality control/calibrator diluted with “extraction buffer” and a deuterated internal standard were placed in the 96-well plate, washed and eluted. Finally, the eluent was evaporated and reconsti-tuted to obtain ready-to-analyse samples according to the provided protocol.
The LC for this method relies on two different chromatographic profiles, denoted as panels, on behalf of a relatively short analysis time. If all steroids were to be detected in one run, the runtime would be significantly longer due to the specific separation conditions required by this class of analytes. Panel 1 (mineralocorticoids) has a run time of 10.5 min and is designed for aldosterone, corticosterone, cortisol, cortisone and 11-deoxycortisol. On the other hand, panel 2 (sex-related hormones) takes 12.5 min to complete, and it is designed for androsten-edione, dehydroepiandrosterone (DHEA), dehydroepian-drosterone sulfate (DHEAS), dihydrotestosterone (DHT), oestradiol, 17 α-hydroxyprogesterone, progesterone and testosterone.
The different retention times of the compounds allow for the MS to be configured in different acquisition windows, so not all the transitions for all the compounds are analysed at once but just those for the compounds expected to elute at a given retention time.
To evaluate the performance, a calibration curve containing all steroids of the kit was prepared using six points, whose responses were determined by calculating the integrated peak area ratio between natural steroids and their respective deuterated analogues.
The procedure was validated by testing the sup-plied quality control samples “MassCheck Steroid Serum Control” at three concentration levels in triplicate on three different days to determine the precision (intra-assay and inter-assay) and accuracy profile. The linearity of the cali-bration curves in serum was assessed by performing least squares linear regression. Recovery was calculated with the expected values of the same quality control samples. The LOD and LOQ were described as the average signal to noise ratio (S/N). The LOD and LOQ were defined as 3:1 and 10:1, respectively.
Correlation with routinely used IAs was performed by using Passing-Bablok regressions and Bland-Altman difference plots.
The following acceptance criteria for the method performances were established by Fraser and Petersen [12, 13].
The obtained results were satisfactory for all the compounds except for DHEAS, DHT and testosterone, for which one of the points in the validation showed a coef-ficient of variation (CV) value above desirable limits. For oestradiol, which performed successfully according to the desirable specification, it was observed that the lowest point of the calibration curved was at 40 ng/L, which is too high for some clinical cases. Indeed, the reference range for oestradiol is <6 ng/L for men [14]. Furthermore, the lowest control concentration of the kit was also very high (80 ng/L). The same remark can be made for DHT: the first point of the calibration curved was too high (0.08 μg/L), as stated by the reference values, which are from 0.02 to 0.15 μg/L [15]; therefore, the first level of validation was already too high for the intended clinical application, missing any information about the method performance on the low-concentrated samples. Recovery values were always approximately 100%. For the inter-method com-parison, all the analytes were compared with a routinely used method. For example, for cortisol and DHEAS, the routinely used method is the COBAS 8000 method (Roche Diagnostics, Manheim, Germany), for which the Passing-Bablok regression highlighted a bias of approximately 10% for cortisol and approximately 29% for DHEAS. The 17-hydroxyprogesterone analysis was compared to a routine RIA method, whose spuriosity revealed an enor-mous difference between techniques.
In regard to this comparison, it is shown that chang-ing the measurement method requires the establishment of new reference values for all compounds.
The ISO 15189 Guidelines only request verification of the reference provided by the manufacturers, but as the reference ranges provided by ChromSystems came from an IA and had not been established by LC-MS/MS, we had to establish them ourselves. Hence, we enrolled 767 healthy Caucasian volunteers (514 adults and 253 chil-dren) for that purpose. All participants gave informed consent. The inclusion criteria for participants were: being normotensive (blood pressure <140/90 mmHg), not being under antihypertensive or corticosteroid treatment, non-smokers and not taking any oral contraception. All the samples from the fasting volunteers were centrifuged immediately after blood draw (in all the cases in the morning) for 10 min at 2500 g, aliquoted and stored frozen at –80 °C before analysis.
Different reference values were calculated according to age, Tanner stage and sex, as it is proven that they have a great influence on the steroid serum concentrations.
In-house LC-MS/MS methods
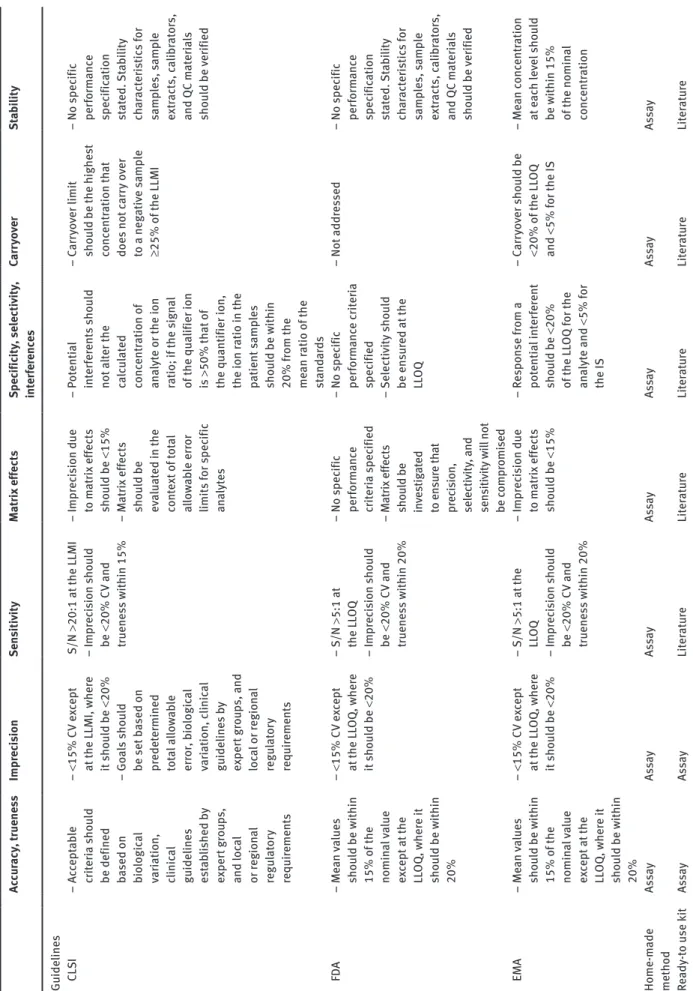
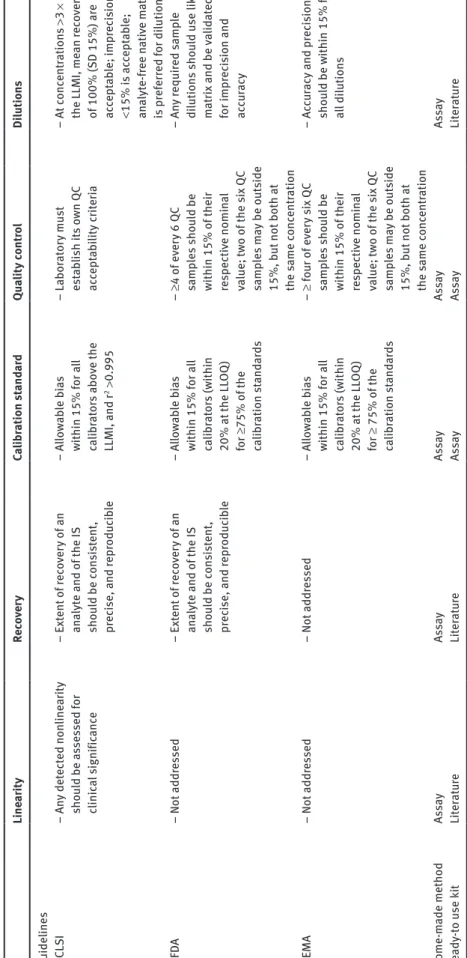
An alternative to kits is to develop in-house methods from published studies working on analytes of similar prop-erties or, in many cases, from scratch. This alternative is naturally more exacting, as the development and valida-tion of the methods have to be extensively done to assure a robust performance. For that purpose, some guidelines are available and must be followed to comply with the cri-teria depending on the compound and the chosen accredi-tation, as shown in Table 1, adapted from Lynch [16].
As a starting point for new method development, it is recommended performing a full scan prior to MS/ MS analysis from infusion of individual standards to select the best transitions and MS parameters (ion spray voltage, gas flow, desolvation temperature, etc.). These parameters will be used in the new MS method. Next, an appropriate chromatographic column must be chosen depending on the nature of the selected analytes. Several conditions, such as gradients and solvents, must be tested until optimal LC separation is achieved with narrow, sym-metrical and interference-free peaks, and retention times and column performance must also be assessed over mul-tiple injections. Different sample preparation approaches are normally tested, such as liquid-liquid extraction (LLE), SPE, micro-SPE, solid-liquid extraction (SLE) or only protein precipitation, which are among the most commonly used methods [17]. Validation should only be conducted when the method satisfies the expected perfor-mance goals. It is important to note that all parameters must remain unchanged as soon as validation has begun.
Method development on our TQ5500 (Sciex) coupled to an AD20XR HPLC system (Shimadzu) for cortisol detection in serum samples is hereafter described as an example.
This method was validated in accordance with the guidelines of the CLSI [16].
Calibration curve linearity was assessed by testing the best fit (linear, quadratic and cubic non-linear least squares regression) of 20 different curves containing seven concentration levels. Linear regression provided the best result. The predefined tolerance limits were 10.3% (bias) and 7.6% (CV), with R values >0.99 and slope CV values <5%. The mean bias obtained was 9.9%, and the CV was 6.5%, with an R value of 0.9998. The calculated slope CV was 0.7%, which was, overall, satisfying.
The LOQ was determined according to the CLSI guide-lines, and seven low-concentration samples were ana-lysed in 15 runs. The lowest tested concentration with a CV lower than 20% was established as the LOQ (1.15 nmol/L). The LOD, set at 1.05 nmol/L, was calculated as specified
Ta ble 1: P er form anc e s pec ific ation f or quantit ati ve method s. Ac cu racy , t ruene ss Impr ec is ion Sen siti vity M at rix eff ect s Spec ific ity , selecti vity , int er fer enc es Carr yo ver St ab ility Guideline s C LS I – Ac cept ab le cri te ria sh oul d be defined based on bio logic al var iation, clinic al guideline s es ta bl is he d by ex per t gr ou ps, and loc al or r egion al regu lat or y requir ement s – <15% CV e xc ept at
the LLMI, wher
e it s ho uld be <20% – Goals sh oul d be set b ased on pr edet ermined to ta l a llo wa bl e err or , b io logic al var iation, c linic al guideline s b y ex per t gr ou ps, and loc al or r egion al regu lat or y requir ement s S/N >20:1 at the LLMI – Impr ec is ion s ho uld be <20% CV and truene ss w ithin 15% – Impr ec is ion due to m at rix eff ect s sho uld be <15% – M at rix eff ect s sho uld be ev aluat ed in the co nte xt o f to ta l al lo wa ble err or limit s f or s pec ific an alyt es – Pot enti al int er fer ent s s ho uld not a lter the cal cula te d conc ent ration of an alyt e or the ion ratio; if the s ign al of the qua lifier ion is >50% th at of
the quantifier ion, the ion r
atio in the patient samp le s sho uld be w ithin 20% f rom the me an r atio of the st an da rds – Carr yo ver limit sho uld be the highe st conc ent ration th at doe s not carr y o ver to a neg ati ve s amp le ≥25% of the LLMI – No s pec ific per form anc e spec ific ation st at ed . St ab ility ch ar act er is tic s f or samp le s, s amp le ext ract s, c ali br at or s, and QC m at er ia ls sho uld be v er ified FD A – Me an va lue s sho uld be w ithin 15% of the nomin al va lue ex cept at the LL OQ , wher e it sho uld be w ithin 20% – <15% CV e xc ept at the LL OQ , wher e it s ho uld be <20% – S/N >5:1 at the LL OQ – Impr ec is ion s ho uld be <20% CV and truene ss w ithin 20% – No s pec ific per form anc e cr iter ia s pec ified – M at rix eff ect s sh oul d b e in ve stig at ed to en su re th at pr ec ision, selecti vity , and sen siti vity w ill not be c ompr omi sed – No s pec ific per form anc e c rit er ia spec ified – Selecti vity sho uld be en su red at the LL OQ – Not addr es sed – No s pec ific per form anc e spec ific ation st at ed . St ab ility ch ar act er is tic s f or samp le s, s amp le ext ract s, c ali br at or s, and QC m at er ia ls sho uld be v er ified EMA – Me an va lue s sho uld be w ithin 15% of the nomin al va lue ex cept at the LL OQ , wher e it sho uld be w ithin 20% – <15% CV e xc ept at the LL OQ , wher e it s ho uld be <20% – S/N >5:1 at the LL OQ – Impr ec is ion s ho uld be <20% CV and truene ss w ithin 20% – Impr ec is ion due to m at rix eff ect s sho uld be <15% – Re spon se f rom a pot enti al int er fer ent sho uld be <20% of the LL OQ f or the an alyt e and < 5% f or the IS – Carr yo ver s ho uld be <20% of the LL OQ and < 5% f or the IS – Me an c onc ent ration at e ac h lev el sho uld be w ithin 15% of the nomin al conc ent ration Home-m ade method As sa y As sa y As sa y As sa y As sa y As sa y As sa y Re ady -to u se k it As sa y As sa y Li te ra tur e Li te ra tur e Li te ra tur e Li te ra tur e Li te ra tur e
Ta ble 1 (c ontinued) Line ar ity Rec ov er y Ca libr ation s tand ar d Qua lity cont ro l Di lution s Guideline s C LS I – An y det ect ed non line ar ity sho uld be a sse ssed for clinic al signific anc e – Ext ent of rec ov er y of an an alyt e and of the IS sho uld be c on si st ent , pr ec ise, and repr oduc ib le – All owa bl e b ias within 15% f or a ll ca libr at or s a bo ve the LLMI, and r 2 > 0.995 – La bor at or y mu st est ab lish its ow n Q C ac cept ab ility cr iter ia – At conc ent ration s >3 × the LLMI, me an r ec ov er ie s of 100% (S D 15%) ar e ac cept ab le; impr ec is ion <15% i s ac cept ab le; an alyt e-f ree n ati ve m at rix is pr ef err ed for di lution FD A – Not addr es sed – Ext ent of rec ov er y of an an alyt e and of the IS sho uld be c on si st ent , pr ec ise, and repr oduc ib le – All owa bl e b ias within 15% f or a ll ca libr at or s (w ithin 20% at the LL OQ ) for ≥75% of the ca libr ation s tand ar ds – ≥4 of ev er y 6 QC samp le s s ho uld be within 15% of their re specti ve nomin al va lue; tw o of the s ix QC samp le s m ay be o ut side 15%, b ut not both at the s ame c onc ent ration – An y r equir ed samp le di lution s s ho uld u se li ke m at rix and be va lid at ed for impr ec is ion and ac cu racy EMA – Not addr es sed – Not addr es sed – All owa bl e b ias within 15% f or a ll ca libr at or s (w ithin 20% at the LL OQ ) for ≥ 75% of the ca libr ation s tand ar ds – ≥ f our o f e ve ry six Q C samp le s s ho uld be within 15% of their re specti ve nomin al va lue; tw o of the s ix QC samp le s m ay be o ut side 15%, b ut not both at the s ame c onc ent ration – Ac cu racy and pr ec is ion sho uld be w ithin 15% f or al l di lution s Home-m ade method As sa y As sa y As sa y As sa y As sa y Re ady -to u se k it Li te ra tur e Li te ra tur e As sa y As sa y Li te ra tur e CV . c oeffic ient of var iation; S/N, s ign al to no ise r atio . Ad apt ed fr om L ync h [16].
in the European Pharmacopoeia, a concentration leading to an S/N ratio higher than 3. To calculate this value, 22 samples with very low concentrations were used.
For inter-assay precision, six different concentra-tion levels of spiked analyte-free serum were analysed individually in 20 different runs; in turn, for the intra-assay precision, the same levels were repeated 20 times in a single run. All CVs were acceptable according to the biological variation EFLM database. For the dilutional linearity, a high-concentration serum sample was diluted with cortisol-free serum at different percentages (100, 90, 75, 50 and 25%). Each dilution was determined in quin-tuplicate. A very good linearity was obtained; the best polynomial fit obtained was compared to the linear fit by means of a difference plot. The difference between the linear and polynomial regression was between −15 and 15% according to the CLSI-EP6 procedure. For the trueness, 34 European Reference Material samples with assigned values were measured in duplicate. The CV and the bias were below 15%, as expected. Uncertainty meas-urements were performed in duplicate in 13 runs utilizing the internal quality control “MassCheck Steroid Serum Control”. The results were below the maximum desirable total allowable error.
A comparison between cortisol determinations using the quantifier MRM transition versus the qualifier MRM transition was performed in 36 samples. The regres-sion relationship between the two MRM transitions was qualifier = 0.97 × quantifier + 16.5 nmol/L.
A matrix comparison was performed by testing 20 plasma (EDTA) and serum samples in duplicate, which were run in parallel in the same batch. The bias between both was only 1.3%.
The LC-MS/MS method was compared to the Cobas 8000 by running the same 20 samples on each. The obtained mean bias was 3.7% lower in the LC-MS/MS.
The stability of the extracted samples was evaluated with 20 samples injected twice, first at T0 (0 h) and the second at T4 (4 h) at room temperature. Later, 20 samples were injected twice, first at T0 (0 h) and second at T72 (72 h) after remaining at 8 °C in the LC autosampler. Biases were below 1.6% in both cases.
Matrix effects were evaluated by comparing two sets of samples. The first of the sets consisted of eight different patient samples spiked after extraction on top of already-known amounts of cortisol. The second set of samples were neat solutions also spiked after extraction. Both sets were spiked with cortisol at two different concentrations. The response obtained in both sets was used to calculate the matrix effect. Similarly, samples were spiked before extraction to assess the extraction recovery [18]. Matrix
effects were lower than 10% in all cases. Recovery means were approximately 87% (CV: 4.6%) and 76% (CV: 9.8%) for the low and high concentrations, respectively.
Evaluation of the memory effect was performed by analysing 21 samples at alternating low and high con-centrations according to an established protocol by our validation software (EP Evaluator). No memory effect was observed. All the results of the analytical validation are available in the Supplementary material.
Discussion
MS supposes a radical change in the perspectives of clinical laboratory analysis. This technique is a step forward full of advantages over the long-time used IAs, including the ability for the users to develop their own analytical methods that can include more than one com-pound at a time. As a setback, the equipment and the required servicing have an elevated cost, which could cur-rently hamper the transition from IAs. In any case, LC-MS/ MS is still not a flawless technique because of the high complexity of the biological matrices. Analytes detected via LC-MS/MS are subject to matrix effects and ion sup-pression, which could adversely impact the analytical performance. Possible isobaric interferences need to be studied for a complete method validation, as they could easily cause quantification errors [19–21]. Additionally, there is an evident lack of standardization between some of the different laboratories using LC-MS/MS, especially in those analyses for which a certified reference material is not available.
Either when developing a new method or adopting an RTU kit, it is mandatory to establish new reference intervals, which are essential for the interpretation of the results. This is time-consuming as the International Fed-eration of Clinical Chemistry recommends enrolling no less than 120 healthy subjects [22], which might not be an easy task. On the other hand, IA reference intervals were determined from over nearly 50 years of studies; consequently, new reference intervals obtained from new LC-MS/MS methods will take some time to be generally accepted [2].
In this paper, we have shared our experience with an RTU kit and in the development of an in-house method. Indeed, developing an in-house method is not easy and requires more experience than implementing an RTU kit. Additionally, some disappointment can be expected during the development of an in-house method for the reasons explained. An in-house method will be nor-mally easier to troubleshoot, as it is comprehensively
understood, contrary to the RTU kits, whose information about the chromatographic column, mobile phase and sample preparation, among others, is unknown. Addi-tionally, when kits are used, blind confidence is put in the manufacturer as only some of the parameters shown in Table 1 are checked. Special attention should be paid, as sometimes, not all devices perform equally and not all the shown data should be trusted without further study. For instance, in our steroid RTU kit datasheet, some of the provided reference values were established by IAs and not by LC-MS/MS.
Some of the LC-MS/MS RTU kits are commercially available with CE labels and FDA clearance. They are easier to implement for non-specialists in MS and allow for a faster set up as they follow a thorough validation [17]. The kits are nevertheless expensive compared to the cost of an in-house method, whose development is also expen-sive but becomes more economic with routine use.
The example shown in this paper for in-house corti-sol analysis has still not yet been fully validated. Interfer-ences, such as other drugs, similar compounds and the sample composition (haemolysis, lipaemia, icterical), and, ideally, the stability of the material (calibrators, quality controls, internal standards, stock solutions), still have to be evaluated.
To fulfil the IVDR, method validation integrating an analytical and clinical evaluation will be required for both RTU and in-house methods. Clinical perfor-mances are easy to check in a clinical environment when developing an in-house method. However, it could be challenging or even impossible for RTU-developing companies. Indeed, to validate the clinical applications (negative-positive predictive value, etc.) of an analyte, it is necessary to have access to the patient samples and medical files (after the approval of an Ethics Com-mittee), which are undoubtedly more accessible in a hospital environment than for RTU manufacturers. In our example regarding cortisol analysis, a good way to further validate this method would be to select Cushing and non-Cushing patients and check that our method allows for us to discriminate them well. As we previ-ously discussed, the new legislation is becoming more demanding for IVD companies. Additionally, it will be even more complicated for smaller manufacturers to gain access to clinical data for RTU kit development and fulfilment of all the required items.
As similar performance should be expected for RTU and in-house methods, LC-MS/MS method development should not be exclusive to IVD manufacturers, and there should also be allowance for those developing their own, provided that all IVDR requirements are met.
Author contributions: All the authors have accepted responsibility for the entire content of this submitted manuscript and approved submission.
Research funding: None declared.
Employment or leadership: None declared. Honorarium: None declared.
Competing interests: The funding organization(s) played no role in the study design; in the collection, analysis, and interpretation of data; in the writing of the report; or in the decision to submit the report for publication.
References
1. Vogeser M, Seger C. LC–MS/MS in clinical chemistry. J Chromatogr B 2012;883–884:1–2.
2. Carvalho VM. The coming of age of liquid chromatography coupled to tandem mass spectrometry in the endocrinol-ogy laboratory. J Chromatogr B Anal Technol Biomed Life Sci 2012;883–884:50–8.
3. Hunter WM, Budd PS. Circulating antibodies to ovine and bovine immunoglobin in healthy subjects: a hazard for immunoassays. Lancet 1980;316:1136.
4. Al-Dujaili EA, Edwards CR. Development and application of a simple radioimmunoassay for urinary aldosterone. Clin Chim Acta 1981;116:277–87.
5. Cavalier E, Lukas P, Bekaert A-C, Peeters S, Le Goff C, Yayo E, et al. Analytical and clinical evaluation of the new Fujirebio Lumipulse® G non-competitive assay for 25(OH)-Vitamin D and
three immunoassays for 25(OH)D in healthy subjects, osteo-porotic patients, third trimester pregnant women, healthy African subjects, hemodialyzed and intensive care patients. Clin Chem Lab Med 2016;54:1347–55.
6. Cavalier E, Rousselle O, Ferrante N, Carlisi A, Le Goff C, Souberbielle J-C. Technical and clinical evaluation of the VIT-ROS® immunodiagnostic products 25-OH vitamin D total assay
– comparison with marketed automated immunoassays and a liquid chromatography tandem mass spectrometry method. Clin Chem Lab Med 2013;51:1983–9.
7. Dorrian CA, Toole BJ, Alvarez-Madrazo S, Kelly A, Connell JM, Wallace AM. A screening procedure for primary aldosteronism based on the Diasorin Laision automated chemilumuniscent immunoassay for direct renin. Ann Clin Biochem 2010;47:195–9. 8. Horton R, Hawks D, Lobo R. 3a, 17f-androstanediol glucuronide
in plasma. A marker of androgen action in idiopathic hirsutism. J Clin Invest 1982;69:1203–6.
9. Wu AH, French D. Implementation of liquid chromatography/ mass spectrometry into the clinical laboratory. Clin Chim Acta 2013;420:4–10.
10. Meunier C, Blondelle D, Faure P, Baguet J-P, Le Goff C, Chabre O, et al. Development and validation of a method using supported liquid extraction for aldosterone determination in human plasma by LC-MS/MS. Clin Chim Acta 2015;447:8–15.
11. Le Goff CM, Gonzalez-Antuña A, Peeters SD, Fabregat-Cabello N, Van Der Gugten JG, Vroonen L, et al. Migration from RIA to LC-MS/MS for aldosterone determination: Implications for clini-cal practice and determination of plasma and urine reference
range intervals in a cohort of healthy Belgian subjects. Clin Mass Spectrom 2018;9:7–17.
12. Perich C, Minchinela J, Ricós C, Fernández-Calle P, Alvarez V, Doménech MV, et al. Biological variation database: structure and criteria used for generation and update. Clin Chem Lab Med 2015;53:299–305.
13. Fraser CG, Petersen PH. Analytical performance characteristics should be judged against objective quality specifications. Clin Chem 1999;45:321–3.
14. Kushnir MM, Rockwood AL, Bergquist J, Varshavsky M, Roberts WL, Yue B, et al. High-sensitivity tandem mass spectrometry assay for serum estrone and estradiol. Am J Clin Pathol 2008;129:530–9.
15. Shiraishi S, Lee PW, Leung A, Goh VH, Swerdloff RS, Wang C. Simultaneous measurement of serum testosterone and dihydrotestosterone by liquid chromatography-tandem mass spectrometry. Clin Chem 2008;54:1855–63.
16. Lynch KL. CLSI C62-A: A new standard for clinical mass spectrometry. Clin Chem 2016;62:24–9.
17. Van den Ouweland JM, Kema IP. The role of liquid chromatography-tandem mass spectrometry in the clinical
laboratory. J Chromatogr B Anal Technol Biomed Life Sci 2012;883–884:18–32.
18. Matuszewski BK, Constanzer ML, Chavez-Eng CM. Strategies for the assessment of matrix effect in quantitative bioanalytical methods based on HPLC-MS/MS. Anal Chem 2003;75:3019–30. 19. Keevil BG. LC–MS/MS analysis of steroids in the clinical
laboratory. Clin Biochem 2016;49:989–97.
20. Vogeser M. Pitfalls associated with the use of liquid chromatog-raphy-tandem mass spectrometry in the clinical laboratory. Clin Chem 2008;54:1406–8.
21. Carvalho VM, Nakamura OH, Vieira JG. Simultaneous quan-titation of seven endogenous C-21 adrenal steroids by liquid chromatography tandem mass spectrometry in human serum. J Chromatogr B Anal Technol Biomed Life Sci 2008;872:154–61. 22. Solberg HE. The IFCC recommendation on estimation of
reference intervals. The RefVal program. Clin Chem Lab Med 2004;42:710–4.
Supplementary Material: The online version of this article offers