Bond Durability of Basalt Fibre-Reinforced Polymers
(BFRP) bars under freeze-and-thaw conditions
Mémoire
Mohamed Amine Ammar
Maîtrise en génie civil
Maître ès sciences (M.SC)
Québec, Canada
iii
Résumé
Ce mémoire présente les résultats de l’étude de l’adhérence entre les barres en polymères renforcés de fibres de Basalte (PRFB) et le béton. Cinquante-quatre cylindres renforcés par des barres en PRFB et dix-huit cylindres renforcés par des barres en polymères renforcés de fibres de fibres de Verre (PRFV) ont été testés par le test d’arrachement. Les paramètres des tests incluent le type de la barre utilisée, le diamètre de la barre, la longueur d’ancrage et le nombre de cycles de gel-dégel (100 et 200 cycles). Les courbes adhérence-glissement des barres en PRFB et PRFV révèlent la même tendance. Les influences des différents paramètres sur l’adhérence ont été analysées. Les modèles analytiques BPE, BPE-modifié et CMR ont été calibrés pour décrire la relation adhérence-glissement des barres en PRFB. Les résultats montrent la capacité des barres en PRFB à remplacer les barres en PRFV dans le renforcement des structures.
v
Abstract
This thesis presents the test results of a study on the bond behavior of basalt fiber-reinforced polymers (BFRP) bars in concrete. Forty-five cylinders fiber-reinforced with BFRP bars and eighteen cylinders reinforced with glass fiber-reinforced polymer (GFRP) bars were tested in direct pullout conditions. Test parameters included the FRP material, the bar diameter, the bar’s embedment length in concrete and the number of freeze-and-thaw cycles (100 and 200 cycles). Bond-slip curves of BFRP and GFRP bars revealed similar trend. All BFRP specimens failed in a pullout mode at the bar-epoxy interface. The influence of various parameters on the overall bond performance of BFRP bars is analyzed. The BPE, modified-BPE, and CMR analytical models were calibrated to describe the bond-slip relationships of BFRP bars. Results demonstrate the promise of using BFRP bars as an alternative to GFRP bars in reinforcing concrete elements.
vii
Table of contents
Résumé ... iii
Abstract ... v
Table of contents ... vii
List of tables ... xi
List of figures ... xiii
Acknowledgments ... xvii
Chapter 1: Introduction ... 1
1.1 General ... 1
1.2 Thesis organization ... 2
Chapter 2: Literature Review and Research Objectives ... 3
2.1 Composite materials ... 3
2.1.1 Fibre ... 3
2.1.2 Matrix ... 4
2.1.3 FRP Bars ... 5
2.2 Basalt Fibres ... 5
2.3 Bond between FRP bars and concrete ... 7
2.3.1 Surface Treatment ... 7
2.3.2 Bar diameter and embedment length ... 10
2.3.3 Bond Durability ... 10
2.3.3.1 Freeze-and-Thaw cycles ... 11
2.3.3.2 Low temperatures ... 12
2.3.3.3 High temperatures ... 12
viii
2.4.1 Malvar model (1994) ... 14
2.4.2 Eligehausen, Popov & Bertero model (BPE Model, 1983) ... 14
2.4.3 Modified BPE model (mBPE, 1996)... 15
2.4.4 CMR Model (1995) ... 16
2.5 Conclusions based on previous research ... 17
2.6 Research objectives ... 17
Chapter 3: Experimental Program ... 19
3.1 Introduction ... 19
3.2 Materials ... 19
3.2.1 Concrete ... 19
3.2.2 FRP Bars ... 21
3.2.3 Test Specimens ... 21
3.3 Bond Test Program ... 23
3.4 Test setup ... 25
3.4.1 Specimen seating and anchoring ... 25
3.4.2 Specimen instrumentation ... 27
3.4.3 Specimen testing ... 28
Chapter 4: Results and Discussions ... 29
4.1 Phase I results: Bond behavior of unconditioned specimens ... 29
4.1.1 Bond-slip relationships ... 29
4.1.2 Residual Bond Strength ... 42
4.1.3 Bond failure mode ... 45
4.1.4 Factors Affecting Bond Behavior of FRP bars ... 49
4.1.4.1 Embedment length ... 49
ix
4.1.4.3 Bar diameter ... 53
4.1.4.4 Surface treatment ... 55
4.2 Phase II: Effect of Freeze and Thaw ... 56
4.2.1 Effect of freeze-and-thaw on bond-slip response ... 59
4.2.2 Effect of FT cycles on maximum bond stress ... 65
4.2.3 Effect of FT cycles on bar adhesion to concrete ... 71
4.2.4 Effect of FT cycles on residual bond stress ... 73
4.2.5 Effect of FT cycles on the failure mode ... 76
Chapter 5: Analytical Models ... 79
5.1 Analysis of unconditioned specimens ... 80
5.2 Analysis of conditioned specimens ... 84
Chapter 6: Conclusions and recommendations for future work ... 93
6.1 Introduction ... 93
6.2 Summary of the test results of phase I: unconditioned specimens ... 93
6.3 Summary of the test results of phase II: conditioned specimens ... 94
6.4 Summary of the analytical phase ... 96
6.5 Recommendations for future work ... 96
xi
List of tables
Table 1: Typical properties of fibres ... 4
Table 2: Properties of thermosetting resins (ISIS Design Manual 2007) ... 4
Table 3: Mechanical properties of FRP bars (Adhikari 2009) ... 5
Table 4: Properties of BFRP bars ... 6
Table 5: Composition and characteristics of concrete mix ... 20
Table 6: FRP bars design properties ... 21
Table 7: Specimens’ designation and test parameters of phase I ... 24
Table 8: Specimens’ designation and test parameters of phase II ... 25
Table 9: Results of unconditioned pullout bond specimens ... 30
Table 10: Results of unconditioned and conditioned specimens ... 56
Table 11: Compressive strength of concrete after freeze-and-thaw ... 66
Table 12: Stress at the onset of slip at the loaded end for BFRP and GFRP specimens ... 72
Table 13: Mean values and coefficient of variation of the models’ parameters for unconditioned BFRP and GFRP specimens ... 81
Table 14: Mean values and coefficient of variation of the models’ parameters for BFRP specimens exposed to 100 FT cycles ... 84
Table 15: Mean values and coefficient of variation of the models’ parameters for BFRP specimens exposed to 200 FT cycles ... 84
xiii
List of figures
Figure 1: Fiber Reinforced Polymer (Nacer 2006) ... 3
Figure 2: Different FRP bars surfaces used in Cosenza et al. (1997) ... 8
Figure 3: Different types of FRP bars used in Davalos et al. (2008) ... 9
Figure 4: Surface deformations of FRP bars used in Baena et al. (2009) ... 10
Figure 5: Cracks in concrete cylinders after freeze-and-thaw cycles used in Wardeh et al. 2011 ... 11
Figure 6: Variation of compressive strength with FT cycles (Wardeh et al. 2011) ... 11
Figure 7: BPE model (Eligehausen et al. 1983) ... 15
Figure 8: mBPE model (Cosenza et al. 1996) ... 16
Figure 9: (a) Concrete mixing in the Concrete Laboratory at LU and (b) Slump test ... 20
Figure 10: Surface deformations of (a) BFRP and (b) GFRP bars ... 21
Figure 11: Centering the bars in the specimen moulds using (a) cylindrical moulds, (b) wooden forms and (c) plastic covers ... 22
Figure 12: BFRP bar with PVC tubes dictating the embedment length of the bar ... 23
Figure 13: Pullout test set up ... 26
Figure 14: Wooden base supported on steel channels ... 26
Figure 15: Hinge system to minimize the effect of surface irregularities ... 27
Figure 16: Steel pipe used to anchor the FRP bar ... 27
Figure 17: Plastic washers to ensure centricity of the bar ... 27
Figure 18: LVDTs fixed at the (a) unloaded ends and (b) loaded ends ... 28
Figure 19: Typical bond-slip curves for BFRP bars at unloaded ends: (a) ld = 5d, (b) ld = 7d, (c) ld = 10d, and (d) ld = 15d ... 34
Figure 20: Typical bond-slip curves for BFRP bars at loaded ends: (a) ld = 5d, (b) ld = 7d, (c) ld = 10d, and (d) ld = 15d ... 36
Figure 21: Comparison between bond-slip curves for BFRP and GFRP bars at unloaded ends (a) ld = 5d and (b) ld = 7d, (c) ld = 10d, and (d) ld = 15d... 38
xiv
Figure 22: Ratio of the bond stress to the ultimate strength at slip onset at loaded end ... 39
Figure 23: Ratio of bond stress to ultimate stress at onset of slip at (a) loaded ends and (b) unloaded ends ... 41
Figure 24: Ratio of average residual to maximum bond stress for BFRP and GFRP bars at (a) unloaded ends and (b) loaded ends ... 44
Figure 25: Typical modes of failure (a) pullout of the bar (specimen B10-100-2), (b) bar rupture (specimen G10-100-2), and (c) concrete splitting (specimen G10-70-2) ... 45
Figure 26: Pullout mode of failure of (a) BFRP specimen B8-120-2, (b) BFRP specimen B8-56-2, and (c) GFRP specimen G10-70-3 ... 47
Figure 27: Bond strength versus embedment length for (a), (b), (c) BFRP bars and (d) GFRP bars ... 51
Figure 28: Average bond strength versus embedment length for (a) BFRP bars and (b) BFRP and GFRP bars of diameter 10 mm ... 52
Figure 29: Influence of the bar diameter on the average bond strength of BFRP bars ... 54
Figure 30: Typical Bond-Slip curves for (a), (b) and (c) BFRP and (d) GFRP at unloaded ends ... 62
Figure 31: Typical Bond-Slip curves for (a), (b) and (c) BFRP and (d) GFRP at loaded ends ... 64
Figure 32: Average bond stress for unconditioned and conditioned specimens ... 66
Figure 33: Normalized bond strength for unconditioned and conditioned specimens ... 67
Figure 34: Slip at unloaded ends for unconditioned and conditioned specimens ... 70
Figure 35: Slip at loaded ends for unconditioned and conditioned specimens ... 71
Figure 36: Ratio of adhesion to ultimate stress for BFRP and GFRP specimens ... 72
Figure 37: Average residual bond strength of unconditioned and conditioned BFRP and GFRP bars at the unloaded ends ... 74
Figure 38: Average residual bond strength of unconditioned and conditioned BFRP and GFRP bars at the loaded ends ... 74
Figure 39: Failure of concrete at the end of bond test for specimen B12-84-100-2 ... 76
xv Figure 41: Experimental versus analytical results using the BPE and mBPE models for both BFRP and GFRP bars with (a) ld = 5d, (b) ld = 10d ... 82
Figure 42: Experimental versus analytical results using the CMR model for unconditioned (a) BFRP and (b) GFRP bars ... 83 Figure 43: Average values of “α” for unconditioned and conditioned BFRP and GFRP
specimens ... 85 Figure 44: Average values of “p” for unconditioned and conditioned BFRP and GFRP
specimens ... 86 Figure 45: Average values of “sr” for unconditioned and conditioned BFRP and GFRP
specimens ... 87 Figure 46: Experimental versus analytical results using the BPE model for (a) B12-84-100-2 and (b) G10-70-100-B12-84-100-2 specimens ... 88 Figure 47: Experimental versus analytical results using the BPE model for (a) B12-84-200-1 and (b) GB12-84-200-10-70-200-B12-84-200-1 specimens ... 89 Figure 48: Experimental versus analytical results using the CMR model for (a) B12-70-100-1 and (b) G10-70-100-2 specimens ... 90 Figure 49: Experimental versus analytical results using the CMR model for (a) B12-84-2001- and (b) G10-70-200-1 specimens ... 91
xvii
Acknowledgments
I would like to express my sincere thanks and gratitude to my parents, my wife and to my family who encouraged and supported me during the completion of this work. I doubt that I will ever be able to convey my full appreciation, but I owe them my endless gratitude. I would also like to express my appreciation and gratitude to my supervisors, Professors Ahmed El Refai and Radhouane Masmoudi from Civil Engineering at Laval and Sherbrooke University, respectively, for their guidance during the research program. They provided me with guidance, technical support, and encouragement. It was their persistence, understanding, and kindness that encouraged me to complete this work.
I would also like to acknowledge and thank Mathieu Thomassin, from the Civil Engineering Laboratories at Laval University, for his assistance during the experimental phase of this program. I would also like to thank Nicolas Rouleau and all the technicians from the Civil Engineering Laboratories. Their assistance during the experimental phase of this program is greatly appreciated.
I would also like to thank all my colleagues in the Civil Engineering Research Group for their support and valuable discussions. I would also like to express my gratitude to the Research Center on Concrete Infrastructure (CRIB) for their financial support.
xix
1
Chapter 1: Introduction
1.1 General
Deterioration of reinforced concrete (RC) structures due to corrosion of reinforcing steel bars is a major concern. The use of de-icing materials and the dominance of aggressive environment are in the origin of the corrosion problem. According to Boyle and Karbhari (1994), the cost of replacing a deteriorated bridge deck has been estimated to be twice the original construction cost. The ministry of transport of Québec spends half of the maintenance budget on repairing corrosion-damaged RC structures (El-Salakawi et al. 2003).
Fiber-reinforced polymers (FRP) bars, with their anti-corrosive properties, have been used as a viable alternative to steel bars in reinforcing concrete structures. In fact, several experimental studies in addition to several field applications such as marine structures, concrete bridge decks, and concrete pavements, have supported the suitability of the FRP bars for structural use (Aiello et al. 2007; Achillides and Pilakoutas 2004; Baena et al. 2009; Sayed et al. 2011; Tastani et al. 2006; Bilal et al. 2004).
Basalt fibres, which have been an essential component in the automotive and sport industries for decades, have been recently used in developing a new FRP composite, referred to as basalt fiber-reinforced polymers (BFRP). Recently, BFRP bars have emerged as a promising alternative to conventional glass FRP (GFRP) bars in reinforcing concrete structures. Preliminary tests conducted have demonstrated the promise of using BFRP bars in reinforcing concrete structures. However, the wide acceptance of their usage necessitates comprehensive investigation of their structural and mechanical performance to ensure their suitability for civil-engineering applications. One of the fundamental aspects of structural behavior of RC members is the bond development between the bar and surrounding concrete. Bond characteristics of the reinforcing bars govern the serviceability, ductility, and capacity of concrete structures. There have been few investigations on the bond behavior of BFRP bars to concrete due to their recent existence in the construction field. Therefore, the present research study is initiated to investigate such behavior. The study
2
reports on the bond durability of the BFRP bars under freeze-and-thaw conditions that characterize the climate in Canada in general and in Quebec in particular. The work consists of both experimental and analytical phases. The experimental phase is conducted on seventy-two pullout specimens reinforced with BFRP and GFRP bars. The analytical phase focused on studying the applicability of the available bond-slip models, initially developed for conventional FRP bars, to describe the bond behavior of the BFRP ones.
1.2 Thesis organization
The present research work investigates, both experimentally and analytically, the bond performance of BFRP bars to concrete. A literature review on the bond performance of traditional FRP bars in concrete is presented in Chapter 2. The parameters that influence the bond behavior are discussed. The effects of various environmental conditions on the bond performance of FRP bars to concrete are reported. The chapter concludes with the research needs and the main objectives of the current work.
Chapter 3 describes the experimental program followed to achieve the research goals. The material properties and the specimen geometry and fabrication in addition to the test methodology are reported. A full description of the test setup, instrumentation, and loading procedures are also presented.
In chapter 4, the main results and observations of the pullout tests are discussed. The bond performance of the bars is described in terms of the measured bond strength and the measured slip in the BFRP bars.
Chapter 5 includes the analytical phase of this research study in which available bond-slip models are assessed for their suitability to describe the bond performance of BFRP bars.
Finally, Chapter 6 summarizes the current study and provides conclusions and recommendations for future work.
3
Chapter 2: Literature Review and Research Objectives
In this chapter, a review of the experimental and analytical work that has been done on the bond behavior of FRP bars in concrete is provided. Since BFRP bars are recently introduced in the construction field, the literature review is based on research studies that have been conducted on other types of FRP bars.
2.1 Composite materials
A composite is defined as the assembly of two or more distinct materials to achieve new material whose overall performance is higher than the individual ingredients (ISIS Design Manual 2007). The benefits of using composites are: light weight, high tensile strength, and durability if compared to traditional steel reinforcing rebars (Nacer 2006).
Fiber reinforced polymers (FRP) are composites that consist of two components as shown in Figure 1: the fibres, which are the load carrying elements, and the matrix, which ensures the cohesion of the fibres, the retransmission of applied loads to the fibres, and the protection of fibres from the external environment.
Figure 1: Fiber Reinforced Polymer (Nacer 2006)
2.1.1 Fibre
Aramid, Carbon, and Glass are the most common types of fibres used in civil engineering applications. Table 1 shows typical values of the physical and mechanical
4
properties of these fibres. Aramid fibres are characterized by their good fatigue resistance. However, they are susceptible to damage by ultraviolet radiation. Carbon fibres are known by their high longitudinal tensile strength, their high modulus of elasticity, and their excellent fatigue resistance. On the other hand, two types of glass fibres are commonly used in construction: E-glass and S-glass, with the later having a higher tensile strength. Glass fibres are characterized by their low modulus of elasticity and their low transverse shear resistance.
Table 1: Typical properties of fibres
E-Glass S-Glass Carbon Aramid Tensile strength (MPa) 3100~3800 4020~4650 3500~6000 2900~3400
Elastic Modulus (GPa) 72.5~75.5 83~86 79.3~93.4 70~140
Elongation at break (%) 4.7 5.3 1.5~2 2.8~3.6
Diameter of filament (mµ) 6~21 6~21 5~15 -
Temperature of application (°C) -50~+380 -50~+300 -50~+700 -50~+290
(Source: Basalt fiber & composite materials technology development CO. LTD; www.basaltfm.com)
2.1.2 Matrix
Matrix, or resin, is the bonding agent of FRP composites. There are essentially two types of resins: thermoplastic and thermosetting polymers. The choice of resins during the manufacturing process is crucial because it affects the mechanical properties of composites. Thermoplastic polymers are not used in civil engineering purposes because of their low thermal and creep resistances. However, thermosetting resins, such as epoxies, polyesters and vinyl esters, which are the most used resins, have “good thermal stability and chemical resistance and undergo low creep and stress relaxation” as stated by ISIS Design Manual 2007 and shown in Table 2.
Table 2: Properties of thermosetting resins (ISIS Design Manual 2007)
Resin Specific Gravity Tensile Strength (MPa) Tensile Modulus (GPa) Cure Shrinkage (%) Epoxy 1.2-1.3 55-130 2.75-4.1 1-5 Polyster 1.1-1.4 34.5-103.5 2.1-3.45 5-12
5
Vinyl Ester 1.12-1.32 73-81 3-3.35 5.4-10.3
2.1.3 FRP Bars
Glass FRP (GFRP), Carbon FRP (CFRP) and Aramid FRP (AFRP) bars have been widely used in construction in the last few decades. Table 3 lists the most commercially available FRP bars and their mechanical properties.
Table 3: Mechanical properties of FRP bars (Adhikari 2009)
Trade
Name Tensile Strength (MPa) Modulus of Elasticity (GPa) Ultimate Tensile Strain
Carbon fiber V-rod 1596 120 0.013 Aslan 2068 124 0.017 Leadline 2250 147 0.015 Nefmac 1200 100 0.012 Glass fiber V-rod 710 46.4 0.015 Aslan 690 40.8 0.017 Nefmac 600 30 0.020
Coefficient of Thermal Expansion (x 10-6 /°C)
Direction Steel GFRP CFRP AFRP
Longitudinal 11.7 6 to 10 -1 to 0 -6 to -2
Transverse 11.7 21 to 23 22 to 23 60 to 80
2.2 Basalt Fibres
Unlike conventional glass, carbon, and aramid fibres, basalt fibres are recently introduced in the construction field. Basalt fibres are “green” fibres that are processed from basalt rocks through a melting process similar to that used for glass fibres but with low energy requirement (i.e., low cost and little impact on the environment). Basalt fibres have a high strength-to-weight ratio and high modulus of elasticity if compared to E-glass fibres (Sim et al. 2005; Ramakrishman et al. 2005). They are environmentally safe, non-corrosive, and have excellent fatigue resistance (Wu et al. 2010) and good sound and magnetic insulation properties (Palmieri et al. 2009). They also have an excellent resistance to high temperature and high moisture conditions (Militky et al. 2002), which make them suitable
6
for usage in harsh environments (Palmieri et al. 2009). They maintain their volumetric integrity and 90% of their strength if exposed to temperatures over 600°C. Basalt fibres do not produce toxic substances when subjected to fire, overcoming a serious drawback of conventional fibres (Sim et al. 2005). The fibres also have an outstanding chemical stability (Wei et al. 2010; 2011) and high resistance to alkalinity in the surrounding concrete, thus surmounting a commonly known shortcoming of glass fibres when embedded in concrete (Palmieri et al. 2009; Sim et al. 2005).
Basalt fibres are mainly produced in China, Ukraine, and Russia with a large chain of distributors around the world. They are used in manufacturing the basalt fibre-reinforced polymers (BFRP) bars. Due to their recent use in construction and the lack of research studies conducted on BFRP bars, the bars were used in only a few projects as replacement of steel bars. For instance, BFRP bars made by Galen Modern Composites Company of Russia, commercially known as Rockbars, were used to reinforce a 22-meter-long concrete-deck section of Thompson’s bridge in Northern Ireland (Engineering News-Record, 2010). Rockbars were also used in reinforcing the Fountain Park in Warsaw, Poland, and part of the transnational highway Europe-Western China. Other types of BFRP bars made by Technobasalt (of Ukraine), commercially known as the Basalt Composite Rebars (BCR), were implemented in other projects around the world especially in bridge construction. Table 4 shows the mechanical properties of the BFRP bars as defined by their manufacturers. It is worth mentioning that the application of BFRP bars in practice was based on a few research studies (Brik 1997; Ramakrishnan and Neeraj 1998; Brik 2003; Parnas et al. 2007; Adhikari 2009) in addition to the characterization tests usually conducted by manufacturers. In fact, most of previous studies that have been conducted on BFRP bars were preliminary in nature, in which several parameters that are known to affect the structural performance of the bars in concrete were not thoroughly investigated.
Table 4: Properties of BFRP bars
Trade
Name Strength (MPa) Tensile Elasticity (GPa) Modulus of Elongation (%) Coefficient of Thermal Expansion (x 10-6 /°C)
Rockbar 1000 50 2.24 2.0
BCR 1100 70 2.20 0.35-0.592
7
2.3 Bond between FRP bars and concrete
As far as the structural performance of RC members is concerned, bond between FRP reinforcement and concrete is the most significant aspect that controls the structure’s capacity, ductility, and serviceability. In this aspect, bond of GFRP and CFRP bars to concrete has been widely investigated, which resulted in a significant amount of experimental data on their bond performance (ACI 2006; Aiello et al. 2007; Harajli et al. 2010; Alvarez 2004; Tastani et al. 2006). It was established that parameters such as concrete strength, bar diameter, embedment length, and concrete confinement significantly affect the bond performance of FRP bars to concrete (Davalos et al. 2008; Aiello et al. 2007; Achillidis and Pilakoutas 2004; Bilal et al. 2004). Bond development is strongly dependent on the mechanical and physical properties of the surface of the FRP bar and the constituents of the FRP material. It varies widely between different FRP bars due to the unique properties of each bar. In the following sections, the parameters influencing the bond performance of FRP bars to concrete are highlighted.
2.3.1 Surface Treatment
Nowadays, many types of FRP bars having different surface treatments and characteristics are available. The FRP bar surface may vary between deformations (ribbed, braided, or indented), or sand coating, or a combination of both. Cosenza et al. (1997) tested GFRP bars with various surface deformations (Figure 2) to compare their bond performance to concrete. The bond strength for the ribbed and indented FRP bars was found to be 11.6 MPa and 10.2 MPa, respectively. These values of bond strength were comparable to those obtained for deformed steel bars (11.9 MPa) but were much lower than the bond strength of sand-coated bars (17.7 MPa). The authors concluded that sand grains glued to the bar surface enhanced its bond strength and that the surface deformation play an important role in developing bond between concrete and the bar’s interface.
8
Figure 2: Different FRP bars surfaces used in Cosenza et al. (1997)
Chaallal et al. (1993) compared the bond strength of wrapped sand-coated GFRP and steel bars embedded in 150 x 300 mm concrete cylinders. The authors reported that bond strength of GFRP varied between 11.1 MPa and 15.1 MPa representing 62% to 84% of the bond strength of deformed steel bars.
In order to evaluate the bond performance of GFRP in tension, Harajli et al. (2010) used thread wrapped and ribbed bars embedded vertically in concrete cylinders of 150 x 300 mm with an embedded length of 7 d, where d is the bar diameter. The results showed that ribbed bars developed larger average bond strength at failure than the thread wrapped bars. The authors concluded that surface deformations of FRP bars significantly affect their bond strength to concrete and their mode of failure at ultimate limit stat. Similar conclusions were reported by Aiello et al. (2007) who studied the bond performance of various types of FRP bars in pullout tests. A total of 24 prismatic concrete cubes (250 mm) reinforced with AFRP, CFRP and GFRP bars were tested. Ribbed, fine-sanded, coarse-sanded, and bars with spirals wound with fibres were used in addition to traditional smooth and ribbed steel bars. Results showed that the maximum bond stress of CFRPsw (spiral wound) was four times larger than that of both fine and coarse sanded CFRP bars.
Davalos et al. (2008) tested 12 cylinders (150 x 150 mm) to investigate the effect of FRP bar degradation on the interfacial bond to high strength concrete (60 MPa). Different types of GFRP bars (wrapped GFRP 1, slightly sand-coated GFRP 2, and sand-coated GFRP 3, and sandblasted CFRP) were used in the study (Figure 3). The bars were vertically
9 embedded in concrete for a length of 5 d. The results showed that the sand-coated GFRP3 bars exhibited the highest bond strength (23.42 MPa) compared to the wrapped GFRP1 (19.61 MPa) and the slightly sanded GFRP2 bars (21.38 MPa). CFRP bars exhibited an average bond strength of 22.26 MPa. The authors reported that the surface characteristics of FRP bars not only affect their bond strength to concrete but also affects the post-peak bond stress attained.
Figure 3: Different types of FRP bars used in Davalos et al. (2008)
Achillides and Pilakoutas (2004) tested concrete cubes (150 mm) reinforced with four FRP bars (Glass, Carbon, Aramid, and Hybrid) in direct pullout conditions to investigate the effect of the bar surface on the bond behavior to concrete. Rough and smooth bars were used in the tests. Results showed that smooth bars developed only 10–20% of the bond stress of deformed bars and that GFRP and the CFRP bars exhibited similar bond strength (12 MPa and 11.9 MPa respectively).
Baena et al. (2009) investigated the effect of six different surface treatments on bond between FRP bars and concrete (Figure 4). The bar specimens included sand-coated GFRP and CFRP bars, textured surface CFRP bars, GFRP bars with and without helical wrapping surface and sand-coating, GFRP bars with grooved surface, and steel bars. A total of 88 concrete cubes of 200 mm with 5 dembedment length were tested. The authors concluded that the sand-coated bars had better chemical bond than other bars, which confirmed the influence of the bar surface treatment on its bond to concrete.
10
Figure 4: Surface deformations of FRP bars used in Baena et al. (2009)
2.3.2 Bar diameter and embedment length
Many research studies have reported that bond strength of FRP bars is inversely proportional to the bar diameter (Achillidis and Pilakoutas 2004; Baena et al. 2009; Al-Mahmoud et al. 2007; Cosenza et al. 1995). Sayed et al. (2011) tested 60 pullout specimens to evaluate the effect of the bar diameter on the bond of CFRP bars to ultra-high-performance fiber-reinforced concrete. Four diameters (8, 10 and 12 mm for smooth bars and 7.5 mm for sand-coated bars) were used with embedment lengths of (5, 10, 15 and 20 d). The authors concluded that specimens with shorter embedment length and smaller bar diameter developed the highest bond strength.
Alvarez (2004) reported similar conclusions from testing 72 concrete cylinders (150 x 300 mm) reinforced with four different sand-coated GFRP bars. Four diameters (9.5, 12.7, 15.9 and 19.1 mm) and three embedment lengths (5, 10 and 15d) were investigated under different applied temperatures (20°, 40°, and 60°C) for 4 months. It was concluded that bond strength decreased when the embedment length and the bar diameter increased.
2.3.3 Bond Durability
Bond development between FRP bars and concrete is affected by the exposure of the test specimens to various environmental conditions. In this section, a review on the effect of high and low temperatures and freeze-and-thaw (FT) cycles on the bond performance of FRP bars is presented.
11
2.3.3.1 Freeze-and-Thaw cycles
Wardeh et al. (2011) reported on the effect of FT cycles on concrete. Concrete cylinders (160 x 320 mm) are tested under different numbers of FT cycles (2 cycles/day between -20°C and 10°C). It was reported that the number of cracks recorded on the concrete surface significantly increased with the increasing number of cycles. The cracks became visible after 60 cycles. After 240 cycles, the concrete was severely deteriorated as can be seen in Figure 5. Concrete cylinders lost 20% and 60% of their compressive strength after 30 cycles and 240 cycles, respectively, as shown in Figure 6.
Figure 5: Cracks in concrete cylinders after freeze-and-thaw cycles used in Wardeh et al. 2011
12
Karbhari et al. (2000) exposed concrete cylinders reinforced with CFRP sheets to 200 FT cycles between -20°C and 22.5°C. Test results showed a more sudden rupture between the reinforcement and concrete as compared to the control specimens. However, no significant effect on the cylinder compressive strength was observed.
Alvarez (2004) exposed 50 cylinders (150 x 300 mm) to 100 and 200 FT cycles (2 cycles/day between -20°C and 20°C at 70% relative humidity) to evaluate the durability of bond of embedded FRP bars. The authors reported that FT cycles had no effect on the bond strength values except for the 19.1 mm bar diameter that showed a reduction of 15% after 200 cycles.
Davalos et al. (2008) exposed 12 cylinders (100 x 200 mm) to 30 FT cycles (1 cycle/day between -20° and 60°C) reinforced with GFRP and CFRP bars. The authors concluded that the free-end slip of the pullout test specimens increased and the bond strength reduced by about 18% after exposure.
2.3.3.2 Low temperatures
Limited research has been conducted on the effect of low temperature on the bond strength of FRP bars to concrete. Saiedi et al. (2011) tested five CFRP and two steel-prestressed concrete beams (300 x 500 x 4400 mm) under fatigue loading at -28°C. All specimens were monotonically loaded to failure after being cycled. The results showed that low temperature caused an initial slip between the bars and concrete, which occurred at loads ranging between 70% and 90% of the ultimate capacity of the beams. The authors concluded that the initial slip caused by low temperature could initiate a serious bond failure in similar structures subjected to long periods of low temperature.
2.3.3.3 High temperatures
Galati et al. (2006) conducted 36 pullout tests on concrete cubes reinforced with GFRP bars. The specimens were tested at an elevated temperature of 70°C to investigate the thermal effects on bond between the bars and concrete. The authors concluded that high temperature decreased the ultimate tensile load with up to 16% of that of the control
13 specimens. This was attributed to the weakness of the FRP matrix (resin-fiber interface) due to high temperature, which has caused the bond failure.
Abdallah (2006) investigated the bond of FRP bars embedded in concrete prisms of 50 x 76 x 750 mm. The tests also included 42 pullout specimens. Isorod and C-bar (GFRP), Leadline and CFCC (CFRP), and steel bars were used in the study. The specimens were preheated at 20°, 50° and 100°C before being tested. The results showed that bond strength of the bars decreased with the increasing temperature up to 100°C. The authors concluded that the difference in transverse thermal expansion between GFRP and concrete increased the micro-cracking in concrete and weakened the adhesion between FRP bars and concrete, which resulted in a reduction in the bond strength achieved. Similar conclusion was reported by Davalos et al. (2008) who confirmed that concrete specimens maintained at 60°C for 90 days had bond strength reduction as compared to control specimens.
Katz et al. (1999) reported that, at high temperature, FRP bars lose their mechanical properties and their bond strength to concrete. Experimental results showed a reduction in the bond strength of FRP bar between 20% and 40% at 100°C, 75% at 150°C, and 90% at 220°C.
Alvarez (2004) tested 72 cylinders (150 x 300 mm) after being exposed to 40°C and 60°C for 4 months. Four diameters (9.5, 12.7, 15.9, and 19.1 mm) of GFRP bars and three embedment lengths (5, 10 and 15d) were used. The results showed a reduction in the bond strength by 18% and 20% after being exposed to 40°C and 60°C, respectively, for specimens with 15.9 mm bar diameter and embedment length of 5d. This reduction in strength increased to 26% at 60°C for the 19.1 mm diameter specimens.
2.4 Bond analytical models
In order to predict a bond-slip relationship and determine the structural performance of FRP-reinforced concrete structures, an analytical model that describes the bond behavior of FRP bars is needed. However, given the large number of parameters that affect the bond of FRP bars to concrete, no unique model has been proposed up till now. A few available
14
formulations for FRP bars still have to be validated by experimental tests. In the following, a review of the most recognized models is reported.
2.4.1 Malvar model (1994)
The bond-slip ( -s) relationship of GFRP bars was first reported by Malvar (1994) based on an extensive experimental research using GFRP bars with different surface treatments. This model is presented by the following relationship:
( ⁄ ) ( ) ( ⁄ )
( ) ( ⁄ ) ( ⁄ ) (Equation 1)
where τm and sm are the peak bond stress and the corresponding slip; F and G are empirical
constants that are determined for each bar type by curve-fitting of the experimental τ-s curves.
2.4.2 Eligehausen, Popov & Bertero model (BPE Model, 1983)
The BPE model was proposed by Eligehausen et al. (1983) for deformed steel rods and has been successfully applied to FRP bars (Cosenza et al. 1995; Alunno et al. 1995; Faoro 1992). It describes the ascending branch of the bond-slip (s < sm) relationship as shown in
Figure 7 and as described by the following equation:
(
)
(Equation 2)where τ1 = τm = maximum bond stress and s1 = sm = slip at maximum stress.
For FRP bars, α is a curve fitting parameter not larger than 1 to be physically meaningful (α = 0.4 for steel bars).
15 Figure 7: BPE model (Eligehausen et al. 1983)
As shown in Figure 7, the BPE model presents a second branch with constant bond τ = τm up to a slip s = s2, a linearly descending branch from (s2, τ1) to (s3, τ3), and a horizontal
branch for s > s3 at a value of τ = τ3 due to the friction development between the bar and
concrete. Values of s2, s3 and τ3 are to be calibrated from the experimental results.
It can be noticed that the BPE model offers an initial slope for the ascending curve equal to infinity to accurately model the adhesion between FRP bars and concrete.
2.4.3 Modified BPE model (mBPE, 1996)
Comparing the experimental and analytical results obtained by applying the BPE model, Cosenza et al. (1996) noted a disagreement in the descending branch and proposed the modified BPE (mBPE) model shown in Figure 8.
16
Figure 8: mBPE model (Cosenza et al. 1996)
The modified model presents the same ascending branch of the BPE model and a softening branch having a slope p from (s1,τ1) to (s3,τ3) given as follows:
(
)
(Equation 3)2.4.4 CMR Model (1995)
Cosenza et al. (1995) proposed the following relationship for the ascending branch of the bond-slip curve as an alternative to the BPE model:
(
⁄)
(Equation 4)
where sr and β are parameters based on curve fitting of the experimental data.
Similar to BPE model, the CMR model presents adhesion between FRP bars and concrete by providing an initial slope for the ascending curve equal to infinity.
Various studies have investigated the suitability of these models to describe the bond behavior of FRP bars to concrete. It has been reported that the CMR and the BPE model can provide satisfactory correlation while the Malvar model underestimates the initial stiffness compared to the experimental values (Alvarez 2004; Adhikari 2009).
17
2.5 Conclusions based on previous research
A literature review on the bond behavior of FRP bars to concrete was carried out. From the presented literature, the following points may be concluded:
Most of previous bond studies have been conducted on GFRP and CFRP bars as these bars have been widely commercialized in the last few decades. However, a lack of information on the bond performance of BFRP bars is noticed due to their recent use in the construction field.
Many studies were carried out to investigate the effect of various parameters on bond of FRP bars to concrete. Surface deformations, embedment length, and bar diameter are among the most commonly investigated parameters that influence the bond behaviour. There is lack of experimental data on the bond performance of GFRP and CFRP bars in
cold regions, which requires more investigation, not to mention the lack of knowledge on the performance of BFRP bars in such conditions. In this aspect, little information on the effect of freeze-and-thaw cycles and low temperature on FRP bond is available. Reported results have confirmed that the difference in thermal expansion coefficient
between concrete and FRP bars affect the developed bond strength. Further investigation is required to investigate the bond performance of BFRP bars in cold regions.
Analytical models that describe the bond-slip relationships were successfully applied for GFRP and CFRP bars. None of these models has been validated for BFRP bars.
2.6 Research objectives
Based on the above conclusions, the main objective of the current study is to investigate the bond behavior of BFRP bars in concrete under the environmental conditions that dominate in Canada in general and in Quebec in particular. The detailed objectives of the current research study are initiated to develop our understanding in this area as follows: To investigate the bond behavior of BFRP bars as a new reinforcing material in
18
Assessment of the effect of the bar diameter and the embedment length on the bond performance of the bar;
Comparison between the bond performance of BFRP and GFRP bars that have similar surface treatment;
Assessment of the available analytical models and their applicability to describe the bond performance of BFRP bars to concrete.
To investigate the effect of freeze-and-thaw cycles on bond between BFRP bars and concrete. This includes:
Evaluation of the long-term effect of freeze-and-thaw cycles on the BFRP bond performance;
Assessment of the available analytical models and their applicability to describe the bond of BFRP bars after being exposed to freeze-and-thaw cycles.
19
Chapter 3: Experimental Program
3.1 Introduction
In this chapter, a description of the materials used (concrete and FRP bars) in the experimental program is presented. The test matrix, the fabrication process of the specimens, and the adopted test procedures are presented. The experimental program is divided into two phases:
Phase I: Includes pullout tests on concrete cylinders reinforced with BFRP and GFRP bars at room temperature. The objective of this phase is to study the bond behavior of BFRP bars as compared to GFRP bars. In this phase, bond-slip relationships of both types of bars are developed. Bond failure mode and mechanism and the effect of various parameters on the bond performance of the bars are detailed.
Phase II: Includes pullout tests on concrete cylinders reinforced with BFRP and GFRP bars after being exposed to freeze-and-thaw (FT) cycles. The main objective of this phase is to investigate the effect of FT cycles on the bond durability of the bars. Specimens in this group are exposed to 100 and 200 FT cycles. Bond-slip curves and failure modes are reported and compared to those of control specimens.
3.2 Materials
3.2.1 Concrete
Concrete mix of compressive strength 50 MPa was used to cast all pullout specimens. This relatively high strength concrete was selected to replicate practical mix design in Canada where freezing environment prevail most of the year. The use of high strength concrete also allows the full utilization of the high tensile capacity of FRP bars. Table 5 shows the constituents of the concrete mix in which locally produced constituents are used. The concrete mix had a maximum aggregate size of 14 mm and a water-cement ratio of 0.45. Admixture of type MasterBuild was used to increase the workability of concrete and
20
to minimize the amount of water cement ratio applied. Ordinary Portland cement was used in the concrete mix. A slump of 110 mm was obtained. All pullout specimens were prepared and cast in the Concrete Laboratory of Laval University (LU) (Figure 9). After being de-molded, specimens were labeled and stored into a curing room at a temperature of 20°C ± 2°C and a humidity of about 95% for 28 days.
(a) (b)
Figure 9: (a) Concrete mixing in the Concrete Laboratory at LU and (b) Slump test
Table 5: Composition and characteristics of concrete mix
Components Quantities Water (kg/m3) 211.3 Cement T10 (kg/m3) 473.7 Sable de la voirie (kg/m3) 911.9 Calcaire 2.5-10mm (kg/m3) 230.5 Calcaire 5-14mm (kg/m3) 381.4
Micro Air: Master (ml) 85.3
Superplasticizer: Master Build (ml) 94.7
Characteristics
Compressive Strength (MPa) 50
Slump (mm) 110
21
3.2.2 FRP Bars
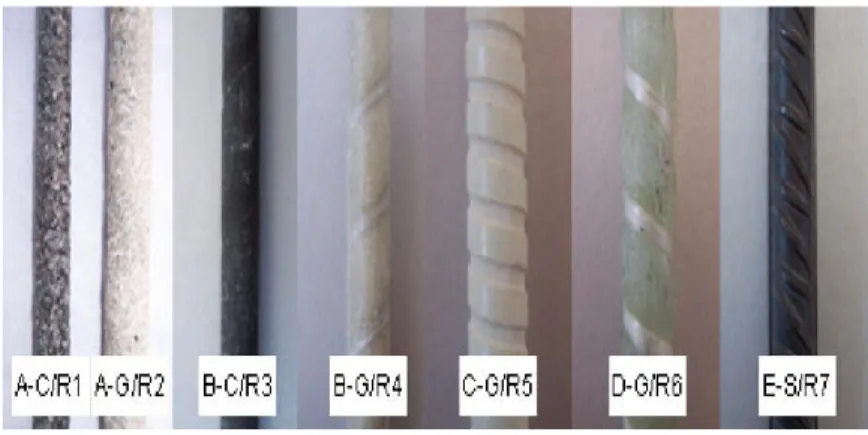
BFRP and GFRP bars were used in this study. Prior to pullout testing, tensile tests were carried out on bare bars to characterize their mechanical properties (El Refai, 2013). Test results are listed in Table 6. Bar characteristics reported by the manufacturer are also given in the table as guaranteed properties. As per the manufacturers’ specifications, BFRP and GFRP bars are pultruded using epoxy and vinyl ester resins, respectively. Both FRP bars are sand-coated on their surfaces. Visual inspection of the bars reveals uniform and consistent sand coating on GFRP bar surface whereas the BFRP bar surface shows shallow spiral indentations spaced at 2.75 mm along the bar (Figure 10).
Table 6: FRP bars design properties
Bar material Resin type Surface treatment Tensile strength (MPa) Ultimate strain (%) Elastic Modulus (GPa)
Guaranteeda Testedb Guaranteeda Testedb
BFRP Epoxy sand-coated 1168 1017 0.022 50 48 GFRP Vinyl ester sand-coated 941 986 0.019 54 53
a Reported by the manufacturer b Tested by El Refai (2013)
(a) (b)
Figure 10: Surface deformations of (a) BFRP and (b) GFRP bars
3.2.3 Test Specimens
Cylindrical moulds of 150 mm diameter and 300 mm height were used to cast the pullout specimens. BFRP and GFRP bars of 1000 mm long were concentrically positioned
22
in the moulds using the wooden frame shown in Figure 11. Circular holes of diameters equal to the bar diameters were made at the top and bottom of the wooden frame. After concrete casting, a plastic cover with holes of equal diameter ensured the centricity of the bar.
(a) (b) (c)
Figure 11: Centering the bars in the specimen moulds using (a) cylindrical moulds, (b) wooden forms and (c) plastic covers
Prior to casting, FRP bars were properly marked so that the embedment length, ld,
would lie in the middle third of the cylindrical mould. PVC tubes were used as bond breakers at top and bottom of the specimen. This arrangement was chosen to prevent compressive stresses that are induced during the pullout testing from influencing the bond behaviour of the bar (Achillides and Pilakoutas 2004). The PVC tubes were glued in position on the bar length before casting. It was ensured that little amounts of glue enough to position the tube in place without affecting the bond performance of the bar was used. Figure 12 shows typical bar preparation before being positioned in the concrete cylinder. Embedment lengths were designed as multiples of the bar diameter to facilitate comparisons between bars of different diameters as will be illustrated.
23 Figure 12: BFRP bar with PVC tubes dictating the embedment length of the bar
3.3 Bond Test Program
In each phase of the testing program, the specimens were divided into two groups: (1) group A, which consisted of BFRP-reinforced specimens and (2) group B, the companion group, which consisted of GFRP-reinforced specimens tested for comparison.
Phase I:
In phase I, a total of 48 specimens reinforced with BFRP and GFRP bars were tested. The test parameters included the bar diameter, the embedment length of the bar in concrete, and the FRP bar material. Three nominal diameters (8, 10, and 12 mm) were used for BFRP bars. Only GFRP bars of diameter 10 mm were tested. Four embedded lengths taken as multiples of the bar diameter (5, 7, 10, and 15 times the diameter) were investigated.
For each set of test parameters, three specimen replicates were tested to ensure the reliability of the test results. Specimens are labeled as follows: the first character marks the bar type (B for basalt and G for glass), followed by the bar diameter (8, 10, or 12 mm). The numeral next to the bar diameter refers to the embedment length. Last digit refers to the specimen number in its group. For instance, B12-120-3 refers to a BFRP-reinforced specimen with a bar diameter of 12 mm and an embedment length of 120 mm (equivalent to 10 times the bar diameter). The last digit refers to the third specimen of its set. Table 7 shows the test matrix and the specimens’ designation of phase I.
24
Table 7: Specimens’ designation and test parameters of phase I
Specimen’s designation*
Specimen’s number Bar type db (mm) ld (mm)
Basalt specimens B8-40-x 3 BFRP 8 40 B8-56-x 3 8 56 B8-80-x 3 8 80 B8-120-x 3 8 120 B10-50-x 3 BFRP 10 50 B10-70-x 3 10 70 B10-100-x 3 10 100 B10-150-x 3 10 150 B12-60-x 3 BFRP 12 60 B12-84-x 3 12 84 B12-120-x 3 12 120 B12-180-x 3 12 180 Glass specimens G10-50-x 3 GFRP 10 50 G10-70-x 3 10 70 G10-100-x 3 10 100 G10-150-x 3 10 150
* The letter x in the specimen’s label refers to the specimen number 1, 2, or 3.
Phase II:
In this phase, the effect of FT cycles on the bond performance of BFRP and GFRP bars was investigated. Only one embedment length of 7db was considered for all specimens. A
total of 24 FRP-reinforced concrete cylinders were tested. The parameters investigated were the FRP material, the bar diameter, and the number of FT cycles (100 and 200 cycles). Table 8 shows the test matrix and the specimens’ designation for phase II. Specimens are labeled similar to those of phase I. The number of FT cycles (100 or 200) is added to the specimen’s label to differentiate between unconditioned and conditioned specimens. For instance, B12-84-100-3 refers to a BFRP-reinforced specimen with a bar diameter of 12 mm and an embedment length of 84 mm that has been subjected to 100 cycles of freeze-and-thaw. The last digit refers to the third specimen of its set.
25
Table 8: Specimens’ designation and test parameters of phase II
Specimen’s
designation Specimen’s number Bar type db (mm) (mm) ld # of cycles Basalt specimens B8-56-100-x 3 BFRP 8 56 100 B10-70-100-x 3 10 70 B12-84-100-x 3 12 84 B8-56-200-x 3 BFRP 8 56 B10-70-200-x 3 10 70 200 B12-84-200-x 3 12 84 Glass specimens G10-70-100-x 3 GFRP 10 70 100 G10-70-200-x 3 10 70 200
* The letter x in the specimen’s label refers to the specimen number 1, 2, or 3.
3.4 Test setup
3.4.1 Specimen seating and anchoring
Pullout arrangement is shown in Figure 13. Concrete specimens were placed in a specifically fabricated steel frame that was positioned in the testing machine as shown in the figure. The frame consisted of a bearing plate 25 mm thick connected to the rigid base of the machine with four rods 20 mm in diameter. Prior to load application, specimens were seated on a wooden plate supported on two horizontal steel beams to allow instrumentation prior to testing as shown in Figure 14.
Two circular steel plates and a rubber plate were introduced between the concrete specimen and the bearing plate to secure the contact between the top surface of concrete and the bearing plate (Figure 15). This arrangement was necessary to minimize the effect of surface irregularities on the specimen’s alignment and to prevent accidental lateral movement during testing.
26
Figure 13: Pullout test set up
Figure 14: Wooden base supported on steel channels
For each specimen, a steel pipe of 250 mm long was installed at the end of the FRP bar to serve as end-anchor (Figure 16). Anchors were designed according to the CSA-S806-02 (2002) provisions. In order to ensure concentric alignment of the bar inside the anchor, two plastic washers were used as spacers as shown in Figure 17. Prior to testing, all anchors were grouted by a commercially available expansive mortar known as RockFrac. The grout
27 was allowed to cure for 24 hours after casting to reach its maximum compressive and bearing stresses.
Figure 15: Hinge system to minimize the effect of surface irregularities
Figure 16: Steel pipe used to anchor the FRP bar
Figure 17: Plastic washers to ensure centricity of the bar
3.4.2 Specimen instrumentation
Each specimen was instrumented by three Linear Variable Displacement Transducers (LVDTs) in order to measure the slip in the bar during load application. Two LVDTs
Hinge system
Plastic washer
28
measured the bar movement relative to concrete surface at the free (unloaded) end that extended outside the concrete cylinder (Figure 18-a). Another LVDT placed at the top of specimen measured the bar displacement at the loaded end (Figure 18-b). Holes were made in the upper steel plate and the wooden base in order to allow the FRP bar and the LVDTs to pass through the plates. It is worth mentioning that, in the first tests conducted in this study, four LVDTs were used (two at the unloaded end and two at the loaded end of the bar). However, due to the damage of one of these LVDTs, only three LVDTs were used in the remaining tests.
(a) (b)
Figure 18: LVDTs fixed at the (a) unloaded ends and (b) loaded ends
3.4.3 Specimen testing
The instrumented test specimen was positioned in an MTS universal testing machine of 500 kN capacity. Direct tensile load was applied to the bar in a strain-control mode at a rate of 1.2 mm/min according to CSA-S806-02 (2002) guidelines. Test was halted when the bar could carry no more loads. During the test, a data acquisition system recorded the load and slip readings at a rate of 5 readings/sec.
Loaded end
Free end
29
Chapter 4: Results and Discussions
This chapter presents the results of the pullout tests carried out on the BFRP and GFRP reinforced concrete cylinders. As described in chapter 2, the FRP material, the bar diameter, the embedment length, and the freeze-and-thaw (FT) conditions were considered in this investigation. In this chapter, the effect of each parameter on the bond behavior of FRP bars is presented. Bond-slip curves and failure mechanism of all tested specimens are discussed.
4.1 Phase I results: Bond behavior of unconditioned specimens
In this phase, a total of 48 unconditioned specimens were tested at room temperature. The effect of three main parameters (the bar material, the bar diameter, db, and theembedment length, ld) on bond was studied.
4.1.1 Bond-slip relationships
The bond strength, τmax, developed by the bar is defined by equation (5) as follows:
(Equation 5)
where P is the tensile load, d is the bar diameter, and ld is the bar embedment length.
At any stage of loading, bar slip values at the unloaded ends were obtained directly from the LVDTs located at the bottom of the tested specimen. For the loaded ends, the elongation of the bar between the upper LVDT support and the beginning of the bonded zone was subtracted from the LVDT measurements. Table 9 shows the results of pullout tests of the unconditioned specimens.
30
Table 9: Results of unconditioned pullout bond specimens
Ascending branch Softening branch
Test Failure
mode
τmax smax, fe smax, le τons, fe τons, le τr, fe τr, le PBPE
(MPa) (mm) (mm) (MPa) (MPa) (MPa) (MPa) (MPa)
BFRP specimens B08-40-1 P 16.56 0.01 0.45 14.22 0.55 10.80 15.30 0.030 B08-40-2 P 15.81 0.15 0.60 14.60 1.40 10.00 11.92 0.030 B08-40-3 P 19.81 0.10 0.98 19.45 0.38 14.50 14.34 0.016 B08-56-1 P 14.10 NA 0.00 12.18 NA 11.90 9.92 NA B08-56-2 P 14.01 0.12 0.73 13.25 0.45 9.50 9.00 0.030 B08-56-3 P 21.60 NA 1.20 19.98 0.80 13.50 13.12 NA B08-80-1 P 18.07 0.10 1.07 17.93 2.30 13.50 13.36 0.012 B08-80-2 P 11.80 0.01 0.55 11.79 2.80 7.50 7.74 0.003 B08-80-3 NA NA NA NA NA NA NA NA NA B08-120-1 P 13.74 0.20 1.87 13.37 1.30 10.40 11.05 0.020 B08-120-2 P 15.27 0.13 2.16 14.96 1.30 9.39 12.20 0.012 B08-120-3 P 10.65 0.16 1.63 10.40 0.90 5.01 7.50 0.022 B10-50-1 P 14.37 0.29 0.89 12.43 0.70 7.30 9.22 0.055 B10-50-2 P 13.71 0.23 0.00 11.30 NA 9.00 7.96 0.045 B10-50-3 P 15.30 0.05 0.11 15.69 0.60 10.00 12.56 0.012 B10-70-1 P 18.10 0.20 0.48 10.04 0.40 7.60 6.61 0.040 B10-70-2 P 17.11 0.20 0.85 9.24 0.46 7.00 6.70 0.040 B10-70-3 P 14.64 0.20 0.85 7.98 0.40 7.00 6.57 0.040 B10-100-1 P 13.26 0.01 1.24 12.03 0.80 8.50 12.14 0.002 B10-100-2 P 12.76 0.01 1.44 11.78 0.32 8.70 12.19 0.001 B10-100-3 P 13.92 0.16 1.47 12.89 0.32 NA 9.15 0.015 B10-150-1 P 10.80 0.23 1.33 10.59 1.50 5.30 6.40 0.022 B10-150-2 P 12.71 0.23 1.58 12.55 1.28 8.25 9.30 0.020 B10-150-3 P 10.48 0.17 1.83 10.22 0.25 6.00 8.44 0.018 B12-60-1 P 16.51 0.20 0.84 12.96 1.30 10.00 10.17 0.027 B12-60-2 P 17.02 0.25 0.56 13.37 0.30 12.50 12.57 0.032 B12-60-3 P 17.40 0.00 0.00 17.21 0.27 12.00 12.03 0.000 B12-84-1 P 17.97 0.00 0.75 9.04 0.10 6.10 6.00 NA B12-84-2 P 12.35 0.15 0.66 5.99 NA 4.50 3.90 0.030 B12-84-3 P 13.87 0.13 0.98 7.22 0.10 6.00 5.53 0.025 B12-120-1 P 14.32 0.28 0.00 12.80 NA 11.00 NA 0.027 B12-120-2 P 14.42 0.19 1.36 14.17 0.97 10.50 10.70 0.017
31 B12-120-3 NA NA NA NA NA NA NA NA NA B12-180-1 P 10.91 0.25 2.31 10.50 0.25 NA NA 0.022 B12-180-2 P 11.68 0.30 2.37 11.15 0.40 6.00 9.98 0.022 B12-180-3 P 12.18 0.25 2.14 11.83 0.40 6.70 10.20 0.017 GFRP specimens G10-50-1 P 20.07 0.36 0.03 12.13 0.78 4.60 4.90 0.300 G10-50-2 P 21.03 0.00 1.32 16.69 0.45 12.50 14.00 NA G10-50-3 P 20.44 0.02 0.00 NA 1.80 7.00 6.73 NA G10-70-1 S 17.35 0.00 0.92 17.08 NA 8.00 5.83 NA G10-70-2 S 18.22 0.00 1.67 18.09 0.70 6.50 5.62 NA G10-70-3 S 20.75 0.00 1.13 NA 0.96 NA 0.34 NA G10-100-1 P 17.52 0.16 0.00 15.45 0.16 NA 1.05 0.140 G10-100-2 R 15.21 0.01 0.00 15.17 1.00 NA NA NA G10-100-3 P 17.88 0.12 0.78 15.16 NA NA 2.02 0.060 G10-150-1 R 12.37 NA NA NA NA NA NA NA G10-150-2 R 11.56 0.01 1.78 NA 1.30 NA NA NA G10-150-3 R 11.71 0.01 0.80 NA NA NA NA 0.005
Note:P = pullout; S = concrete splitting; R = bar rupture; NA = test data not available; τmax = maximum bond
stress; smax, le and smax, fe = slip corresponding at maximum stress at loaded and unloaded (free) ends,
respectively; τons, le and τons, fe = bond stress at onset of slip at loaded and unloaded ends, respectively; τr, le and
τr, fe = residual bond stress at loaded and unloaded ends, respectively.
Figure 19 and Figure 20 depict typical relationships between bond stress and slip histories for BFRP bars having different diameters and embedment lengths at both the unloaded and loaded ends, respectively. Figure 21 compares the bond-slip curves at the unloaded ends of BFRP and GFRP specimens with bar diameter of 10 mm. It can be noticed that bar slip in some specimens was not fully recorded due to unexpected damage of LVDTs. These specimens can be clearly identified from the plots.
As seen from the figures, all BFRP and GFRP curves showed an initial ascending branch up to a maximum stress value, τmax. Increase in bond stress was accompanied by an
increase in slip between the bar and the surrounding concrete. Bond-slip curves also showed a falling branch, or softening branch, after maximum bond stress was attained. This portion of the curve was characterized by a significant drop in the bond stress accompanied by an increase in the bar slip.
32
The comparison between bond-slip curves of BFRP and GFRP bars (Figure 21) demonstrates the similarity in the bond-slip trend of both types of bars. Ascending and softening branches can be clearly identified from the plots. BFRP bars of 10 mm diameter developed 71%, 89%, and 79% of the GFRP bond strength for embedment lengths of 5, 7, and 10 d, respectively, with an average value of 80%. Figure 22 compares between average values of maximum stress developed by all specimens. The corresponding slip recorded at unloaded ends was negligible for both types of bars (average of 0.15 mm and 0.06 mm for BFRP and GFRP bars, respectively). At the loaded ends, an average slip of 1.02 mm and 0.81 mm was encountered at maximum stress for BFRP and GFRP bars, respectively.
At all stages of loading, bar slip at unloaded ends was significantly smaller than that at loaded ends. In fact, slip initiates at the loaded end almost at the beginning of the test after the chemical adhesion breaks between the bar and concrete. Adhesion of FRP bars to concrete is the principal component that describes the bond performance of the bar at initial loading stages. Once adhesion between the bar and concrete breaks, the loaded end starts to slip and friction between the outer layer of the bar and concrete controls the bond mechanism. Achillides and Pilakoutas (2004) reported that adhesion of GFRP and CFRP bars depends on the bar diameter regardless of its fiber material. Average values of 0.82 MPa and 0.86 MPa for both types of bars, respectively, having 8.5 mm diameter were reported (Achillides and Pilakoutas 2004). In the current study, stress at onset of slip at loaded ends was obtained from the bond-slip curves at the points where initial slope of the ascending branch changed abruptly. These values are listed in Table 3 for all the test specimens. An average value of 1.37, 0.67, and 0.51 MPa was determined for BFRP bars of diameters 8, 10, and 12 mm, respectively, compared to an average value of 1.03 MPa for the GFRP bar of diameter 10 mm. Average stress values are also depicted in Figure 23-a in MPa and as a percentage of the ultimate stress attained. These findings demonstrate that adhesion developed by BFRP bars to concrete is about 65% of that developed by GFRP bars.
33 (a)
34
(c)
(d)
Figure 19: Typical bond-slip curves for BFRP bars at unloaded ends: (a) ld = 5d, (b)
35 (a)
(b)
36
(c)
(d)
Figure 20: Typical bond-slip curves for BFRP bars at loaded ends: (a) ld = 5d, (b) ld
37 (a)
38
(c)
(d)
Figure 21: Comparison between bond-slip curves for BFRP and GFRP bars at unloaded ends (a) ld = 5d and (b) ld = 7d, (c) ld = 10d, and (d) ld = 15d
39 Figure 22: Ratio of the bond stress to the ultimate strength at slip onset at loaded
end
Adhesion values obtained for BFRP bars in Figure 23-b also confirm the findings of Achillides and Pilakoutas (2004) that adhesion depends on the bar diameter. Test results show that the stress needed to mobilize slip of BFRP bars of small diameters is larger than that needed for bars of large diameters. For instance, the 8 mm diameter BFRP bars slipped at a stress of 1.37 MPa representing 9% of its maximum bond stress, while the 12 mm bars slipped at a stress of 1.03 MPa (6% of its maximum stress).
Similar trend was observed at the unloaded ends of BFRP bars. In fact, the slip recorded at the unloaded ends of both BFRP and GFRP bars remained practically zero until the bond stress reached levels close to the bond strength of the bar. The ratio of bond stress at onset of slip of the unloaded ends to ultimate stress is shown in Figure 23-b. Bars with small diameter encountered slip at higher values of stresses than those of large diameters. Bond stress of 8 mm BFRP bar reached 14.77 MPa (95% of its ultimate stress) before the bar started to slip at its unloaded end. This value dropped to 11.74 MPa (81% of maximum stress) for 12 mm diameter bars. On the other hand, the stress that mobilized slip of the 10 mm BFRP and GFRP bars was 11.67 MPa and 14.72 MPa, representing 84% and 87% of
40
the corresponding ultimate stress, respectively. These values are listed in Table 9 for all the test specimens. These values conform well to the values reported by Achillides (1998) and Achillides and Pilakoutas (2004).
41 (a)
(b)
Figure 23: Ratio of bond stress to ultimate stress at onset of slip at (a) loaded ends and (b) unloaded ends