Aristide Maniriho, Edouard Musabanganji and Philippe Lebailly / Montenegrin Journal of Economics, Vol. 16, No. 3 (2020), 185-196
185 ‘
Analysis of Economic Efficiency of Small-scale Onion Production
in Volcanic Highlands in Rwanda
ARISTIDE MANIRIHO
1(
Corresponding author), EDOUARD MUSABANGANJI
2,
and PHILIPPE LEBAILLY
31 PhD student in Agricultural Sciences and Biological Engineering, Unity of Economics and Rural Development,
Gembloux Agro-Bio Tech, University of Liège, Passage des Déportés, 2 B-5030 Gembloux, Belgium, and Assistant Lecturer at University of Rwanda, School of Economics, KK 737 St, Kigali, Rwanda,
e-mail: [email protected] , [email protected]
2 PhD in Agricultural Sciences and Biological Engineering, Senior Lecturer, School of Economics, University
of Rwanda, KK 737 St, Kigali, Rwanda.
3 PhD in Agricultural Sciences and Biological Engineering, Professor, Unity of Economics and Rural
Development, Gembloux Agro-Bio Tech, University of Liège, Passage des Déportés, 2 B-5030 Gembloux, Belgium.
A R T I C L E I N F O
A B S T R A C T
Received March 07, 2020 Revised from April 10, 2020 Accepted May 22, 2020
Available online September 15, 2020
Onion is recognized for its nutritional value, its curative capacities and its fitness to flavor diets. This article attempted to assess the economic efficiency of input combinations among onion farmers in the Volcanic Highlands in Rwanda. Data were collected using a questionnaire administered to a random sample of 94 small-scale onion producers. Cobb-Douglas type stochastic frontier functions were specified and estimated using maximum likelihood method to estimate technical, allocative, and economic efficiencies of onion production. A simultaneous-equations model was specified and estimated with seemingly unrelated regression method to identify the sources of technical, allocative, and economic efficiencies. Results from econometric estimations revealed that seeds and organic fertilizers are the most influential determinants of onion production, and showed that the total production cost increases with an increase in onion output. The sum of input coefficients of 1.03 (greater than 1) indicates that onion production scores the increasing returns to scale in the study area. The results also pointed to the significant effect of education and household size on farm efficiencies. Finally, the study suggests the enhancement of farmer’s professional trainings and the re-adaptation of extension services to the farmers’ needs so as to achieve the optimal use of resources.
JEL classification: D24, D61, Q12
DOI: 10.14254/1800-5845/2020.16-3.15 Keywords:
Economic efficiency, stochastic frontier function, onion,
Volcanic Highlands, Rwanda
.
INTRODUCTION
Oignon (Allium cepa L.) is relatively very important crop because of its high nutritional value: it is rich in protein, calcium and riboflavin (Purseglove et al., 2000) and it has recognized curative
ELIT
Economic Laboratory Transition Research Podgorica
Montenegrin Journal of Economics
Vol. 16, No. 3 (2020), 185-196Aristide Maniriho, Edouard Musabanganji and Philippe Lebailly / Montenegrin Journal of Economics, Vol. 16, No. 3 (2020), 185-196
186
powers and is mostly preferred for its distinctive fitness to heighten the flavor of the diets, the rea-son why it is among the most widespread and highly consumed vegetables all around the world (Hafez & Geries, 2019). However, it is considered a minor crop in Rwanda, even though it seems to be able to compete with all other crops in terms of yields and price. The government has also emphasized the place of the sustainable development of the horticultural sector in enhancing food security, reducing poverty and sustaining the environment.
Agriculture is the backbone of economic development in Rwanda, as in many other countries of Sub-Saharan Africa. Recent statistics show that the agricultural sector contributes 73 per cent of employment (NISR, 2012) and 33.6 per cent of the nominal GDP (NISR&BNR, 2013). As a devel-opment priority in Rwanda, agriculture was recognized as the engine of the primary growth (MINAGRI, 2017). It has been chosen as the first and strongest leverage to put the country on a sustainable development process and to fight against poverty. The decrease in land productivity has been attributed to several factors including soil degradation due to long term practice of low input agriculture and poor farming systems associated with government policy of subsidizing chem-ical fertilizers for maize production. This has resulted in low fertile and fragile soils due to organic matter and carbon depletion leading to increased land desertification, declining or stagnant crop yields, poverty, and food insecurity and malnutrition (Republic of Rwanda, 2013). A major reason for the relatively poor performance of agriculture in low-income regions has been the neglect of this sector in the development priorities of their governments. New agricultural technologies and innovations in farm practices are preconditions for sustained improvements in levels of output and productivity in most developing countries (Todaro & Smith, 2011). Knowing that agricultural sector has great potential to reduce poverty and to ensure inclusive growth, the Government of Rwanda has adopted the increase of the productivity of agriculture as a priority (Republic of Rwanda, 2013). Since the scope to expand cultivable land area is limited, improved productivity of agricul-ture land is critical for income generation. Rwandan agriculagricul-ture seeks to move from being a largely subsistence to a commercialized sector, building on the sector’s comparative advantage and sup-porting skills and knowledge for smallholder farmers. A progressive shift towards harnessing the potential of the private sector will be the main instrument for achieving greater productivity and incomes in agriculture. The focus is therefore on irrigation and land husbandry, proximity advisory services for crops and livestock and connecting farmers to agribusiness through smallholder ag-gregation farming models. The remaining research and policy issue is to find the conditions under which the results achieved will remain over a longer period.
Although policies to achieve increasing crop production in Rwanda have been sufficiently im-plemented, the remaining challenge is to have strong strategies to avail current increasing crop production to both current generation and to the future one. This requires measuring the physical relationship between crop production and the factors required to achieve it. In economics, this relationship is measured by a production function. It describes the technical relationship that transforms inputs (resources) into outputs (Debertin, 2012). In this respect, Debertin (2012) clas-sifies the inputs in fixed inputs and variable inputs. The problem is that the documentation about the input combination among the crop farmers as well as the efficiency level is very limited. FAO (2016) identified the improved efficiency in the use of the resources as one of the key principles of a common vision of a sustainable food and agriculture. This study aims to estimate the agricultural production and cost functions, the economic efficiency as well as to identify the sources of ineffi-ciency among crop producers in Rwanda. It contributes to the knowledge of technical, allocative, economic, and cost efficiencies, the determinants of crop production as well as the sources of inef-ficiency among crop producers in Rwanda.
The focus of this paper is to assess the economic efficiency of input combinations among on-ion farmers in the Volcanic Highlands in Rwanda. In this line, this study follows the model of Mburu et al. (2014) who examined the economic efficiency of crop production and its determinants, and identified the sources of inefficiency using the stochastic frontier production function (SFP) and
Aristide Maniriho, Edouard Musabanganji and Philippe Lebailly / Montenegrin Journal of Economics, Vol. 16, No. 3 (2020), 185-196
187 data envelopment analysis. Further, different studies focused on the analysis of technical efficien-cy (Cheamuangphan et al., 2013).
Specifically for Rwanda, Maniriho and Bizoza (2015) assessed the allocative efficiency among the small scale farmers in Musanze District, Northern Rwanda and reported that the small scale farmers underutilized the resources given the total factor productivity estimated to 1.47. Mulinga (2013) conducted an economic analysis of factors affecting technical efficiency of smallholders’ maize production in Rwanda and found out that education, credit access, farming experience and age of the farmer are the significant factors explaining efficiency, but the validity of these findings to other crops is still questionable. As for Byiringiro and Reardon (1996), they analysed the effects of soil conservation investments on allocative efficiency and found out that there is evidence of allocative inefficiency in use of land and labour, probably due to factor market access constraints. Further, Mugabo et al. (2014) reported that technical inefficiency was responsible for at least 93% of total variation in soybean output among the surveyed farmers, and the relative efficiency (alloca-tive efficiency) of resource use, expressed as the ratio of marginal value product (MVP) to marginal factor cost (MFC), were 1.73 for soybean plot size, 1.36 for fertilizers, and 1.92 for pesticides. These results show that the soybean production is technically inefficient in Kamonyi District, Southern Rwanda.
Referring to the above background, it is remarkable that only the efficiency analysis of few crops in Rwanda is documented. Part of contribution of this study is to give light on technical, al-locative and economic efficiency among small scale onion growers in Rwanda. Results inform farmers and extension agents at what extent are the agricultural resources efficiently used. They also inform the policy where further efforts are needed to sustain the on-going agricultural devel-opment process in Rwanda. There have been drastic develdevel-opments in the agrarian farming sys-tems with salient effect in the rural transformation (Forrest Zangh and Donaldson, 2010), but the situation should be improved towards the optimal use of available resources in the context of Rwanda. The purpose of this paper is to assess the economic efficiency of small-scale onion pro-duction using farm level data and the stochastic frontier approach. It aims specifically to estimate the efficiency indices and identify the factors influencing technical, allocative, and economic effi-ciencies among small-scale onion producers in Rwanda.
The rest of this paper is organised as follow. Section 2 presents the analytical framework. Sec-tion 3 summarizes the empirical results and secSec-tion 4 concentrates on discussion from the esti-mates of efficiencies. The paper ends with section 5 that focuses on conclusion and policy recom-mendations.
1. ANALYTICAL FRAMEWORK OF ECONOMIC EFFICIENCY
The concept of economic efficiency was discovered by Farrel (1957) to estimate technical, al-locative, and economic efficiencies through the cost decomposition. This procedure was adopted by different scholars (for example, Bravo-Ureta & Pinheiro, 1997). According to Farrell (1957), technical efficiency (TE) is associated with the ability to produce on the frontier isoquant, while allocative efficiency (AE) refers to the ability to produce a given level of output using the cost-minimizing input ratios. Alternatively, technical inefficiency is related to deviations from the frontier isoquant, and allocative inefficiency reflects deviations from the minimum cost input ratios. Thus, economic efficiency (EE) is defined as the capacity of a firm to produce a predetermined quantity of output at minimum cost for a given level of technology (Farrell, 1957).
The term efficiency is often used synonymously with that productivity, the most common measures that relate output to some input. According to Lovell (1993) the term efficiency refers to the comparison between the real or observed values of input (s) and output (s) with the optimal values of input (s) and output (s) used in a particular production process. Farm efficiency can be
Aristide Maniriho, Edouard Musabanganji and Philippe Lebailly / Montenegrin Journal of Economics, Vol. 16, No. 3 (2020), 185-196
188
measured in terms of technical efficiency, allocative efficiency and economic efficiency. According to Bravo-Ureta and Pinheiro (1997), technical efficiency is the ability of a firm to maximize output for a given set of resource inputs while allocative (factor price) efficiency reflects the ability of a firm to use the inputs in optimal proportions given their respective prices, and production technol-ogy. Economic efficiency is the combination of technical and allocative efficiencies (Farrell, 1957).
Productive units can be inefficient either by obtaining less than the maximum output available from a determined set of inputs (technical inefficiency) or by not purchasing the lowest priced package of inputs given their respective prices and marginal productivities (allocative efficiency). Efficiency measurement can be categorized as either input or output oriented: input-oriented tech-nical efficiency evaluates how much input quantities can be reduced without changing the quanti-ties produced while output-oriented measures of efficiency estimate the extent to which output quantities can be expanded without altering the input quantities used (Kumbhakar et al., 2015).
The firm’s technology is represented by the stochastic frontier production function specified following Meeusen and van den Broeck (1977):
i i
i f X e
Y ( ;) --- (1)
where Yi the output of the
i
th farmer, Xi a vector of input quantities of thei
th farmer, and = a vector of unknown parameters to be estimated. Consider the following:)
( i i
i V U
e --- (2)
The Vi are assumed to be independent and identically distributed (0, ) 2 v
N
random errorsindependent of the Ui. The Ui are nonnegative technical inefficiency effects representing man-agement factors and are assumed to be independently distributed with mean ui and variance
2
.The
i
th farm exploits the full technological production potential when the value of Uicomes out to be equal to zero, and the farmer is then producing at the production frontier beyond which he cannot produce. The greater is the magnitude of Uifrom the production frontier, the higher is the level of inefficiency of the farmer (Drysdale et al., 1995). A stochastic production frontier func-tion that was used to estimate technical, allocative and economic efficiencies was assumed to be specified by the Cobb-Douglas frontier production function which is defined by:) ( 4 4 3 3 2 2 1
1LogX LogX LogX LogX Up Vp
Log
LogY ---- (3)
Where V is a two-sided, normally distributed random error, while U is a one-sided efficiency component with a half normal distribution.
Descriptive statistics (mean and standard deviation) and stochastic frontier production and cost functions were used to analyze the socio-economic characteristics, technical and allocative efficiencies respectively of the farmers, while the farmer’s economic efficiencies were estimated as the product of TE and AE. All study variables are defined and described in details in the table 1.
The maximum likelihood estimation of (1) provides estimates for the beta coefficients. The var-iances of the random errors
v2 and those of the technical and allocative inefficiency effects2 u
and overall variance of the model
2are related; thus, 2 2 2 u v --- (4)The ratios u2/2 and u/vmeasure the total variation of output from the frontier which can be attributed to technical or allocative inefficiency (Battese & Corra, 1977), whereby the esti-mated values of
and
explain the relative sources of inefficiencies. As
ranges from 0 to 1,Aristide Maniriho, Edouard Musabanganji and Philippe Lebailly / Montenegrin Journal of Economics, Vol. 16, No. 3 (2020), 185-196
189 its value approaching 0 means that the difference between the observed values of Yi and the fron-tier for certain amounts of selected inputs are largely due to the factors beyond the control of the farmer. When
equals to one, it means that technical inefficiency is the main source of the devi-ations of Yi from the frontier output.Subtracting vi form both sides of (1) yields (5), we obtain: ip i i i i y v f X U Y* ( ;) ---- (5) where * i
Y is the observed output of the 𝑖th firm, adjusted for the stochastic noise captured by vi. Equation (5) is the basis for deriving the technically efficient input vectors and for analytically deriv-ing the dual cost frontier of the production function represented by (1).
For a given level of output * i
Y , the technically efficient input vector for the 𝑖th firm, X , is it
derived by simultaneously solving (3) and the ratios X1/Xi ki (𝑖 > 1) where ki is the ratio of observed inputs X and 1 Xi. Assuming that the production function in (1) is self-dual, the dual cost frontier can be derived algebraically and written in a general form as
) ; , ; ( i i* i f P Y C --- (6)
where Ci is the minimum cost of the
i
th firm associated with output * iY , Pi is a vector of in-put prices for the
i
th firm, and
is a vector of parameters. The economically efficient input vec-tor for thei
th firm, X , is derived by applying Shephard’s Lemma and substituting the firm’s ie input prices and output level into the resulting system of input demand equations:) ; ( i i* e i i i X PY P C , i1,2,...,m inputs --- (7)
where
is a vector of estimated parameters.For this study, the Cobb-Douglas cost frontier function for onion production was specified and defined as follows: i c i c U V Y Ln LnP LnP LnP LnP LnP Ln LnC * 5 5 4 4 3 3 2 2 1 1 6 ---- (8)
Where C is the total production cost, P is the price of seeds, 1 P the price of organic fertiliz-2 ers, P3 the price of chemical fertilizers, P the price of pesticides, and 4 P5 the price of labor,
*
Y the predicted values of onion production, U and V are the same as in the stochastic
pro-duction function (3), except that they are distinguished by the subscripts p and v to imply respec-tively that they are related to production or cost function. Besides, the Uic is the allocative ineffi-ciency, while Uip is the technical inefficiency. The maximum likelihood (ML) method was used to estimate of parameters of the frontier production efficiency function. The Uicis the allocative inefficiency, while Uip is the technical inefficiency, in the equations (5) and (8) respectively.
The parameters of the stochastic frontier functions were estimated by the method of maxi-mum likelihood using the computer program Stata (Kumbhakar et al., 2015). The observed, tech-nically efficient, and economically efficient costs of production of the
i
th firm are equal to Pi Xi' , t
i i X
P' and Pi'Xie, respectively (Farrell, 1957). These cost measures are used to compute
tech-nical efficiency (TE) and economic efficiency (EE) indices for the
i
th firm as follows: ) exp( ) exp( ) ; ( ) exp( ) ; ( max * ' ' ip i i i i i i i i i i i t i i i U V X f U V X f Y Y Y Y X P X P TE ……… (9.1)Aristide Maniriho, Edouard Musabanganji and Philippe Lebailly / Montenegrin Journal of Economics, Vol. 16, No. 3 (2020), 185-196
190 ] / ) [exp( ) , , ( ) , , 0 ( * ' ' i i i i i i i i i i i e i i i E U P Y Iu C E P Y Iu C E C C X P X P EE ……… . (9.2)
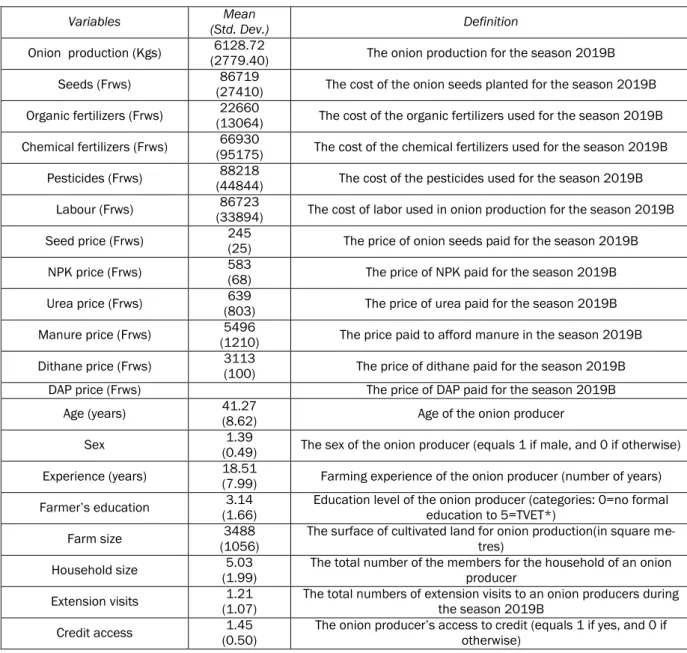
Table 1: Definition and measurement of variables (n=94)
Variables (Std. Dev.)Mean Definition
Onion production (Kgs) (2779.40)6128.72 The onion production for the season 2019B
Seeds (Frws) (27410)86719 The cost of the onion seeds planted for the season 2019B
Organic fertilizers (Frws) (13064)22660 The cost of the organic fertilizers used for the season 2019B
Chemical fertilizers (Frws) (95175)66930 The cost of the chemical fertilizers used for the season 2019B
Pesticides (Frws) (44844)88218 The cost of the pesticides used for the season 2019B
Labour (Frws) (33894)86723 The cost of labor used in onion production for the season 2019B
Seed price (Frws) 245(25) The price of onion seeds paid for the season 2019B
NPK price (Frws) 583(68) The price of NPK paid for the season 2019B
Urea price (Frws) (803)639 The price of urea paid for the season 2019B
Manure price (Frws) (1210)5496 The price paid to afford manure in the season 2019B
Dithane price (Frws) 3113(100) The price of dithane paid for the season 2019B
DAP price (Frws) The price of DAP paid for the season 2019B
Age (years) 41.27(8.62) Age of the onion producer
Sex (0.49)1.39 The sex of the onion producer (equals 1 if male, and 0 if otherwise)
Experience (years) 18.51(7.99) Farming experience of the onion producer (number of years)
Farmer’s education (1.66)3.14 Education level of the onion producer (categories: 0=no formal education to 5=TVET*)
Farm size (1056)3488 The surface of cultivated land for onion production(in square me-tres)
Household size (1.99)5.03 The total number of the members for the household of an onion producer
Extension visits (1.07)1.21 The total numbers of extension visits to an onion producers during the season 2019B
Credit access (0.50)1.45 The onion producer’s access to credit (equals 1 if yes, and 0 if otherwise)
Note: * The level of education is measured by the categories: 1=no formal education, 2=primary not com-plete, 3=primary comcom-plete, 4=secondary not comcom-plete, 5=secondary comcom-plete, 6=university, and 7=technical and vocational trainings.
Following the relationship between TE, EE and AE as shown by Farrell (1957), the allocative ef-ficiency (AE) index can be derived from the above equations as follows:
) exp( ' ' ic t i i e i i i U X P X P AE ………. (9.3)
Aristide Maniriho, Edouard Musabanganji and Philippe Lebailly / Montenegrin Journal of Economics, Vol. 16, No. 3 (2020), 185-196
191 Where Uic is the allocative inefficiency that is obtained from the estimates of the frontier cost function (8). Since the economic efficiency of the 𝑖th firm can be decomposed into its technical and allocative components, thus EETE*AE, or AE EE/TE (Farrell, 1957).
Now that EE, TE and AE were obtained from the estimations of the equations (9.1), (9.2) and (9.3), the linear regression model to estimate their coefficients was specified as per the equation (10) following Wooldridge (2016).
AG ED HSZE FEXP CRED EXT
EFF 0 1 2 3 4 5 6 --- (10)
Where
EFF
stands for efficiency level, AG the farmer’s age,ED
the farmer’s education level,HSZE the household size,
FEXP
the farmer’s experience, CRED the access to credit,EXT
the number of extension visits, and
is a vector of coefficients. We have used a seemingly unre-lated regression (SUR) method to estimate the coefficients of the efficiency functions (Equation 10) as it was empirically proposed by Bravo-Ureta and Pinheiro (1997). We have removed the least significant covariate CRED from EE model to meet the requirements of the estimation method.This study used cross-section data collected through a questionnaire from a random sample of 94 small-scale onion producers in the Volcanic Highlands in Rwanda: 50 producers and 44 pro-ducers in Nyabihu and Rubavu Districts, respectively. The details on the definition and the descrip-tion of the study variables are given in the table 1.
2. RESULTS
The results from the maximum likelihood estimates of the stochastic onion production function are detailed in the table 2. The only significant factors that impact positively on onion production are seeds (p value=0.000) and organic fertilizers (p value=0.057). Even though other factors (chemical fertilizers and pesticides) are not significant, they also affect onion production positively. Lambda (
) is 0.012 and the corresponding p-value is 0.975, which shows that it is not signifi-cantly different from zero. Wald chi2 test shows that the explanatory variables included in the model are statistically significant (Wald chi2=119.48, p value=0.000). The results indicate also that onion production scores increasing returns to scale as the sum of the input coefficients amounts to 1.03. In addition, from the estimations of the equation (3) as expressed in the table 2, the technical efficiency (TE) was estimated using the formula (9.1).Table 2. Maximum likelihood estimates of stochastic onion production function
Production Coeff. Std. Err. z P>z [95% Conf. Interval]
Frontier Seeds 0.717 0.107 6.730 0.000 0.508 0.926 Organ. fertilizers 0.148 0.077 1.900 0.057 -0.004 0.299 Chem. fertilizers 0.108 0.074 1.470 0.142 -0.036 0.253 Pesticides 0.060 0.054 1.110 0.267 -0.046 0.166 Constant -2.806 1.098 -2.560 0.011 -4.958 -0.655 Usigma constant -11.222 212.711 -0.050 0.958 -428.128 405.684 Vsigma constant -2.452 0.147 -16.67 0.000 -2.741 -2.164 sigma_u 0.004 0.389 0.010 0.992 0.000 1.24e+88 sigma_v 0.293 0.022 13.590 0.000 0.254 0.339 lambda 0.012 0.391 0.030 0.975 -0.755 0.779
Number of observations 93 Log likelihood -17.926
Wald chi2(4) 119.48 Prob > chi2 0.000
Aristide Maniriho, Edouard Musabanganji and Philippe Lebailly / Montenegrin Journal of Economics, Vol. 16, No. 3 (2020), 185-196
192
The table 3 summarizes the estimates of stochastic onion cost function. The results from the maximum likelihood analysis shows that the predicted values of onion production is the main de-terminant of onion production cost (p-value = 0.000) while the prices of manure, urea and dithane are not significantly impacting on onion cost (p-value > 0.05). For the onion cost function, lambda is significantly different from zero (
=2.492, p-value = 0.000).Table 3. Maximum likelihood estimates of stochastic onion cost function
Cost Coeff. Std. Err. z P>z [95% Conf. Interval]
Frontier Manure 0.089 0.063 1.400 0.161 -0.035 0.213 Urea 0.043 0.027 1.580 0.114 -0.010 0.096 Dithane 0.284 0.360 0.790 0.430 -0.422 0.991 Y* 6.542 0.381 17.190 0.000 5.796 7.288 Constant -4.808 3.204 -1.500 0.134 -11.088 1.473 Usigma constant -2.715 0.186 -14.600 0.000 -3.079 -2.350 Vsigma constant -6.869 0.948 -7.240 0.000 -8.727 -5.011 sigma_u 0.257 0.024 10.760 0.000 0.214 0.309 sigma_v 0.032 0.015 2.110 0.035 0.013 0.082 lambda 7.983 0.034 237.700 0.000 7.917 8.048
Number of observations 90 Log likelihood 48.670
Wald chi2(4) 311.72 Prob > chi2 0.000
Note: all variables are log transformed. Y* are the ML predicted values of onion production. The coeffi-cient of a variable is significantly different from zero if P>z is less than or equal to 0.05.
After determining the values of technical efficiency (TE), allocative efficiency (AE) and econom-ic effeconom-iciency (EE), the analysis showed that the TE ranges from 50.65 to 92.68% with the average of 81.15%, the AE being ranged from 32.47 to 98.50% with the average of 83.68%, while the EE ranges from 26.70 to 86.76% with the mean of 67.84%. The results indicate that 100% of the farms are technically efficiency, 97.78% have achieved allocative efficiency, and 94.44% are eco-nomically efficient. All this is summarized in the table 4.
Table 4. Frequency distribution of technical, allocative, and economic efficiency of the small-scale onion production
Efficiency (%) (levels) No. Technical efficiencya % b Allocative efficiencyNo. a % b Economic efficiencyNo. a % b
<= 10 0 0.00 0 0.00 0 0.00 10 < eff. <=20 0 0.00 0 0.00 0 0.00 20 < eff. <=30 0 0.00 0 0.00 1 1.06 30 < eff. <=40 0 0.00 2 2.13 2 2.13 40 < eff. <=50 0 0.00 0 0.00 2 2.13 50 < eff. <=60 1 1.06 2 2.13 12 12.77 60 < eff. <=70 7 7.45 2 2.13 33 35.11 70 < eff. <=80 21 22.34 24 25.53 35 37.23 80 < eff. <=90 57 60.64 32 34.04 5 5.32 > 90 8 8.51 32 34.04 4 4.26 Total 94 100.00 94 100.00 94 100.00 Mean 81.15 83.68 67.84 Minimum 50.65 32.47 26.70 Maximum 92.68 98.50 86.76
Aristide Maniriho, Edouard Musabanganji and Philippe Lebailly / Montenegrin Journal of Economics, Vol. 16, No. 3 (2020), 185-196
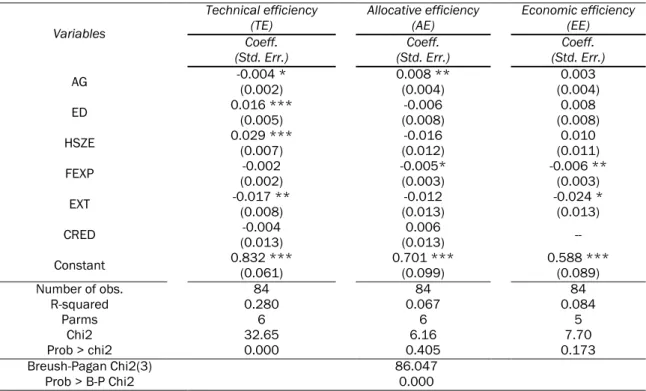
193 It followed the estimation of the equation (10) to identify the sources of the three efficiency in-dexes. The results (table 5) showed that the education and the household size affect positively and significantly the technical efficiency, while the age, the experience, the extension, and the credit access affect negatively but significantly. This means that the sources of technical inefficiency in-clude the age and the experience of the farmer, the extension as well as the credit access. For the allocative efficiency, the results showed that its primary determinants are the age and the farmer’s experience with positive and negative effect, respectively. As for economic efficiency, the results point to farmer’s experience and the number of extension contacts as the primary sources of eco-nomic inefficiencies among the small-scale onion producers in Volcanic Highlands in Rwanda. Table 5. Seemingly unrelated regression estimates of technical, allocative, and economic efficiencies of small-scale onion production
Variables
Technical efficiency
(TE) Allocative efficiency (AE) Economic efficiency (EE) Coeff.
(Std. Err.) (Std. Err.)Coeff. (Std. Err.)Coeff.
AG -0.004 *(0.002) 0.008 **(0.004) (0.004)0.003 ED 0.016 ***(0.005) (0.008)-0.006 (0.008)0.008 HSZE 0.029 ***(0.007) (0.012)-0.016 (0.011)0.010 FEXP (0.002)-0.002 -0.005*(0.003) -0.006 **(0.003) EXT -0.017 **(0.008) (0.013)-0.012 -0.024 *(0.013) CRED (0.013)-0.004 (0.013)0.006 --Constant 0.832 ***(0.061) 0.701 ***(0.099) 0.588 ***(0.089) Number of obs. 84 84 84 R-squared 0.280 0.067 0.084 Parms 6 6 5 Chi2 32.65 6.16 7.70 Prob > chi2 0.000 0.405 0.173 Breush-Pagan Chi2(3) 86.047 Prob > B-P Chi2 0.000 Note: *** p<0.01, ** p<0.05, * p<0.1.
3. DISCUSSION
Economic efficiency is very important in economic analysis. It enables the optimal use of scarce resources and thus economic actors minimize the quantity of used resources or cost to achieve a certain level of output (Farrell, 1957). They can also choose to maximize the output for a given amount of inputs (Lovell, 1993; Debertin, 2012).
The positive effect of selected inputs on onion production validates the production economic theory stating that the output increases with an increase in output (Debertin, 2012). Even though chemical fertilizers and pesticides are not significant, they affect onion production positively. The seeds and organic fertilizers are the most influential determinants of onion production, which means that farmers should mostly rely on these factors when they decide to increase the level of production.
Aristide Maniriho, Edouard Musabanganji and Philippe Lebailly / Montenegrin Journal of Economics, Vol. 16, No. 3 (2020), 185-196
194
The Lambda (
) is 0.012 with the p-value equals to 0.975; it is not significantly different from zero, which implies that the inefficiencies are caused by the factors beyond the farmer’s control (Batesse & Corra, 1977), such as the quality of seeds and chemical fertilizers, as well as climatic conditions. The Wald test showed that the selected variables are collectively statistically signifi-cant, thus the results from the estimated model are reliable for policy formulation. The sum of in-put coefficients of 1.03 (greater than 1) indicates that onion production scores the increasing re-turns to scale in the study area (Debertin, 2012).From the estimation of onion cost function, the results reveal that the total production cost in-creases with the increase in the onion output. This is backed by the production cost theory that shows the positive relationship between cost and output (Debertin, 2012) whenever the optimal level of output is not yet achieved.
There is no one variable that has the same sign and significant in the three efficiency estimat-ed models. The results reveal that the higher the technical efficiency index corresponds to lower age, which means that the technical efficiency is negatively correlated with the age, and this is contrasting Bravo-Ureta and Pinheiro’s (1997) finding. Age is positively correlated with AE and EE, but it only significant for AE. The education level and the household size affect positively and signif-icantly the level of technical efficiency. The positive effect of education on technical efficiency is in line with existing literature that proved positive association of formal education on efficiency (Phil-lips & Marble, 1986); education affects negatively the AE, but positively the EE.
The positive and significant effect of HSZE on TE suggests that family labour is optimally uti-lized, which is not the case for AE and EE. The variable EXT has negative effect on three efficiency indexes, but significant for TE and EE, which implies that the extension services have not yet reached the optimal level or these services do not meet the real needs of small-scale farmers in the study area. For policy considerations, only the technical efficiency model is reliable since the coefficient of determination (R-square) is greater than 0.2 as far as cross section data were used in this study (Wooldridge, 2016).
CONCLUSION AND POLICY RECOMMENDATIONS
The primary objective of this study was to ascertain the economic efficiency of input combina-tions among small-scale onion farmers in the Volcanic Highlands in Rwanda. As the components of economic efficiency, both the technical and allocative efficiencies have been calculated. Cobb-Douglas stochastic frontier production and cost functions were specified and estimated using the maximum likelihood method to derive the technical, allocative, and economic efficiency indexes. Besides, a simultaneous-equations model was specified and estimated using a seemingly-unrelated regression model to identify the sources of efficiencies.
The results revealed that seeds (p-value=0.000) and organic fertilizers (p-value=0.057) have been proven to be the only significant factors that impact positively on onion production. Even though other factors (chemical fertilizers and pesticides) are not significant, they also affect onion production positively. This means that the more the inputs, the higher the output. Lambda (
) is 0.012 and the corresponding p-value is 0.975, which shows that it is not significantly different from zero and means that onion producers are not able to control the sources of the inefficiencies. Wald chi2 test shows that the explanatory variables included in the stochastic frontier production model are statistically significant (Wald chi2=119.48, p-value=0.000), which proves that the esti-mated results are reliable for policy formulation. The sum of input coefficients of the estiesti-mated production function amounts to 1.03 that implies that onion production registers increasing re-turns to scale; this means that the output increases more quickly than the increase in the amounts of inputs used in the production process.Aristide Maniriho, Edouard Musabanganji and Philippe Lebailly / Montenegrin Journal of Economics, Vol. 16, No. 3 (2020), 185-196
195 Concerning the efficiency estimates, the results from the three estimated efficiency models pointed to negative relationship between the farmer’s age and technical efficiency, which implies that the higher level of technical efficiency index corresponds to the lower level of farmer’s age. Results also indicated that the household size affects positively and significantly the technical effi-ciency index, which leads to suggest that the family labour was used employed. The negative and significant correlation of the number of extension visits exhibits that the extension service has not enabled onion growers to reach the optimal utilisation of resources.
Based on the findings here above, more efforts should be spread to improve the allocation of inputs among small-scale onion producers. As far as the policy formulation is concerned, more effort should be oriented to education, professional trainings and redesign the extension services so as to boost the ability of farmers to use optimal use of available resources. Due to the limita-tions of cross sectional study such as the difficult to separate cause and effect and the cover of a very specific region, further research should proceed to cohort analysis and cover the whole coun-try.
ACKNOWLEDGEMENT
The authors recognize the funding from ARES.
REFERENCES
Battese, G.E., Corra, G.S. (1977), “Estimation of a production frontier model: with application to the Pastoral Zone and Eastern Australia”, Australian Journal of Agricultural Economics, Vol. 21, No. 3, pp. 169-179.
Bravo-Ureta, B.E., Pinheiro, A.E. (1997), “Technical, economic, and allocative efficiency in peasant farming: evidence from the Dominican Republic”, The Developing Economies, Vol. 35, No. 1, pp. 48-67.
Byiringiro, F., Reardon, T. (1996), “Farm productivity in Rwanda: effects of farm size, erosion, and soil conservation investments”, Agricultural Economics, Vol. 15, pp. 127-136.
Cheamuangphan, A., Wiboonpongse, A., Chaovanapoonphol, Y., Sriboonchitta, S. (2013), “Factors enhancing production efficiency of farmer households who are members of saving groups in Upper Northern Thailand”, The Empirical Econometrics and Quantitative Economics Letters, Vol. 2, No. 2, pp. 71-82.
Debertin, D.L. (2012), “Agricultural Production Economics”, Monographs Applied Economics, AgEcon Search, No. 158319, September.
Drysdale, P., Kalirajan, K.P., Zahao, S. (1995), “The impact of economic reform on production growth in Chinese agriculture”, American Journal of Agricultural Economics, Vol. 73, No. 2, pp. 266–275.
FAO (2016), “Food and agriculture key to achieving the 2030 agenda for sustainable develop-ment”, United Nations Food and Agriculture Organization (FAO), Rome.
Farrell, M.J. (1957), “The measurement of productive efficiency”, Journal of the Royal Statistical
Society Series A, Vol. 120, pp. 253-290.
Forrest Zang, Q, Donaldson, J. A. (2010), “From peasants to farmers: Peasant differentiation, labor regimes, and land-rights institutions in China’s agrarian transition”, Politics & Society, Vol. 38, No. 4, pp. 458-489.
Hafez, E., Geries, L. (2019), “Onion (Allium Cepa L.) Growth, Yield and Economic Return under Dif-ferent Combinations of Nitrogen Fertilizers and Agricultural Biostimulants”, Acta Scientific
Ag-riculture, Vol. 3, No. 4, pp. 259-269.
Kumbhakar, S.C., Wang, H., Horncastle, A.P. (2015), A practitioner's guide to stochastic frontier
Aristide Maniriho, Edouard Musabanganji and Philippe Lebailly / Montenegrin Journal of Economics, Vol. 16, No. 3 (2020), 185-196
196
Lovell, C.A.K. (1993), “Production frontiers and productive efficiency” in Fried, H.O., Schmidt, S.S., Lovel, C.A.K. (Eds.), The measurement of productive efficiency: techniques and applications, Oxford University Press, pp. 3-67.
Maniriho, A., Bizoza, A. (2015), “Analysis of Allocative Efficiency among Small Scale Farmers in Musanze District, Northern Rwanda”, European Journal of Academic Essays, Vol. 2, No. 2, pp. 57-64.
Mburu, S., Akello-Ogutu, C., Mulwa, R. (2014), “Analysis of economic efficiency and farm size: A case study of wheat farmers in Nakuru District, Kenya”, Economics Research International, Vol. 2014, 1-11.
Meeusen, W., van den Broeck, J. (1977), “Efficiency Estimation from Cobb-Douglas Production Functions with Composed Error”, International Economic Review, Vol. 18, No. 2, pp. 435– 444.
MINAGRI (2017), National Agriculture Policy, June 2017, Ministry of Agriculture and Animal Re-sources (MINAGRI), Kigali, Rwanda.
Mugabo. J., Tollens, E., Chiamu, J., Obi, A., Vanlauwe, B. (2014), “Resource use efficiency in soy-bean production in Rwanda”, Journal of Economics and Sustainable Development, Vol. 5, No. 6, pp. 116-122.
Mulinga, N. (2013), “Economic Analysis of Factors Affecting Technical Efficiency of Smallholders Maize Production on Rwanda”, Rwanda Journal, Vol. 1, No. 1, pp. 52-62.
NISR & NBR (2013), “Gross Domestic Product by Kind of Activity at constant 2006 prices Fiscal year 2012-2013”, National Institute of Statistics of Rwanda (NISR) and National Bank of Rwanda (NBR), Kigali, Rwanda, http://www.bnr.rw/index.php?id=171&tx_damfrontend _pi1[pointer]=1#test, accessed on October 28, 2013 at 4.17 pm.
NISR (2012), The Third Integrated Household Living Conditions Survey (EICV3). Main Indicator
Report, National Institute of Statistics of Rwanda (NISR), Kigali, Rwanda.
Phillips, J.M., Marble, R.P. (1986), “Farmer education and efficiency: a frontier production function approach”, Economics of Education Review, Vol. 5, No. 3, pp. 257-264.
Purseglove, J.W. (2000), Tropical Crop Monocotyledons, Longman Group Limited, London.
Republic of Rwanda (2013), Economic development and poverty reduction strategy 2013 – 2018:
Shaping our development, Ministry of Finance and Economic Planning, Kigali, Rwanda.
Todaro, M.P., Smith, S.C. (2012), Economic Development, Addison-Wesley, Boston.
Wooldridge, J.M. (2016), Introductory econometrics: A modern approach, South-Western Cengage Learning, Mason, US.