Université du Québec
INRS-ETE
SIGNATURE ISOTOPIQUE DU PLOMB POUR LE MARQUAGE
DE LA CONTAMINATION DES SOLS
À
PROXIMITÉ D'UNE
FONDERIE DE MÉTAUX, NORD-OUEST DU QUÉBEC, CANADA
Par
Xiaohong Hou
Mémoire présenté
pour l'obtention du grade de Maître ès sciences (M.Sc.) en Sciences de la Terre
Jury d'évaluation
Président du jury et examinateur interne
Examinateur externe
Directeur de recherche
Codirecteur (trice) de recherche
Charles Gobeil, Ph.D. INRS-ETE Richard Carignan, Ph.D. Université de Montréal Michel Parent, Ph.D. Commission géologique du Canada Martine M. Savard, Ph.D. Commission géologique du Canada Normand Tassé, Ph.D. INRS-ETE
Abstract
The Rouyn-Noranda region is one in which numerous mining and smelting activities have taken place since the opening of the Home mine in 1922 and the construction of the Home smelter in December 1927. Before the program "Rouyn-Noranda Ville En Santé" was launched in 1987, the mining and smelting community had eamed a reputation as the most polluted city in Canada because of serious environmental problems such as sulfur dioxide plumes, heavy metal fallout as well as acid rain. This project is part of the Metals in the environment (MITE) program of the Geological Survey of Canada. The major objectives of this project are: '1) to determine the extent of Pb contamination of soils exposed to Home smelter emissions; 2) to distinguish the source of anthropogenic lead in soils using stable Pb isotope ratios; and 3) to estimate the downward migration of Pb in representative mesic soils.
Seventy five (75) samples were collected from podzolic soil profiles at eight (8) sites, six (6) of which lie along a northeast-southwest transect crossing Rouyn-Noranda, northwestem Quebec, while the other two (2) are from Grande Rivière de la Baleine region, approximately 800 km north of Rouyn-Noranda. Pb concentrations and Pb isotopic compositions were determined on the fine-grained fraction of soil samples leached by three extraction methods ofincreasing agressivity: (1) Mehlich-III, (2) 0.25 M HCI, and (3) total digestion by an acid mixture of HF, HN03, HCI, and HCI04•
Pb is enriched in the surface orgamc horizons at all sites in Rouyn-Noranda. Its concentration decreases by two orders of magnitude from the surface organic horizons to the underlying mineraI horizons. Pb isotope ratios are low in surface organic horizons, and they increase sharply in the mineraI horizons. Along the NE-SW transect, average Pb concentration is as high as 869 ppm in organic horizons at site 1, c10sest to the smelter. It decreases exponentially with increasing distance from the smelter, reaching a value of 39 ppm at site 10, 116 km northeast of the Home smelter. The lowest average 206PbPo7Pb
the highest Pb concentration of 1414 ppm is also accompanied by the lowest 206Pbp07Pb ratio (0.98), which is close to the isotopie composition of Noranda galena
e
06PbP07Pb = 0.92). Both Pb concentrations and isotopie compositions indicate that the Horne smelter is the main source of Pb contamination of soils in the Rouyn-Noranda region. Canadian anthropogenic emissions are also known to contribute modestly to the overall lead levels in soils of the Rouyn-Noranda region, but this contribution cannot be established quantitatively. Two soil profiles from Grande-Baleine display different trend of Pb concentration and isotope ratios with depth. Based on Pb concentration and isotopie composition in the Rouyn-Noranda soil profiles, it is estimated that anthropogenic lead has migrated downward to a depth of ~ 1 0-30 cm, which yields a mobility of ~ 1-4 mm/a.;hGl(~r
Acknowledgements
First of aIl, 1 would like to express my sincere gratitude and appreciation to my research director, Prof essor Michel Parent, for his excellent supervision and constant encouragement and support through the whole research project. 1 would also like to give my thanks to my co-directors Martine M. Savard and Normand Tassé for their excellent supervision and for valuable discussions throughout the project.
1 would also like to thank Réàl Gosselin, Isabelle Bélanger and André Hébert, aIl staff members of the Geochemistry Laboratory at INRS-Géoressources, for their technical support and valuable suggestions during various stages of the experimental work. 1 am also grateful to Professor Marc Richer-La Flèche, INRS-Géoressources, for his valuable suggestions during the laboratory work. 1 want also give my thanks to J. Marion and C. Begin for their support in the field.
Special thanks to my husband Dijiang for his discussion through the whole research project. 1 would like also give my thanks to my son, Eric, for ms cooperation during my laboratory work as weIl as during thesis writing.
Financial support for this study was provided by the INRS-Géoressources scholarship fund and by MITE program (Metals ln The Environment) of the Geological Survey of
Canada (Dinamite, #960002).
Table of Contents
Abstract ... i
Acknowledgements ... iii
List of figures ... vi
List of tables and photos ... vii
Résumé étendu ... viii
Introduction ... 1
1. Pb contamination of the environment ... 1
2. Previous work in the study area ... 3
3. Objectives ofthis project ... .4
4. The structure of the thesis ... 5
Chapter 1 The presence of Pb in the environment ... 6
1. Sources of Pb in the environment ... 6
2. Speciation of Pb in the environment ... 6
3. Pb concentrations in the environment.. ... 7
4. The health effect of Pb ... 8
Chapter 2 Sources of Pb in soils ... 9
1. Sources of Pb in the atmosphere ... 9
1.1 Mining and smelting industry ... 9
1.2 Gasoline combustion ... 1 0 2. Sources of Pb in soils ... 12
2.1 Parentrocks ... 12
2.1.1 Background levels of Pb in rocks ... 12
2.1.2 Natural contents of Pb in soils ... 13
2.2 Atmospheric deposition of airborne lead ... : ... 13
2.3 Sewage sludge disposaI ... 14
Chapter 3 Environmental fate of Pb in soils ... 16
1. Chemical behaviour of Pb in soils ... 16
1.1 The adsorption of metal ions and their constituents ... 16
1.1.2 Specifie adsorption ... 18
1.2 Precipitation and co-precipitation ... 18
1.3 Organic complexation ... .20
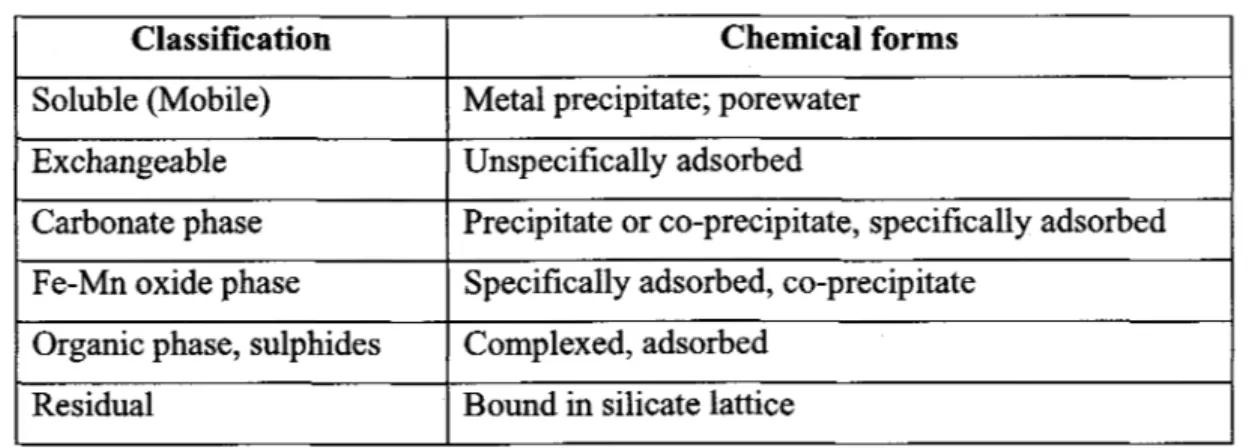
2. Chemical forms of Pb in soils ... .21
3. Pb isotope geochemistry ... 21
Chapter 4 Study area and methodology ... .24
1. Background ... 24
2. Soil sampling and sample preparation ... ;. ... .27
3. Experiment procedures ... 30
4. Sample analysis ... 32
Chapter 5 Results and discussion ... 34
1. Pb concentrations and isotopie compositions in exchangeable fraction ... 34
2. Partial digestion vs total digestion ... .34
3. Lead concentrations and isotopie compositions in dilute acid leachates ... .44
3.1 Rouyn-Noranda region ... .44
3.2 Grande-Baleine region ... .48
4. Estimation of smelter contribution to Pb in soils ... .49
5. Pb migration in soils ... 53
Conclusion ... 54
List of references ... 55
List of figures
Fig. 4-1 Simplified location map showing the sampling sites in the study area
as well as the control sites ... .25 Fig. 4-2 Ferrohumic and humoferric podzols developed on unreworked matrix
dominated till ... 28 Fig. 5-1 Pb concentration profiles for soil sites in the Rouyn-Noranda and
Grande-Baleine regions ... 40 Fig. 5-2 206PbP07Pb profiles for soil sites in the Rouyn-Noranda and
Grande-Baleine regions ... 41 Fig. 5-3 Plot of average Pb concentration and isotope ratios in surface organic
horizons as a function of distance from the Horne smelter ... .46 Fig. 5-4 Plot of 206PbPo7Pb versus 206PbP08Pb for all the soil samples digested
by 0.25 M HCI showing an influence ofless radiogenic Pb input into soils ... .47 Fig. 5-5 Plot of206PbPo7Pb ratio against Pb concentration for all soil samples
extracted by 0.25 M HClleaching ... .48 Fig. 5-6 206PbP07Pb profiles of all sites as a function of relative distance from
smelter for three extracting methods ... 51 Fig. 5-7 Contributions of smelter emissions to the anthropogenic Pb in soils in
List of tables
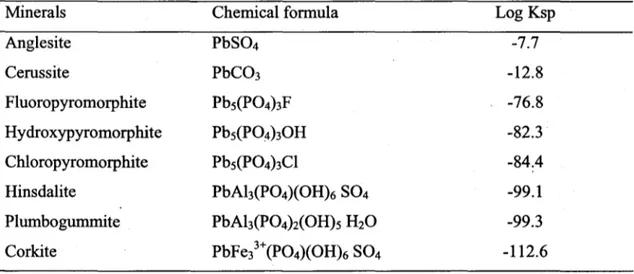
Table 2-1 Lead concentrations in representative rock types ... 12 Table 3-1 Cation exchange capacity of sorne clay minerals ... l7 Table 3-2 Solubility products (log Ksp) at 25 oC of representative lead mineraIs ... 19 Table 3-3 Coprecipitated trace metals in secondary soil minerals ... .20 Table 3-4 Chemical forms of Pb in soils ... 21
..
Table 3-5 Abundances, half-lives, and decay constants of the principal naturallyoccurring isotopes of uranium and thorium ... 22 Table 4-1 A brief description ofpodzolic soil profiles ... .29 Table 5-1 Pb concentrations and isotopie compositions determined on M-III extracting
method, 0.25 M HClleaching and total extraction for all samples from
Rouyn-Noranda and Grande-Baleine ... 35 Table 5-2 Pb concentrations and isotopie compositions determined on total
extraction for granule samples (2-4 mm fraction) ... 39
List of photos
Photo 4-1 Tree mortality and soil erosion near Rouyn-Noranda ... .26 Photo 4-2 Tree mortality and soil erosion near Rouyn-Noranda ... .26
Résumé étendu
1. Problématique
La région de Rouyn-Noranda a été le siège de nombreuses activités d'extraction et d'affinage de métaux depuis l'ouverture de la mine Home en 1922 et l'entrée en fonction de la fonderie Home en 1927. Avant que le programme de "Rouyn-Noranda Ville en santé" n'ait été lancé en 1987, cette communauté minière avait acquis la réputation de ville la plus polluée au Canada en raison des sérieux problèmes environnementaux tels que des nuages d'anhydride sulfureux, des pluies acides et des retombées de métaux lourds. La construction de la fonderie Home avait eu comme conséquence le rejet de grandes quantités de métaux lourds, tels le plomb, le zinc, le cadmium et le cuivre, dans l'environnement. Les émissions cumulées des métaux lourds de 1965 à 1998 étaient de 40 102 tonnes pour le Pb, de 38 236 tonnes pour le Zn, et de 5 080 tonnes pour le Cu. L'émission annuelle de ces métaux a atteint 2400 tonnes pour le Pb pour la seule année 1972 et 3 100 tonnes dans le cas du Zn en 1971. Ce n'est qu'après 1987 qu'un effort a été déployé dans le but de réduire de façon importante les émissions de métaux lourds et de gaz provenant de la fonderie Home et d'améliorer la qualité de l'air dans la ville et ses environs.
Les effets sur l'environnement des émissions de métaux sont évidents autour de la région de Rouyn-Noranda. Aux abords immédiats de la fonderie, on peut clairement observer les dommages à la végétation tels des arbres morts, une diversité biologique réduite, une croissance végétale réduite et l'érosion du sol. Toutefois près de notre site 1, environ 8.7 kilomètres au nord-est de la fonderie Home, il n'y a pas de dommages évidents à la végétation.
Plusieurs projets de recherche concernant les problèmes environnementaux causés par les émissions de la fonderie Home ont été conduits jusqu'à présent. Les investigations effectuées par Dumontet et al. (1990) indiquent qu'il y a enrichissement en métaux
lourds (Pb, Zn, Cd, Cu, etc.) au sommet des sols tourbeux à un site près de la fonderie Home et que les concentrations diminuent graduellement avec l'augmentation de la distance de la fonderie. Carignan et Gariépy (1995) ont étudié la concentration en Pb et les rapports 206PbPo7Pb dans les lichens de la région de Rouyn-Noranda et de la vallée du Saint-Laurent, et ont constaté que les concentrations en Pb sont les plus élevées dans les échantillons de lichens recueillis à proximité de la fonderie et qu'elles diminuent progressivement avec la distance de la fonderie. Alors que les rapports 206PbPo7Pb covarient inversement avec les concentrations en Pb, les rapports 206PbPo7Pb les plus bas
,.
(1,046) observés au site près de la fonderie sont très proches de celui de la galène de Noranda et dans la plage des valeurs des sulfures de l'Abitibi. En utilisant les rapports 206PbPo7Pb, Carignan et Gariépy (1995) ont pu calculer que les émissions de la fonderie Home représentent 50-90% du Pb atmosphérique au site le. plus proche de Rouyn-Noranda. Dans la vallée du Saint- Laurent, loin de Rouyn-Noranda, c'est un mélange de sources anthropiques canadiennes et américaines qui domine. Simonetti et al. (2000) ont étudié les rapports 2°6pbPo7Pb dans les accumulations neigeuses au Québec. Ils ont conclu que la pollution atmosphérique dans la région de Québec-Montréal est dominée par un mélange d'émissions anthropiques américaines et canadiennes. Les investigations dendrogéochimiques réalisées par Savard et al. (1999) ont démontré que l'effet des émissions atmosphériques de la fonderie Home peut être détecté à plus de 40 km en utilisant le signal de l'isotope stable de carbone (8 13C) et de nutriments (Ca) dans les épinettes noires. Dans l'étude de géochimie isotopique des cernes de croissance par Savard et al. (accepté), une diminution significative des rapports 206PbPo7Pb et une augmentation concomittante des concentrations en Pb sont observées à un site d'essai 9 km auNE de la fonderie, environ 14 ans après la mise en service de la fonderie, par rapport aux isotopes de l'H et du C qui ont enregistré les changements immédiatement après la mise en service. Le sol, à titre de principal puits des métaux lourds dans l'environnement, joue un rôle important dans le cycle global des métaux. Est-il possible de caractériser les profils de sol typiquement affectés par la contamination atmosphérique issue des émissions de la fonderie et détecter l'effet de la distance des émissions sur ces profils de sol en utilisant les méthodes géochimiques?
2. Objectifs
Bien que plusieurs investigations sur la pollution par les métaux lourds dans différents média aient été réalisées dans la région, aucune recherche approfondie sur les sols exposés aux émissions de la fonderie Home n'a été effectuée à notre connaissance dans le but de caractériser les profils de sol exposés et de retracer les sources du plomb anthropique dans les sols aux environs de Rouyn-Noranda. Dans ce projet, les concentrations en Pb observées dans différentes fractions dans des profils de sol situés le long d'un transect nord-est-sud-ouest traversant la fonderie Home et au site de contrôle ont été déterminées dans le but d'examiner l'effet de la fonderie sur la distribution des métaux lourds dans les sols. En même temps, la composition isotopique du plomb a été examinée pour retracer l'origine du plomb dans les sols podzoliques de la région de Rouyn-Noranda. Les objectifs de cette étude sont donc les suivants:
1) déterminer l'ampleur de la contamination en Pb des sols exposés aux émissions de la fonderie Home;
2) identifier la ou les sources du plomb d'origine anthropique dans les sols; 3) estimer la migration du Pb vers le bas des profils dans des sols mésiques
représentatifs.
3. Méthodologie
3.1 Échantillonnage des sols
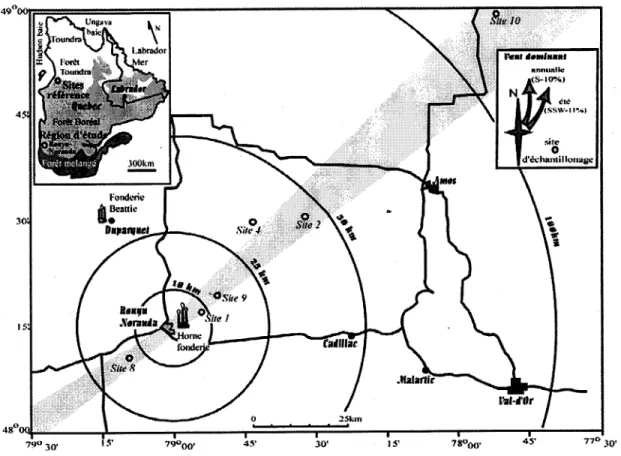
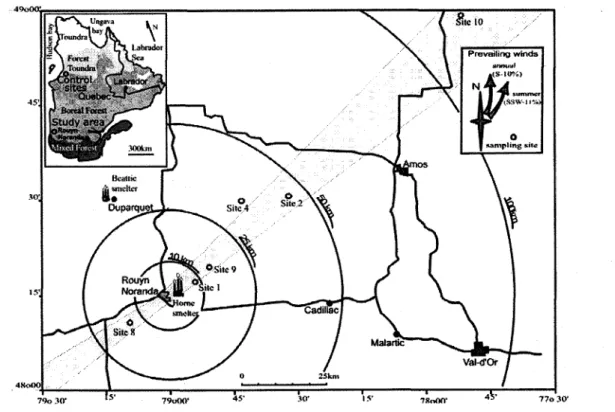
La région d'étude est celle de Rouyn-Noranda, dans le nord-ouest du Québec (Fig. 1). Une série de 75 échantillons ont été recueillis dans des profils de sols podzoliques à huit sites, dont six se trouvent le long d'un transe ct nord-est-sud-ouest au droit de la fonderie Home alors que les deux autres proviennent de la région de la Grande rivière de la Baleine, environ 800 km au nord de Rouyn-Noranda (Fig. 1). Le substrat de tous les sites était constitué de podzols dérivés de till, une combinaison typique de l'écozone de la forêt
Fig. 1 Carte simplifiée montrant la localisation des sites échantillonnés dans la région d'étude et celles des sites de contrôle.
boréale. Les échantillons de sols ont été prélevés en creusant des tranchées d'environ 60x40 cm à l'aide d'une pelle d'acier. Chaque site comprend de 7 à 12 échantillons de sols, avec au moins un échantillon prélevé de chacun des horizons. Les échantillons recueillis ont été placés dans des sacs de plastique numérotés. Tous les échantillons ont été séchés à l'air ambiant. Les racines vivantes et le matériel ligneux mort ont été retirés manuellement des échantillons. Les échantillons organiques séchés ont été broyés dans un mortier de porcelaine en utilisant de l'azote liquide, et puis ont été passés dans un tamis de 0.5 mm. Les échantillons minéraux ont été tamisés directement à 0.063 mm. Les poudres ont été entreposées dans des fioles de plastique étiquetées pour usage postérieur. Huit échantillons de granules (fraction de 2-4 millimètres) ont été également broyés avant
d'être soumis pour l'analyse des concentrations totales et des compositions isotopiques du Pb.
3.2 Analyse des échantillons en laboratoire
Les concentrations en Pb et la composition isotopique du Pb ont été déterminées sur la fraction fine des échantillons de sol lixiviés à l'aide de trois méthodes d'extraction de force croissante: (1) la méthode Mehlich-III pour l'extraction des métaux échangeables, (2) extraction partielle de 0.25 M HCl pour la fraction extractible des métaux, et (3) digestion totale par un mélange d'acides concentrés (HF, HN03, HCl et HCl04). Une
partie aliquote des solutions de chacune des méthodes d'extraction a été analysée pour les concentrations en Pb et sa composition isotopique par la spectrométrie de masse couplée à une torche au plasma (lCP-MS). Pour les corrections de masse, la norme NIST 981 a été mesurée après chaque série de 10 échantillons, ce qui résulte en des incertitudes respectives de 0.014 et de 0.004 (20') pour les rapports 2°6pbPo7Pb et 206pbPo8Pb.
4. Résultats et discussion
4.1 Concentrations en plomb et composition isotopique de la fraction échangeable
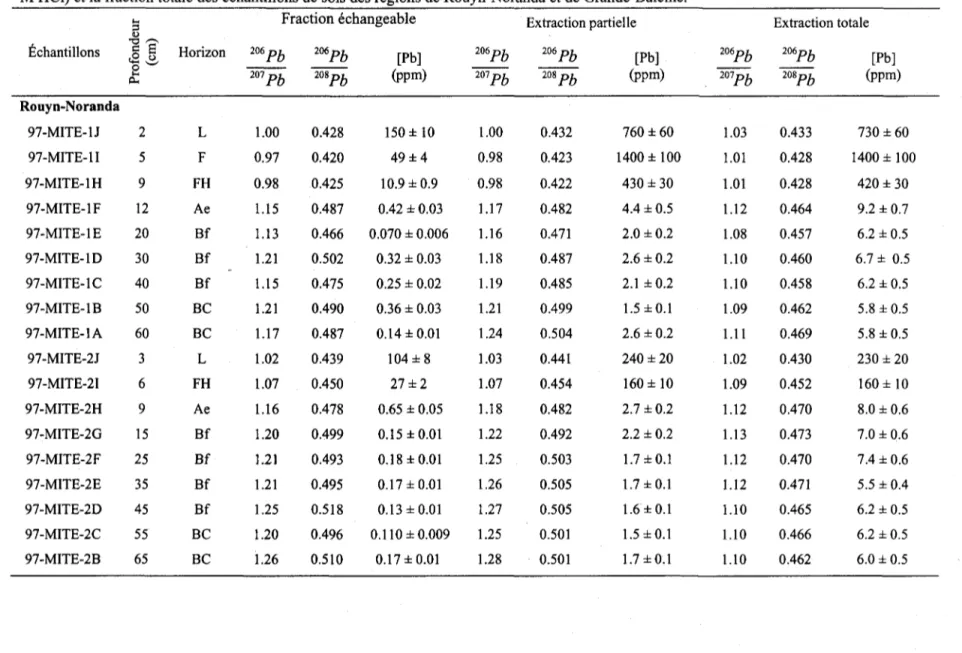
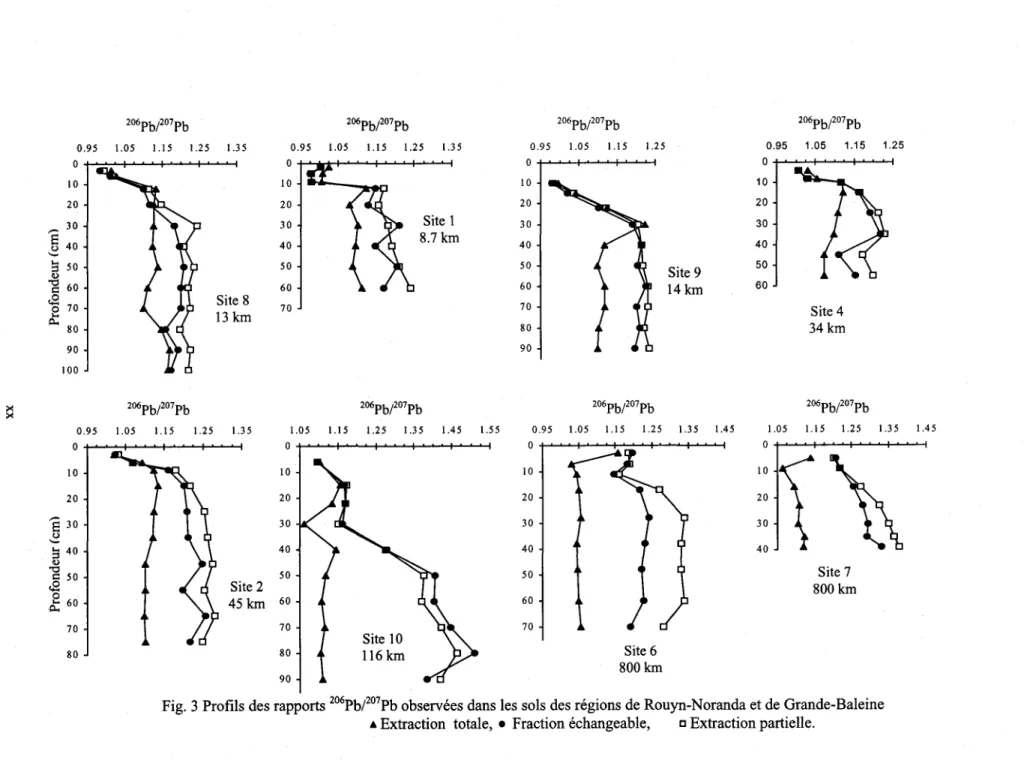
Les résultats des concentrations en Pb et des rapports 2°6pbPo7Pb sont présentés aux tableaux .let 2. Les profils des concentrations en Pb sont présentés à la figure 2. Les concentrations en Pb dans la· fraction échangeable sont de beaucoup inférieures à celles observées dans les extractions partielles et totales (Tableau 1). Elles constituent respectivement de 2.6% à 47% du plomb total dans les échantillons organiques et 0.3% à -4.6% dans les échantillons minéraux. Le pourcentage plus élevé de plomb échangeable dans les échantillons organiques par rapport aux échantillons minéraux suggère que le plomb présent dans les horizons organiques est plus mobile que celui des horizons minéraux sous-jacents, dans lesquels le Pb est principalement associé aux matériaux parentaux. Les rapports isotopiques du Pb dans les échantillons organiques provenant de la fraction échangeable sont proches de ceux obtenus par extraction partielle (Fig. 3).
Ceci implique que le Pb dans les échantillons orgamques est principalement dérivé d'apports atmosphériques, avec des rapports 206PbPo7Pb caractéristiquement plus faibles. Dans le cas des échantillons minéraux, on peut observer un décalage systématique vers des rapports 206PbPo7Pb plus faibles dans la fraction échangeable du Pb, ce qui suggère que la fraction échangeable est de nature différente de celle extraite par lixiviation acide faible.
4.2 Digestion partielle vs digestion totale
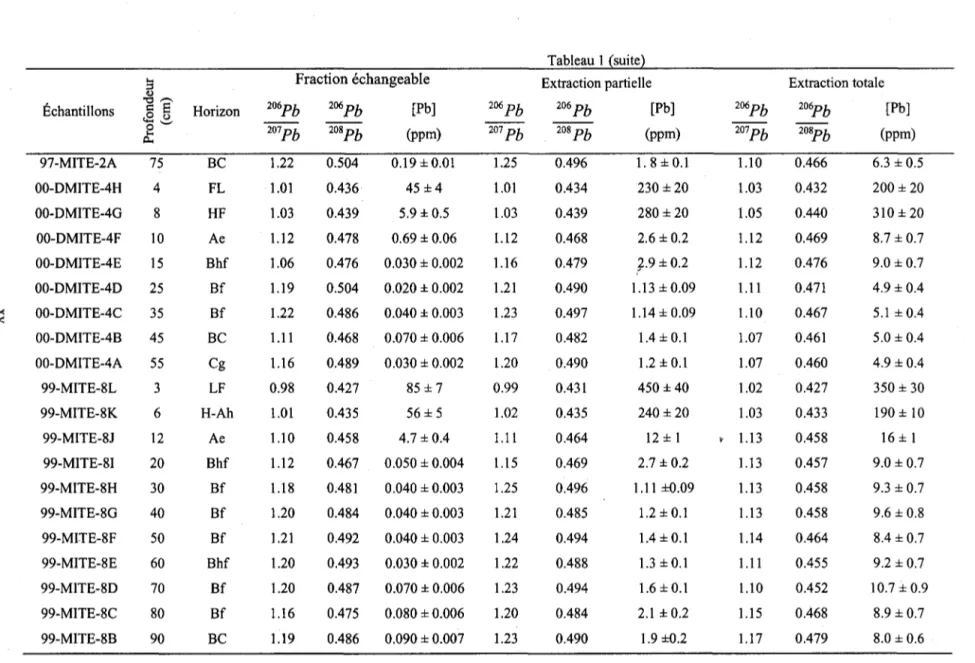
Les profils de concentration en Pb et de rapports 206PbPo7Pb dans les fractions partielles et totales ont des tendances semblables, quoiqu'ils affichent des amplitudes différentes (Fig. 2 et 3). Pour les échantillons minéraux, les concentrations totales en Pb sont systématiquement plus élevées que celles des extractions partielles, mais ce n'est pas le cas pour les échantillons organiques. Les concentrations partielles plus élevées en Pb dans certains échantillons organiques résultent probablement d'une moindre homogénéisation des échantillons organiques (fraction < 500 um) ou encore des différences de poids des échantillons utilisés pour les extractions partielles (100 mg) et totales (500 mg). Les niveaux plus élevés en Pb dans les extractions faibles (0.25 M HCI) suggèrent également que le Pb d'origine anthropique est en grande partie retenu dans les horizons organiques de surface et qu'il est facilement libéré par lessivage acide faible. Les rapports isotopiques dans la digestion totale sont plus élevés que dans les extractions partielles (HCI) pour la plupart des échantillons organiques provenant de la région de Rouyn-Noranda. Par contre, dans les horizons minéraux, il y a décalage systématique vers des valeurs plus faibles. Cela contraste avec d'autres études dans lesquelles les extractions partielles sont toujours moins radiogéniques que les digestions totales, mais cela est concordant avec les résultats d'études de sédiments de ruisseau aux USA par Gulson et al. (1992) et Church et al. (1993). L'explication pour les valeurs plus élevées des rapports isotopiques dans les extractions partielles d'échantillons minéraux est que l'altération des silicates libérant le Pb radiogénique des minéraux riches en U et Th laisse la partie résiduelle avec des rapports isotopiques inférieurs. Ceci est en accord avec nos travaux
Tableau 1. Concentrations et compositions isotopiques du Pb mesurées dans la fraction échangeable (Mehlich-I1I), la fraction extractible (0.25 M HCI) et la fraction totale des échantillons de sols des régions de Rouyn-Noranda et de Grande-Baleine.
...
Fraction échangeable Extraction partielle Extraction totaleg Échantillons "0 ,-... c El Horizon 206Pb 206Pb [Pb] 206Pb 206Pb [Pb] 206Pb 206Pb [Pb] <2 <.> 0 ' - ' 207 Pb (ppm) (ppm) (ppm)
...
208Pb 207Pb 208 Pb 207Pb 208Pb ~ Rouyn-Noranda 97-MITE-1J 2 L 1.00 0.428 150 ± 10 1.00 0.432 760 ± 60 1.03 0.433 730 ± 60 97-MITE-II 5 F 0.97 0.420 49±4 0.98 0.423 1400 ± 100 1.01 0.428 1400 ± 100 97-MITE-lH 9 FH 0.98 0.425 10.9 ± 0.9 0.98 0.422 430 ± 30 1.01 0.428 420 ± 30 97-MITE-IF 12 Ae 1.15 0.487 0.42 ± 0.03 1.17 0.482 4.4 ± 0.5 1.12 0.464 9.2 ± 0.7 97-MITE-IE 20 Bf l.l3 0.466 0.070 ± 0.006 1.16 0.471 2.0 ±0.2 1.08 0.457 6.2 ± 0.5 :><<'
97-MITE-lD 30 Bf 1.21 0.502 0.32 ± 0.03 1.18 0.487 2.6 ±0.2 l.l0 0.460 6.7 ± 0.5 97-MITE-IC 40 Bf 1.15 0.475 0.25 ± 0.02 l.l9 0.485 2.l ± 0.2 1.10 0.458 6.2 ± 0.5 97-MITE-lB 50 BC 1.21 0.490 0.36 ± 0.03 1.21 0.499 1.5 ± O.l 1.09 0.462 5.8 ± 0.5 97-MITE-IA 60 BC 1.17 0.487 0.l4 ± 0.01 1.24 0.504 2.6 ±0.2 1.11 0.469 5.8 ± 0.5 97-MITE-2J 3 L 1.02 0.439 104 ±8 1.03 0.441 240 ± 20 1.02 0.430 230 ± 20 97-MITE-21 6 FH 1.07 0.450 27±2 1.07 0.454 160 ± 10 1.09 0.452 160 ± 10 97-MITE-2H 9 Ae 1.16 0.478 0.65 ± 0.05 1.18 0.482 2.7 ±0.2 1.12 0.470 8.0±0.6 97-MITE-2G 15 Bf 1.20 0.499 0.l5 ± 0.01 1.22 0.492 2.2 ± 0.2 1.13 0.473 7.0 ± 0.6 97-MITE-2F 25 Bf 1.21 0.493 0.l8 ± 0.01 1.25 0.503 1.7 ± O.l 1.12 0.470 7.4 ± 0.6 97-MITE-2E 35 Bf 1.21 0.495 0.l7 ± 0.01 1.26 0.505 1.7 ± O.l 1.12 0.471 5.5 ± 0.4 97-MITE-2D 45 Bf 1.25 0.518 0.l3 ± 0.01 1.27 0.505 1.6±0.l 1.10 0.465 6.2 ± 0.5 97-MITE-2C 55 BC 1.20 0.496 0.110 ± 0.009 1.25 0.501 1.5 ± O.l 1.10 0.466 6.2 ± 0.5 97-MITE-2B 65 BC 1.26 0.510 0.l7 ± 0.01 1.28 0.501 1.7 ± O.l 1.10 0.462 6.0 ± 0.5Tableau 1 {suite}
~ Fraction échangeable Extraction partielle Extraction totale
<3)
Échantillons "0 "'"' I:l S Horizon 206Pb 206Pb [Pb] 206 Pb 206 Pb [Pb] 206Pb 206Pb [Pb] c.E u 0 ' - ' 207Pb 208Pb (ppm) 207 Pb 208 Pb (ppm) 207Pb 208Pb (ppm) .... c.. 97-MITE-2A 75 BC 1.22 0.504 0.19 ± 0.01 1.25 0.496 1. 8 ± 0.1 1.10 0.466 6.3 ± 0.5 00-DMITE-4H 4 FL 1.01 0.436 45 ±4 1.01 0.434 230 ± 20 1.03 0.432 200 ± 20 00-DMITE-4G 8 HF 1.03 0.439 5.9 ±0.5 1.03 0.439 280 ± 20 1.05 0.440 310 ± 20 00-DMITE-4F 10 Ae 1.12 0.478 0.69 ± 0.06 1.12 0.468 2.6 ±0.2 1.12 0.469 8.7 ± 0.7 00-DMITE-4E 15 Bhf 1.06 0.476 0.030 ± 0.002 1.16 0.479 7.9 ±0.2 1.12 0.476 9.0 ±0.7 00-DMITE-4D 25 Bf 1.19 0.504 0.020 ± 0.002 1.21 0.490 1.13 ± 0.09 1.11 0.471 4.9 ± 0.4 >< 00-DMITE-4C 35 Bf 1.22 0.486 0.040 ± 0.003 1.23 0.497 1.14 ± 0.09 1.10 0.467 5.1 ± 0.4 < 00-DMITE-4B 45 BC 1.11 0.468 0.070 ± 0.006 1.17 0.482 1.4 ± 0.1 1.07 0.461 5.0 ± 0.4 00-DMITE-4A 55 Cg 1.16 0.489 0.030 ± 0.002 1.20 0.490 1.2 ± 0.1 1.07 0.460 4.9 ± 0.4 99-MITE-8L 3 LF 0.98 0.427 85 ±7 0.99 0.431 450 ± 40 1.02 0.427 350 ± 30 99-MITE-8K 6 H-Ah 1.01 0.435 56 ± 5 1.02 0.435 240 ± 20 1.03 0.433 190 ± 10 99-MITE-8J 12 Ae 1.10 0.458 4.7 ± 0.4 1.11 0.464 12 ± 1 \' 1.13 0.458 16 ± 1 99-MITE-8I 20 Bhf 1.12 0.467 0.050 ± 0.004 1.15 0.469 2.7 ±0.2 1.13 0.457 9.0 ± 0.7 99-MITE-8H 30 Bf 1.18 0.481 0.040 ± 0.003 1.25 0.496 1.11 ±0.09 1.13 0.458 9.3 ± 0.7 99-MITE-8G 40 Bf 1.20 0.484 0.040 ± 0.003 1.21 0.485 1.2 ± 0.1 1.13 0.458 9.6 ± 0.8 99-MITE-8F 50 Bf 1.21 0.492 0.040 ± 0.003 1.24 0.494 1.4 ± 0.1 1.14 0.464 8.4 ± 0.7 99-MITE-8E 60 Bhf 1.20 0.493 0.030 ± 0.002 1.22 0.488 1.3 ± 0.1 1.11 0.455 9.2 ±0.7 99-MITE-8D 70 Bf 1.20 0.487 0.070 ± 0.006 1.23 0.494 1.6 ± 0.1 1.10 0.452 10.7 ± 0.9 99-MITE-8C 80 Bf 1.16 0.475 0.080 ± 0.006 1.20 0.484 2.1 ± 0.2 1.15 0.468 8.9 ±0.7 99-MITE-8B 90 BC 1.19 0.486 0.090 ± 0.007 1.23 0.490 1.9 ±0.2 1.17 0.479 8.0 ± 0.6
Tableau 1 (suite)
!3 Fraction échangeable Extraction partielle Extraction totale
QJ Échantillons
'"
s:: ,-.,S
Horizon 206Pb 206Pb [Pb] 206 Pb 206 Pb [Pb] 206Pb 206Pb [Pb] <S () 0 ' - ' 207Pb 208Pb (ppm) 207 Pb 208 Pb (ppm) 207Pb 208Pb (ppm) .... ~ 99-MITE-8A 100 C 1.17 0.475 0.070 ± 0.006 1.22 0.486 1.8 ± 0.1 1.16 0.478 6.8 ± 0.5 99-MITE-9J 10 F 0.98 0.425 28±2 0.98 0.426 750 ± 60 1.00 0.422 550 ± 40 99-MITE-9I 15 H-Ah 1.02 0.437 23 ±2 1.04 0.443 58 ± 5 1.04 0.435 57 ± 5 99-MITE-9H 22 Ae 1.10 0.458 1.5 ± 0.1 1.12 0.465 4.2 ±0.3 1.12 0.461 9.0 ± 0.7 99-MITE-9G 30 Bhf 1.19 0.472 0.3 ± 0.03 1.20 0.475 3.6 ± 0.3 1.22 0.499 9.1 ± 0.7 :x 99-MITE-9F 40 Bf 1.21 0.480 0.16 ± 0.01 1.22 0.487 2.4 ± 0.2 1.12 0.462 7.8 ±0.6 :S. 99-MITE-9E 50 Bf 1.20 0.478 0.13 ± 0.01 1.22 0.489 2.2 ±0.2 1.10 0.457 7.6 ±0.6 99-MITE-9D 60 Bf 1.23 0.486 0.16 ± 0.01 1.23 0.493 2.5 ±0.2 1.12 0.461 8.6 ± 0.7 99-MITE-9C 70 BC 1.20 0.477 0.17 ± 0.01 1.23 0.488 2.6 ±0.2 1.12 0.460 8.7 ±0.7 99-MITE-9B 80 C 1.21 0.479 0.21 ± 0.02 1.22 0.488 2.2 ± 0.2 1.10 0.456 8.3 ±0.7 99-MITE-9A 90 C 1.20 0.480 0.20 ± 0.02 1.23 0.492 1.9 ± 0.2 1.10 0.454 8.1 ± 0.6 99-MITE-1 OJ 6 LF 1.10 0.462 3.2 ± 0.3 1.10 0.464 74±6 1.10 0.453 73 ± 6 99-MITE-lOI 15 FH 1.17 0.482 6.3 ± 0.5 1.17 0.488 25 ±2 1.16 0.469 21 ± 2 99-MITE-IOH 22 H 1.17 0.479 2.2 ±0.2 1.17 0.484 18 ± 1 1.14 0.464 20 ± 2 99-MITE-IOG 30 Ae 1.16 0.482 0.4 ± 0.3 1.15 0.476 0.96 ± 0.07 1.06 0.452 8.4 ± 0.7 99-MITE-10F 40 Bhf 1.28 0.508 0.100 ± 0.008 1.28 0.513 2.8 ± 0.2 1.15 0.471 10.1 ± 0.8 99-MITE-10E 50 Bf 1.05 0.547 0.070 ± 0.006 1.38 0.537 1.8 ± 01 1.12 0.469 8.4 ± 0.7 99-MITE-IOD 60 Bf 1.40 0.539 0.080 ± 0.006 1.37 0.541 1.7 ± 0.1 1.11 0.458 9.0 ± 0.7 99-MITE-I0C 70 BC 1.40 0.539 0.100 ± 0.008 1.42 0.549 1.6 ± 0.1 1.12 0.461 8.8 ± 0.7 99-MITE-I0B 80 C 1.51 0.577 0.090 ± 0.007 1.46 0.577 1.4 ± 0.1 1.11 0.460 8.2 ± 0.7Tableau 1 (suite)
S Fraction échangeable Extraction partielle Extraction totale
<Ll Échantillons ~,.-... 206Pb 206Pb [Pb] 206Pb 206Pb [Pb] 206Pb 206Pb s:: El Horizon [Pb] tS (,) 0 ' - ' 207Pb 208Pb (ppm) 207Pb 208Pb (ppm) 207Pb 208Pb (ppm)
""
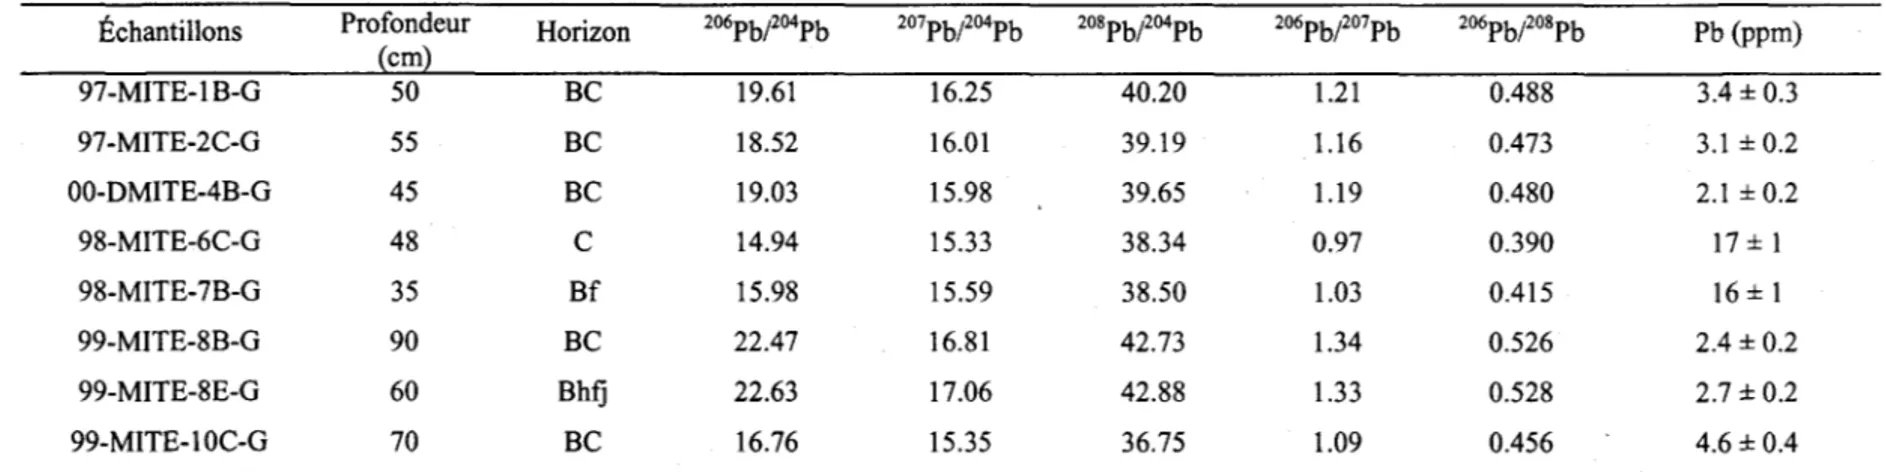
~ Grande-Baleine 99-MITE-I0A 90 C 1.38 0.545 0.18 ± 0.01 1.42 0.554 1.7±0.1 1.11 0.463 9.2 ±0.7 98-MITE-61 3 LF 1.20 0.490 5.7 ± 0.5 1.19 0.482 24±2 1.16 0.470 33 ±3 98-MITE-6H 7 Ah-H 1.18 0.446 0.89 ± 0.07 1.19 0.448 4.6 ± 0.4 1.03 0.415 16 ± 1 ~ 98-MITE-6G 11 Ae 1.15 0.442 1.63 ± 0.1 1.16 0.432 6.4 ± 0.5 1.05 0.420 25 ±2 ~: 98-MITE-6F 17 Bhfj 1.22 0.415 0.29 ± 0.02 1.27 0.422 4.0 ± 0.3 1.05 0.423 18 ± 1 98-MITE-6E 28 Bf 1.24 0.415 0.62 ± 0.05 1.34 0.405 4.1 ± 0.3 1.06 0.413 21 ± 2 98-MITE-6D 38 Bf 1.23 0.388 0.66 ± 0.05 1.33 0.398 4.5 ± 0.4 1.04 0.414 20±2 98-MITE-6C 48 C 1.22 0.387 0.61 ± 0.05 1.33 0.396 4.4 ± 0.4 1.05 0.413 20±2 98-MITE-6B 60 C 1.23 0.401 0.88 ± 0.07 1.34 0.400 4.5 ± 0.4 1.05 0.415 21 ± 2 98-MITE-6A 70 C 1.19 0.438 1.9 ± 0.2 1.28 0.415 6.0 ± 0.5 1.06 0.419 21 ± 2 98-MITE-7H 5 HF 1.21 0.490 1.9 ± 0.1 1.20 0.483 4.2 ±0.3 1.14 0.462 6.6 ± 0.5 98-MITE-7G 9 Ah-H 1.22 0.392 0.81 ± 0.06 1.22 0.390 3.8 ±0.3 1.06 0.415 10.6 ± 0.8 98-MITE-7E 16 Bhf 1.25 0.422 0.080 ± 0.006 1.27 0.421 6.0 ±0.5 1.10 0.424 19 ± 1 98-MITE-7D 23 Bhf 1.28 0.413 0.100 ± 0.008 1.32 0.419 5.1 ± 0.4 1.11 0.428 21 ± 2 98-MITE-7C 30 Bhf 1.29 0.415 0.12 ± 0.01 1.35 0.418 5.5 ± 0.4 1.11 0.432 19 ± 1 98-MITE-7B 35 Bf 1.29 0.414 0.24 ±0.02 1.36 0.424 6.5 ± 0.5 1.12 0.435 21 ± 2 98-MITE-7A 39 Bhf 1.33 0.401 0.17 ± 0.01 1.38 0.414 6.4 ± 0.5 1.12 0.433 22 ±2Tableau 2. Concentrations et compositions isotopiques du Pb mesurées par extraction totale dans les granules (2-4 mm) de la roche mère des profils de sols étudiés.
Échantillons Profondeur Horizon 206Pbp04Pb 207Pbp04Pb 208Pbp04Pb 206Pbp07Pb 206Pb/208Pb Pb (ppm) {cm} 97-MITE-IB-G 50 BC 19.61 16.25 40.20 1.21 0.488 3.4 ± 0.3 97-MITE-2C-G 55 BC 18.52 16.01 39.19 1.16 0.473 3.1 ± 0.2 >e 00-DMITE-4B-G 45 BC 19.03 15.98 39.65 1.19 0.480 2.1 ± 0.2
a:
98-MITE-6C-G 48 C 14.94 15.33 38.34 0.97 0.390 17 ± 1 98-MITE-7B-G 35 Bf 15.98 15.59 38.50 1.03 0.415 16 ± 1 99-MITE-8B-G 90 BC 22.47 16.81 42.73 1.34 0.526 2.4 ± 0.2 99-MITE-8E-G 60 Bhfj 22.63 17.06 42.88 1.33 0.528 2.7 ± 0.2 99-MITE-I0C-G 70 BC 16.76 15.35 36.75 1.09 0.456 4.6 ± 0.4>< >(' [Pb] (ppm) 0.01 0.1 10 100 1000 o 1 . " .. 00'1 . '''''1 . ,,00"1 . ""'1 .. ""'1 10 20 30
e
40 o ' -3 50 o'8
60 ~8
70 c... 80 90 100 [Pb](ppm) Site 8 13 km 0.01 0.1 10 100 1000 o . """'1 . ""'1 1 ~..J "00'1 ,-.. 10 20§
30 '-3
40 o "'0 s:: 50 ~8
60 c... 70 80 Site 2 45 km [Pb] (ppm) 0.01 0.1 10 100 1000 10000 o 1 . Il''00. ' ""'"1 '" ·"1 . Il''001.: . ":~!ïï' """1 10 20 30 40 50 60 70 Site 1 8.7 km [Pb] (ppm) 0.01 0.1 10 100 o 1 . "'"1 . """1 . '1 10 20 30 40 50 60 70 80 Site 10 116 km [Pb] (ppm) 0.01 0.1 10 100 1000 o '1 """'1 .",. .• ""'1 10 20 30 40 50 60 70 80 90 Site 9 14km [Pb] (ppm) 0.01 0.1 10 100 1 . '*1 "-,""1 o 1 . "'""1 Il 10 -20 30 40 50 60 70 Site 6 800 km [Pb] (ppm) 0.01 0.1 10 100 1000 o 1 1 '''''''1 . """ •. """1 10 20 30 40 50 60 Site 4 34 km [Pb] (ppm) 0.01 0.1 10 100 o 1 '''''''1 . """1 10 20 30 40(~
Site 7 800 km 90 _ _ _Fig,2 Profils des concentrations en ~ v vvv'" . w v ... u v . w vv.v des régions de Rouyn-Noranda et de Grande-Baleine
~ 206PbP07Pb 0.95 1.05 1.15 1.25 1.35 o 1 .. l ' . l ' l ' .:l' 10 20 ,- 30
§
40--
~ 50 01)'8
60 tEJ:
70 80 90 100 206PbP07Pb Site 8 13 km 0.95 1.05 1.15 1.25 1.35 o 1 • 1 ••• , 10 20S
30 ~ ~ 40.g
C 50 tE Site 2 206Pb/207Pb 0.95 1.05 1.15 1.25 1.35 °l~"., .. ,' "
10 20 30 40 50 60 70 Site 1 8,7 km 206Pb/207Pb 1.05 1.15 1.25 1.35 1.45 1.55 o +I ... ~ ... -+-'~'---+-... -'-i~.o....o...j 10 20 30 40 50 o .~ 60 45 km 60 70 70 80 80 90 Site 10 116 km 206PbP07Pb 0.95 1.05 1.15 1.25 ol ' , , , ' , , , '
10 20 30 40 50 60 70 80 90 206Pb/207Pb Site 9 14km 0.95 1.05 1.15 1.25 1.35 1.45 o l , ' 10 20 30 40 50 60 70 Site 6 800 km 206PbP07Pb 0.95 1.05 1.15 1.25 °l'~."'"
10 20 30 40 50 60 Site 4 34 km 206PbP07Pb 1.05 1.15 1.25 1.35 1.45 o +I~~"""'~-+-""""'-'---+~"""" 10 20 30 40 Site 7 800 kmmontrant que les rapports 206PbPo7Pb des échantillons de granules (2-4 millimètres) sont inférieurs à ceux observés dans les extractions échangeables et partielles. Le Pb issu de la décroissance radioactive occupe souvent des sites défectueux de la maille des silicates et est libéré préférentiellement lors de la météorisation. Le plomb libéré par l'altération de la roche-mère du sol est ainsi présumément associé aux hydroxydes de fer et de manganèse, ou adsorbé sur la matière organique et les minéraux argileux. Ce type de plomb est facilement libéré lors de l'attaque à l'acide dilué.
La libération d'un Pb plus radiogénique par altération météorique a donc pour conséquence de diluer les rapports isotopiques des échantillons de granules et peut expliquer les valeurs inférieure& des rapports isotopiques dans les digestions totales. Cette interprétation s'appuie aussi sur le fait que les rapports isotopiques dans la fraction totale sont un mélange de Pb lixivié par 0.25 M HCl et de Pb dérivé des minéraux parentaux (échantillons de granules). Ceci peut être exprimé par l'équation du bilan de masse suivante:
e
06PbP07Pb]p*
[Pb]p+
e
06PbPo7Pb]D*
([Pbh _
[Pb]p)=
e
06PbPo7Pbh
*
[Pbh
e
06PbPo8Pb]p*
[Pb]p+
e
06PbPo8Pb]D*
([Pbh _
[Pb]p) ~e
06PbPo8Pbh
*
[Pbh
où P représente l'extraction partielle, D, la fraction détritique (granules de 2-4 mm), T, la digestion totale.
Cette équation ne s'applique qu'aux échantillons minéraux et à quelques échantillons organiques provenant des sites de contrôle 6 et 7, lesquels ont été présumément moins affectés par les activités humaines. Le degré de météorisation du sol, l'effet des activités anthropiques et la représentativité des échantillons de granules pourraient être autant de raisons pour lesquelles un tel bilan de masse ne peut être appliqué aux sites de la région de Rouyn-Noranda.
4.3 Concentration et composition isotopique du Pb dans les extractions acides faibles
En général, le Pb est fortement concentré dans les horizons organiques au sommet des profils (L, F et H), et les concentrations diminuent brusquement des horizons organiques aux horizons minéraux. Contrairement aux concentrations en Pb, les rapports isotopiques du Pb sont plus élevés dans les échantillons minéraux provenant des horizons plus profonds, et ils diminuent de manière significative vers le sommet.
De faibles teneurs en Pb (~2 ppm) caractérisent les horizons plus profonds de tous les profils (sous 30-40 cm), puis augmentent légèrement dans le Bhf, le Bf supérieur ou l'horizon d'Ae pour atteindre des valeurs maximales dans les horizons organiques supérieurs (Fig. 2). Les rapports 206PbPo7Pb sont plus radiogéniques dans les parties plus profondes des profils de sol, et ils diminuent brusquement de l'horizon illuvial supérieur (Bhf ou Bf) ou de l'horizon éluvial (Ae) aux horizons organiques, atteignant les valeurs minimales au sommet (Fig. 3). Ces profils inversement corrélés des concentrations et des isotopes de Pb sont attribués au dépôt de Pb atmosphérique d'origine industrielle, lequel est généralement caractérisé par des rapports 206PbPo7Pb plus faibles. Une diminution des concentrations en Pb et une augmentation des rapports 206PbPo7Pb caractérisent l'horizon le plus superficiel au site 1, près de la fonderie Horne, reflétant une réduction récente des apports de Pb atmosphérique et/ou la contribution de sources de Pb plus radiogénique. La première hypothèse trouve confirmation dans le fait que les émissions métalliques de la fonderie Horne ont diminué de 50% depuis 1985. La fonderie Horne traite à 100% des minerais provenant d'autres producteurs de métaux non précieux provenant du nord-ouest du Québec ou importés d'Europe depuis la fermeture de la mine Horne (cuivre-or) en 1976. Les signatures isotopiques plus élevées des sulfures de Cu d'Europe
e
06PbPo7Pb=
~1.10-1.l5) et d'Abitibi
e
06PbPo7Pb=
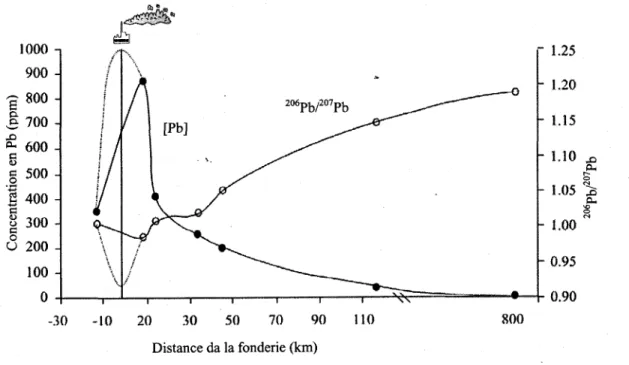
0.92-1.04) ont pu contribuer aux signatures isotopiques plus élevées au sommet des horizons organiques au site 1, le plus sensible aux apports atmosphériques proximaux.Les concentrations et rapports isotopiques du Pb varient non seulement verticalement dans les divers profils échantillonnés, mais aussi latéralement entre les sites. Le long du
transect nord-est de Rouyn-Noranda, la concentration moyenne en Pb dans les échantillons organiques est très élevée (869 ppm) au site 1, à seulement 8.7 km de fonderie Home, et elle diminue exponentiellement avec l'éloignement de la fonderie pour atteindre 39 ppm au site 10 situé à 116 km (Figure 4). Des tendances semblables ont été également observées pour d'autres métaux tels le Cu et le Zn dans le cadre de notre étude
- 1.25 \ \ \ f ~ l '\ l \ / -30 -10 20 0 [Pb] . \ . 30 50 70 90 1\0 800 Distance da la fonderie (km)
Fig. 4 Diagramme montrant les concentrations et compositions moyennes du Pb dans les horizons organiques de surface en fonction de la distance par rapport à la fonderie Home. 1.20 1.15 1.10
s:
r-0 1.05':ê
~ :g '" 1.00 0.95 0.90(données non publiées) et de plusieurs autres études. Au contraire des concentrations en Pb, les rapports isotopiques du Pb augmentent graduellement de 0.99 au site 1 à 1.15 au site 10 (Figure 4), indiquant une contribution décroissante du Pb anthropique avec l'éloignement de la source ponctuelle de pollution au Pb. Au site 1, l'échantillon montrant la concentration la plus élevée en Pb (1 414 ppm) présente également le plus bas rapport 206PbPo7Pb (0.98). Cette valeur est proche de la valeur 206PbPo7Pb de la galène de
Noranda (0.92) (Franklin et al., 1983) et dans la plage des sulfures de l'Abitibi. La diminution des concentrations en Pb et l'augmentation des rapports isotopiques avec l'éloignement de la fonderie Home suggèrent que celle-ci est la source ponctuelle de la contamination en métaux lourds des sols de la région de Rouyn-Noranda. Cette conclusion s'appuie aussi sur le fait que les compositions isotopiques du Pb mesurées
dans les sols se situent le long d'une ligne de mélange entre la composition isotopique de la galène de Noranda et celle du matériel minéral dans les horizons plus profonds des profils (Fig. 5). La valeur 206PbP07Pb la plus basse observée (0.98) au site le plus proche de la fonderie Home est inférieure à celles de 1.046 et de 1.172 enregistrées respectivement dans des échantillons de lichens (Carignan et Gariépy, 1995) et dans des
0.60 o 0.55 Abitibi US ~ 0.50 CDN .. ~
.~~
00 0 <::!-. ~ 0.45••
. . fi '" 0 '" 0.40 0.35 0.80 Rouyn-Nordnda (R-N)*
galèna 0.90 (1 1.00 • Échantillons organiques de R-N .. Échantillons organiques de G-B Grande-Baleine (G-B) 1.20 1.30 1.40o Échantillons minéraux de sol de R-N À Échantillons minéraux de sol de G-B
1.50
Fig.5 Diagramme montrant les rapports 206Pbp07Pb et 206Pbp08Pb dans la fraction extractible (0.25 M HCI) des échantillons de sols. Notez l'apport de Pb moins radiogénique dans les horizons organiques de surface. Les rapports isotopiques de la Galène de Noranda (Franklin, et al., 1983), et les émissions anthropiques des États-Unis (Simonetti et al., 2000) et du Canada (Carignan and Gariépy, 1995) sont aussi été indiaués.
échantillons de neige (Simonetti et al., 2000) dans la région de Rouyn-Noranda. Cette différence peut être attribuée à l'éloignement plus grand de l'échantillon de lichen par rapport à la fonderie Home (~ 100 km), ou encore aux signatures spécifiques du Pb dans les aérosols pendant la croissance des lichens ou pendant la période nivale.
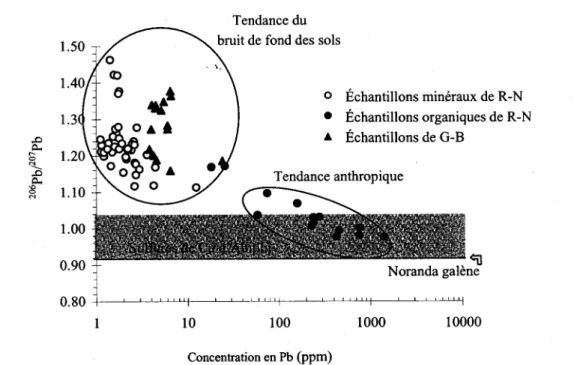
La figure 6 montre le rapport 206PbPo7Pb vs la concentration en Pb pour tous les échantillons provenant des huit (8) profils. La contamination des sols dans la région de Rouyn-Noranda est caractérisée par des concentrations plus élevées en plomb et des rapports isotopiques inférieurs dans les horizons organiques. Tous les échantillons minéraux provenant de Rouyn-Noranda ont une teneur en Pb inférieure
«
12 ppm) et des rapports plus radiogéniques 206PbPo7Pbe
06PbPo7Pb = 1.11-1.46), suggérant que les horizons minéraux des profils de sols ont été peu ou pas affectés par les apports de Pb anthropique.10
Tendance du bruit de fond des sols
100 o Échantillons minéraux de R-N • Échantillons organiques de R-N • Échantillons de G-B 1000 l, ~ Noranda ga ene 10000 Concentration en Pb (ppm)
Fig. 6 Diagramme montrant le rapport 206Pbp07Pb versus la concentration en
Pb dans la fraction extractible (0.25 M HCl) de tous les échantillons de sols. Les rapport 206PbPo7Pb de la galène de Noranda (Franklin et al., 1983) et sulfures de l'Abitibi sont aussi indiqués (Carignan et Gariépy, 1995).
Les concentrations et rapports isotopiques de Pb dans les profils de sol de Grande-Baleine sont caractérisés par des tendances n'affichant pas de changement vertical marqué. Tous les échantillons provenant de Grande-Baleine ont des valeurs proches des échantillons minéraux provenant de Rouyn-Noranda (Fig. 6) mais à l'extérieur de la ligne de mélange
206PbP07Pb vs 206PbP08Pb (Fig. 5), suggérant que cette région est moins affectée par des activités anthropiques.
Les rapports 206PbP07Pb moyens de 1.25 pour les sites 1, 2, 8, 9 et 4 et de 1.4 (site 10) déterminés sur l'extraction à 0.25 M Hel représentent les rapports 206PbP07Pb du Pb naturel puisque les rapports 206PbP07Pb des échantillons minéraux les plus élevés proviennent de l'extraction partielle. Le rapport 206PbP07Pb de 0.92 est considéré comme typique des émissions de la fonderie Home. En utilisant ces valeurs et les équations standard de dilution isotopique, la proportion estimée des émissions de la fonderie dans les sols de la région de Rouyn-Noranda peut être calculée. Les résultats sont présentés à la figure 7. Le Pb anthropique provenant des émissions de la fonderie a probablement été transporté jusqu'à 100 km.
100 90
-30 -10
Au bruit de fond des sols
10 30 50 70 90 110 130
Distance de la fonderie (km)
Fig. 7 Contribution estimée des émissions provenant de la fonderie par rapport au Pb dérivé de source anthropique et par rapport au bruit de fond des sols de la région de Rouyn-Noranda.
Sur la foi des concentrations en Pb et des rapports 206PbP07Pb dans les profils de sols, la migration du Pb anthropique dans les sols est estimée atteindre une profondeur de -10-30 cm. Si le dépôt du Pb provenant des émissions de la fonderie a commencé à compter de l'entrée en service de la fonderie Home en décembre 1927 ou juste après, une mobilité de 1 à 4 mm/a est estimée, ce qui concorde avec les résultats d'autres recherches.
Introduction
1. Pb contamination of the environment
Heavy metals occur naturally in the environment and are thus present, generally at low concentrations, in rocks, soils, sediments, plants and animaIs. But with the advent of the
..
industrial revolution, large amounts of heavy metals were re1eased to the atmosphere through various human activities. Of all the heavy metals concerned, lead continues to be the subject of significant enVÏfonmental concern because of its widespread use and its toxicity and persistence in the environment. Large quantities of lead were introduced into the environment through human activities, such as buming of leaded gasoline in automobiles, mining, smelting and refming, industrial and municipal waste disposaI, combustion of coal, etc. The buming of leaded gasoline was once the large st source of lead in the environment (Harrison and Luxen, 1981), but industrial releases such as lead mining, smelting and refining are now the major sources due to the drastic reduction of leaded gasoline used in automobiles.In the absence of reliable historical data on lead emissions, past records of lead in the environment has to be obtained indirectly. Soils, sediments, peat, ice and trees have provided indirect evidence of lead pollution in the environment. Elevated anthropogenic lead concentrations have been documented in aquatic sediments (Ohlander et al., 1993,
Moor et al., 1996; Farmer et al. 1996, 1997), soils (Rieuwerts and Farago, 1996; Verner
et al., 1996), peat bogs (Cortizas et al., 1997; Gôrres and Frenze1, 1997), corals from the
Atlantic and Pacific oceans (Shen and Boyle, 1987), snow and ice from polar regions (Boutron et al., 1991, 1994; Rosman et al., 1993, 1994), and trees near a copper smelter (Savard et al., accepted).
The measurement of lead concentrations in sediments or soils cannot elucidate alone its origin, since elevated Pb and other heavy metal accumulations do occur in areas with high
background Pb levels. To study the source of Pb in the environment, Pb isotope geochemistry can provide crucial information for identifying its provenance (Doe, 1970; Kramers and Toistikhin, 1997). The measurement of Pb concentrations and isotope ratios, together with the 210Pb, 137Cs, or 14C dating in the profiles of aquatic sediments, peat bogs and polar ice provides an indirect record of the history of human civilization. Emissions of anthropogenic Pb dating from Greek and Roman times have been recorded both in Greenland ice (Hong et al., 1994) and lake sediments (Renberg et al., 1994). In Scotland sediments, Farmer et al. (1996) demonstrated that the anthropogenic lead inputs have started as early as 1630 A.D. The rapid increase of Pb concentration together with the drop of Pb isotope ratios starting from the 1920s was attributed to the introduction of leaded petrol in the 1920s. In addition to lake sediments and polar ice, anthropogenic Pb emissions have also been recorded in peat bogs. These records have documented an ancient peak in Pb production in Roman times (Shotyk et al., 1997; Farmer et al., 1997),
elevated Pb emissions during the Medieval period (Bdinnvall et al., 1997) and a rapid increase of Pb inputs during the industrial revolution (Farmer et al., 1997; Shotyk et al.,
1997), especially massive Pb inputs in peat during the 1950s, 1960s and 1970s, as a result of the widespread introduction of leaded gasoline. The significant reduction of atmospheric Pb inputs both in North America (Norton et al., 1997) and in Europe (Brannvall et al., 1997; Farmer et al., 1997; Shotyk et al., 1997) is a measure of the success of efforts to eliminate leaded gasoline.
Soils, as the major sink of heavy metals in the environment, play an important role in global metal cycling; consequently, anthropogenic lead contamination of soils has received much attention. Numerous investigations have been conducted in soils in the vicinity of smelters (Linzon et al., 1976; Bisessars, 1982; Dumontet et al., 1990;
Karczewska, 1996; Rieuwerts and Farago, 1996; Verner and Ramsey, 1996) and near traffic roads (Chow, 1970; Erel et al., 1997) to study the heavy metal contamination. These studies found that heavy metal concentrations are extremely high in the upper horizons of the soils close to smelters and highways and that they decrease progressively with increasing distance from the contaminant sources. Such distribution patterns of Pb in soils have been attributed to smelter emissions (Rabinowitz and Wetherill, 1972) and to
the increased use of leaded gasoline (Chow, 1970; Gulson, 1981; Erel et al., 1997) by using lead isotope signatures.
The detection of Pb pollution in soils is based on the fact that Pb isotopic ratios in natural background materials, such as crustal rocks and soils, are significantly different from those of industrial pollutants, such as smelter emissions or leaded gasoline. Ore leads used in industrial activities usually have 206PbPo7Pb significantly lower than the natural ratios of soils and soil related components, because the accumulation of 206Pb from
..
radioactive decay of 238U stops when lead is separated from uranium during the formation of the ore bodies, while it continues in crustal rocks from which soils are derived. Lead concentration in soil profiles j~ often enhanced in the uppermost horizon and decreases with depth. If natural processes had caused this enrichment, Pb should have an isotope pattern related to soil parent materials throughout the soil profile. When soils are exposed toindustrial pollution, their Pb concentrations and isotope rations usually display an inverse trend with depth in soil profiles (Pouchelt et al., 1993).2. Previous work in the study area
Rouyn-Noranda is a region where numerous mining and smelting activities have taken place since the opening of the Home mine in 1922 and construction of the Home smelter in 1927. Before the "Rouyn-Noranda Ville En Santé" program was launched in 1987, the mining and smelting community eamed the reputation of ''the most polluted city in Canada", because of the severe environmental problems such as clouds ofsulfur dioxide, acid rain, lead and other heavy metal contamination. Many research projects pertaining to Home smelter emission-related environmental problems were conducted (e.g. Dumontet
et al., 1990; Henderson et al., 1999; Carignan and Gariépy, 1995). Investigations carried out by Dumontet et al. (1990) revealed that heavy metals (Pb, Zn, Cd, Cu, etc.) are enriched in top soils at sites near the Home smelter and decrease gradually with increasing distance away from the smelter. In a comparative study, Savard et al.
(accepted) investigated the Pb concentration and Pb isotope ratios in spruce rings near Rouyn-Noranda. They found that Pb concentrations in spruce rings show a major increase
starting in 1944 which coincides with a decrease of 206Pbp07Pb ratios. It is suggested that the delay of 14 years is mainly generated by the buffering effect of soils. Carignan and Gariépy (1995) investigated the Pb concentrations and 206Pbp07Pb ratios in lichens in Rouyn-Noranda region and in the St. Lawrence Valley. They found that Pb concentrations are highest in lichen samples collected at sites close to the smelter, and decline progressively with distance away from the smelter. While 2°6pbp07Pb ratios inversely covary with Pb concentrations, the lowest 206Pbp07Pb ratio of 1.046 found at site close to smelter is very close to that of the typical Noranda galena and within the range of Abitibi copper sulfides. By using 206Pbp07Pb ratios, they were able to calculate that emissions from Home smelter accounted for 50%-90% of the atmospheric Pb at site nearest Rouyn-Noranda. In the St. Lawrence Valley, far away from Rouyn-Noranda, a mixture of Canadian and U.S. anthropogenic Pb sources is found. Simonetti et al. (2000)
investigated the 206Pbp07Pb ratios of snow pack from Quebec. They found that atmospheric pollution in the Quebec-Montreal region is dominated by a mixture of anthropogenic emissions from U.S. and Canadian sources.
3. Objectives of this project
Although many investigations of heavy metal pollution have been conducted in the Rouyn-Noranda area, no thorough investigation of soils exposed to Home smelter emissions has yet been carried out to trace the sources of anthropogenic lead in soils. In this project, Pb concentrations as well as Pb isotope ratios of different extracted fractions in soil profiles along a north-east south-west transect crossing the Home smelter and at control sites were analyzed to examine the smelter effect on the heavy metal distribution in soils and to trace the origins of lead in surface soils near the smelter. This work has three (3) main objectives:
1) To determine the extent of Pb contamination of soils exposed to Home smelter emissions;
2) To distinguish the source(s) of anthropogenic lead in soils;
4. The structure of the the sis
In chapter 1, the author briefly discusses the presence of Pb in the environment, inc1uding its sources, speciation, contamination of the environment and its health effects. Chapter 2 and chapter 3 are mainly focused on the sources and environmental fate of Pb in soils. Chapter 4 describes themethodology applied in this project, inc1uding sampling methods,
'"
sample preparation procedures, analytical methods and data quality control approaches. The last chapter presented the results and discussions of Pb concentrations and Pb isotope ratios in soil profiles in the stu<ly area and at control sites.
1.
1
Chapter 1
The presence of Pb in the environment
1. Sources of Pb in the environment
The major sources of lead in the environment are emissions from vehic1es burning leaded gasoline, from mining and smelting industry, and from domestic waste combustion. According to Ter Haarand and Bayard (1971), exhaust partic1es emitted from automobiles consist mainly of PbBr2, PbBrCI, Pb(OH)Br, (PbO)2PbBr2 and (PbO)2PbBrCl and they are relative1y unstable and readily converted into other mineraI fOTIns. After 18 hours of disposaI to the air, about 75% of the Br has volatilized, and 30% - 40% of the Cl compounds are also lost. The Pb compounds are converted to Pb carbonates, oxycarbonates and oxides. The main Pb pollutants emitted from smelters occur as PbS04
and PbS, and to a lesser extent PbO (Clevenger et al., 1991). In the atmosphere, lead
exists primarily in the fOTIn of PbS04 and Pb(C03) (EPA, 1986). In addition to
anthropogenic sources, natural processes also contribute to the presence of Pb in the environment. Eroded soils containing Pb partic1es may end up in rivers and then be transported to lakes and to the ocean. Pb-bearing soil partic1es may be transported over long distances by wind. Volcanic emissions also contribute materials containing metals from the Earth's mantle and crust into the atmosphere. Pb that has been part of vegetation can be released and spread by forest frres.
2. Speciation of Pb in the environment
The fate of Pb in the environment depends to a large extent on its speciation, the chemical fOTIn under which Pb is present. Pb has two oxidation states, Pb2+ and Pb4+, both ofwhich
are stable. The environmental chemical behavior of the element is dominated by the plumbous ion, Pb2+. The inorganic fOTIns include galena (PbS), lead carbonate (cerussite,
PbC03), sulphate (anglesite, PbS04), Pb phosphates (e.g. pyromorphite, Pbs(P04)3CI) and Pb oxides (e.g. Pb30 4). Pb tends to fonn low solubility compounds with the major anions
found in natural water (lead acetate, chloride, chromate, nitrate, oxide and sulphate). Many inorganic Pb compounds like lead hydroxides, carbonate, and sulfide are not readily soluble in water and are precipitated from water and sequestered in sediments. The organolead compounds in the environment are mainly anthopogenic in origin. The most widely used fonns are the tetraalkyllead (tetramethyllead and tetraethyllead) in antiknock gasoline, in which Pb exists as Pb4+. These organoleads are volatile, insoluble
..
in water, can be adsorbed onto particles and accumulate in living organisms. The tetraalkyllead can degrade into trialkyllead and dialkyllead that are soluble in water. Organic leadcompounds arefftt-soluble and are more toxic than other fonns. In rivers, lakes and oceans, Pb is strongly associated with particles by adsorption or co-precipitation on solid organic or inorganic phases, by precipitating of insoluble compounds or by association with organisms. Pb can also be uptaken by plants, animaIs and aquatic organisms, and the principal factors controlling Pb uptake in aquatic systems include temperature, pH, salinity and the presence of organic matter.
3. Pb concentrations in the environment
The Pb concentrations reported in the environment vary greatly depending on sample location, the time of sampling, the analytical method applied, the extent of local pollution,
etc; In pre-technological times, Pb concentrations in the atmosphere were less than 0.1
ng/m3, but in present day, it has exceeded several nanograms even in remote areas (RSC,
1986). The natural Pb content in soils is about 20 ppm, while in the surface horizons of soils close to Pb source such as smelters, the Pb content can be as high as tens of thousands ppm. Pb concentration is usually higher at surface of the ocean or lakes than in the deeper parts of the water column due to the input from atmospheric deposition. The baseline Pb concentration in Lake Erie was found to range from 17 to 18.9 ppm (at the depth of 45-60 cm) (Ritson et al., 1994), while the maximum dissolved Pb concentration in surface waters was as high as 135 ppm in Lake Erie and 291.5 ppm in lake Ontario (Flegal et al., 1989), which is likely related to the amount of Pb input to the individual
lakes. Similar patterns were observed in lake sediments. For example, in surface lake sediments of Sweden, Pb occurs at a level as high as 400 ug/g by dry weight, which is about 40-100 times the background value.
4. The health effect of Pb
Pb is hazardous to human beings and animaIs in two ways - inhalation of Pb-bearing soil dust and consumption of foods with high levels of Pb. Studies on the quantitative relationship between exposure to lead contaminated soil and Pb blood levels in children have indicated that Pb blood levels increase with exposure to increased lead concentrations in soils (Duggan, 1980). Lead toxicity may occur at Pb blood levels of
10-15 mg/dl or possibly less. The exposure of children to high levels of Pb can cause a variety of adverse health effects, inc1uding impaired mental and physical development, decreased biosynthesis, elevated hearing threshold, and decreased serum levels of vitamin D. Long-term exposure of adults to lead at work has resulted in decreased performance in sorne tests that measure functions of the nervous system. Lead exposure may also cause weakness in fingers, wrists, or ankles. At high levels of exposure, lead can severely damage the brain and kidneys in adults or children. In pregnant women, high levels of exposure to lead may cause miscarriage. High-Ievel exposure in men can damage the organs responsible for sperm production [1]. Another pathway of Pb into human body is food uptake. Lead accumulates in the gill, liver, kidney and bone of fish. Although Pb occurs naturaUy in aU plants, it has not been shown to play an essential role in their metabolism. Pb is present naturaUy in plants as trace amounts. However, in the proximity of mining and smelting areas, much higher Pb concentrations are common in plants growing on contaminated soils.
Chapter 2
Sources of Pb in soils
Lead is introduced in the environment through diverse sources, such as burning of leaded gasoline in automobiles, mining, smelting and refming, industrial and municipal waste
,.
disposaI, combustion of coal, etc. Since the fallout of airbome Pb onto soils contributes more to the total Pb concentrations than that from natural source (e.g. parental rocks) from which the soils are deriv,ed (Jaworski, 1978), the sources of Pb in the atmosphere will be discussed prior to soils.
1. Sources of Pb in the atmosphere
1.1 Mining and smelting industry
Base metal mining is an important point source of heavy metals in the environment. Mining and milling operations together with grinding and concentrating ores, the disposaI of mine wastes and dispersion from tailings provide obvious sources of metal contamination (Adriano, 1986). Elevated levels ofheavy metals from metalliferous mines are found in soils and plants growing on the contaminated soils near mine areas due to the discharge and dispersion of mine wastes into the ecosystem (Davies and Ballinger, 1990, Davies and Roberts, 1975; Merrington and Alloway, 1994). Jung and Thomton (1996) reported that Pb concentration in surface soils near a Pb-Zn mine in Korea was as high as 29900 ppm.
Smelting and refming heavy metals generate a considerable amount of fumes containing Pb and other heavy metal particles. Total particulate emissions into the atmosphere from the production of primary (originating directly from ore concentrate) and secondary (referring to recycled or recovered Pb) lead in the US were estimated to be 30 000 and 4
000 tons per year, respectively (Vandegrift et al., 1971). The lead content of such emissions is estimated to be in the range of 0.1-100 mg/k:g. In addition to emissions from Pb production, other metallic production, such as the production of iron and steel, or that of primary and secondary copper also contribute great amounts of Pb and other heavy metals into the atmosphere.
Canada is a major producer and emitter of lead. Primary lead productions peaked at about 400000 tons in 1971, and have declined to about 300 000 tons in 1984 (Stokes, 1986). In 1982, atmospheric emissions of Pb from primary production of metals were estimated to be 3 574 tons, which account for 31 % of the total atmospheric Pb emissions of Il 466 tons (Jacques, 1985). The Home smelter, as the major emitter in Canada, has released large amounts of heavy metals (Pb, Zn, Cu, Cd, As, etc.) in the environment. The total emissions ofheavy meta1s from 1965 to 1998 were estimated to be 40 102 tons, 38 236 tons and 5080 tons for Pb, Zn and Cu, respective1y.
Elevated levels of Pb and other metals were reported in soils in the vicinity of smelters. Many investigations show that heavy metals are enriched in surface soils near a smelter, and they decline exponentially with increasing distance from smelter (e.g. Rieuwerts and Farago, 1996). In Ontario, Pb concentration in soils near a secondary Pb smelter was estimated to be 21 200 ppm (Linzon et al., 1976).
Modem devices are extremely efficient in controlling the release of heavy metals from industrial and mining plants, and emissions into the atmosphere are greatly reduced. But due to the low solubility of Pb compounds in soils and their resistance to microbial degradation, Pb will remain in soils for a relatively long time.
1.2 Gasoline combustion
Lead was added to gasoline in the early 1920s as organic tetraalkyllead additives to increase the octane ratings and to avoid uneven combustion in engine cylinders. The first leaded gasoline was sold in 1923 and its use rapidly became standard. In 1973, the UK
consumption oflead antiknock additives was 12000 tons per year (CUEP, 1974). Ofthis, about 70% - 75% was emitted from the exhaust as inorganic salts of lead, and about 1 % was emitted unchanged as tetraalkyllead. Evaporative loss of fuel from fuel tanks also contributed tetraalkyllead compounds to the atmosphere. The remaining 20% - 25% of lead remained trapped in the exhaust system and engine oil. Concentrations of lead in vehicle exhaust gases are typically 2000-10000 ug (Pb )/m3. The organic tetraalkyllead compounds are volatile and exist in· air in vapor phase, while the inorganic salts are emitted as particles that will be subject to rapid growth in ambient air by coagulation with
..
other particles. In Canada, atmospheric emissions of Pb from petrol (including alkyllead manufacture) were estimated to be 7 278 tons in 1982, which represented 63% of the total Pb emissions that year (Jacques.. 1985).Leaded gasoline combustion as a source of soil contamination has been reported by many researchers. Warren and Delavault (1960) reported that soil and vegetation samples collected near roads contained unusually high levels of Pb. In Israel, Erel et al. (1997)
found that Pb concentrations in soil samples collected near traffic roads are much higher than those collected from remote area. Contamination of soils and vegetation near traffic roads has been reported by many researchers in many countries. Other sources of Pb into the atmosphere include fossil fuel combustion, waste incineration, battery manufacturing,
etc.
Pb in the atmosphere may also come from natural sources such as silicate dusts, volcanic halogen aerosols, forest frres, sea salt aerosols, meteoric and meteoritic smoke and Pb derived from the decay of radon. But these sources contribute only a small amount of airbome lead in comparison to lead derived from mining and smelter emissions as weIl as vehicle emissions.
2. Sources of lead in soils
2.1 Parent rocks
2.1.1 Background levels of Pb in rocks
Geological materials from which soils are derived are important contributors of lead in soils. In unpolluted soils, mean lead concentrations relate c10sely to the lead concentration of parent rocks. Lead makes up less than 0.1 % by weight in rocks and soils. The primary Pb form in the natural state is galena (PbS), as Pb has highly chalcophilic properties. Lead can also substitute Zn in sphalerite, Cu in chalcopyrite. It can also easily replace K, Sr, Ba, Ca and sometimes Na in certain silicates. The natural lead content of soil is closely related to the type of bedrock. Generally, there is an increase in lead concentrations from ultramafic to felsic igneous rocks because Pb isomorphously replaces potassium in silicate lattices. For sedimentary rocks, argillaceous sediments, shales, which are rich in organic matter, tend to have higher lead contents due to their ability to adsorb metal ions (Table 2-1).
Table 2-1 Lead concentrations in representative rock types.
Rock type Pb concentration
(ppm)
Ultramafic rocks 0.1-1.0
Mafic rocks(Basalt, Gabbro) 3-8
Magmatic rocks Intermediate rocks 12-15
Felsic rocks (Granite, Gneisses) 15-24
Felsic rocks (Volcanic) 12-20
Argillaceous sediments 20-40
Sedimentary Shales 18-25
rocks Sandstones 5-10
Limestone, dolomite 3-10