S
CIENTIFIC
A
SSESSMENT
OF
O
ZONE
D
EPLETION
: 2018
World Meteorological Organization
Global Ozone Research and Monitoring Project—Report No. 58
World Meteorological Organization
United Nations Environment Programme
National Oceanic and Atmospheric Administration
7bis avenue de la Paix
Case postale 2300
CH-1211 Geneva 2
Switzerland
United Nations Environment Programme
Ozone Secretariat
P.O. Box 30552
Nairobi, 00100
Kenya
US Department of Commerce
National Oceanic and Atmospheric Administration
14
thStreet and Constitution Avenue NW
Herbert C. Hoover Building, Room 5128
Washington, D. C. 20230
National Aeronautics and Space Administration
Earth Science Division
NASA Headquarters
300 E. Street SW
Washington, D.C. 20546-0001
European Commission
Directorate-General for Research
B-1049 Bruxelles
Belgium
Published online January 2019 ISBN: 978-1-7329317-1-8
This report is available on the internet at the following locations: http://ozone.unep.org/science/assessment/sap
https://www.esrl.noaa.gov/csd/assessments/ozone/2018/ This document should be cited as:
WMO (World Meteorological Organization), Scientific Assessment of Ozone Depletion: 2018, Global Ozone Research and Monitoring Project–Report No. 58, 588 pp., Geneva, Switzerland, 2018. Example Chapter Citation:
Engel, A. and M. Rigby (Lead Authors), J.B. Burkholder, R.P. Fernandez, L. Froidevaux, B.D. Hall, R. Hossaini, T. Saito, M.K. Vollmer, and B. Yao, Update on Ozone-Depleting Substances (ODSs) and Other Gases of Interest to the Montreal Protocol, Chapter 1 in Scientific Assessment of Ozone Depletion: 2018, Global Ozone Research and Monitoring
Project–Report No. 58, World Meteorological Organization, Geneva, Switzerland, 2018. Inside cover image: Adapted from Adobe Stock photo
World Meteorological Organization
Global Ozone Research and Monitoring Project–Report No. 58
S
cientific
A
SSeSSment
of
o
zone
D
epletion
: 2018
World Meteorological Organization
United Nations Environment Programme
National Oceanic and Atmospheric Administration
National Aeronautics and Space Administration
European Commission
Scientific Assessment of Ozone Depletion: 2018
Assessment Co-chair
s
David W. Fahey
Paul A. Newman
John A. Pyle
Bonfils Safari
Scientific Steering Committee
David W. Fahey
Paul A. Newman
John A. Pyle
Bonfils Safari
Martyn P. Chipperfield
David J. Karoly
Doug Kinnison
Malcolm K. Ko
Michelle Santee
Assessment Coordinator
Sarah J. Doherty
Chapter Lead Authors
Chapter 1: Update on Ozone-Depleting Substances (ODSs) and
Other Gases of Interest to the Montreal Protocol
Andreas Engel and Matthew Rigby
Chapter 2: Hydrofluorocarbons (HFCs)
Stephen A. Montzka and Guus J.M. Velders
Chapter 3: Update on Global Ozone: Past, Present, and Future
Peter Braesicke and Jessica Neu
Chapter 4: Polar Stratospheric Ozone: Past, Present, and Future
Ulrike Langematz and Matthew B. Tully
Chapter 5: Stratospheric Ozone Changes and Climate
Alexey Yu. Karpechko and Amanda C. Maycock
Chapter 6: Scenarios and Information for Policymakers
Lucy J. Carpenter and John S. Daniel
Twenty Questions and Answers About the Ozone Layer: 2018 Update
Ross J. Salawitch
Appendix A: Summary of Abundances, Lifetimes, ODPs, REs, GWPs, and GTPs
James B. Burkholder
Report Design and Production
Debra A. Dailey-Fisher and Ann M. Reiser
Ivar Sigmund Angell Isaksen (1937–2017) (Professor in the Department of Geosciences at the University of Oslo) passed away on 16 May 2017. Ivar grew up in Djupvik in Lyngen in North Troms. He joined the University of Oslo’s Department of Geophysics in 1967 and received his doctoral degree at the University of Oslo in 1973. He then became professor of theoretical meteorology in 1981 at the University of Oslo. Ivar’s awards included the National Oceanographic and Administration (NOAA) Award for outstanding scientific achievement in 1975; the 1990 Norwegian Ministry of Environment award for Environmental Research; the University of Thessaloniki Award, 2000, for Scientific Achievement; the European Physical Society and The Balkan Physical Union Award for outstanding contribution in Environmental Physics,
2002; and an Honorary doctorate at the University of Athens, 2009. He was elected to the International Ozone Commission in 1984, and was its President from 2004-2008. Ivar was a major contributor to the Scientific Assessments of Ozone Depletion as an author, co-author, coordinator, and reviewer. He was an author of the very first international assessment “The Stratosphere 1981”, and then contributed to every report up to “The Scientific Assessment of Ozone Depletion: 2010”. Ivar’s final comments were from May 2013, when he recommended that the 2014 Assessment should tackle overlapping topics with the climate community.
Photo credit: CICERO (the Norwegian Center for International Climate Research)
Ralph J. Cicerone (1943–2016) (Retired President of the National Academy of Sciences) passed away on 5 November 2016 in Milburn, New Jersey. Ralph was born in New Castle, Pennsylvania on 2 May 1943. Ralph received his undergraduate degree from the Massachusetts Institute of Technology in 1965, and his doctoral degree from the University of Illinois at Urbana–Champaign in 1970. While at the University of Michigan in 1974, Ralph and his colleague Rich Stolarski showed that chlorine catalysis of ozone destruction could add a crucial piece of the puzzle to the questions about the stratospheric ozone photochemical balance. Subsequently, Ralph moved to the Scripps Institution of Oceanography at UC San Diego, and in 1980 became a senior scientist and director of the Atmospheric Chemistry Division at the National Center for Atmospheric Research in Boulder, Colorado. Ralph migrated west to the University of California, Irvine (UCI), in 1989 where he founded the Department of Earth System Science and eventually became the University Chancellor. In 2005, Ralph became the 21st President of the US National Academy of Science. Amongst Ralph’s awards are
the 1999 Bower Award and Prize for Achievement in Science; the American Geophysical Union’s (AGU) 1979 James B. Macelwane Award; AGU’s 2002 Roger Revelle Medal; and the World Cultural Council’s 2004 Albert Einstein World Award of Science. Ralph was also recognized in the 1995 Nobel Prize in chemistry awarded to F. Sherwood Rowland, Mario Molina, and Paul Crutzen for his work on chlorine chemistry in the stratosphere. Ralph was a author of the very first international assessment “The Stratosphere 1981”. Ralph was also a co-author of “Atmospheric Ozone: 1985” that formed the scientific foundation for the Montreal Protocol. He also contributed to the “Report of the International Ozone Trends panel – 1988”, and to the “Scientific Assessment of Ozone Depletion: 1994”.
Photo credit: Courtesy of the National Academy of Sciences / Photographer: Mark Finkenstaedt
R
emembRances
It is with sadness that we note the passing of the following scientists who have played leading roles in the international scientific assessments of the ozone layer.
s
cientific
a
ssessment
of
o
zone
D
epletion
: 2018
CONTENTS
HIGHLIGHTS . . . .ES.3 PREFACE . . . .ES.7 INTRODUCTION . . . .ES.11 EXECUTIVE SUMMARY . . . .ES.15
Chapter 1
:
UPDATE ON OZONE-DEPLETING SUBSTANCES (ODSs) AND OTHER GASES OF INTEREST TO THE MONTREAL PROTOCOLLead Authors: Andreas Engel and Matthew Rigby
Scientific Summary. . . 1.1 1.1 Summary of Findings from the Previous Ozone Assessment . . . 1.7 1.2 Updated Abundances, Trends, Lifetimes, and Emissions of . . .
Longer-lived Halogenated Source Gases . . . 1.7 1.3 Very Short-lived Halogenated Substances (VSLSs). . . .1.30 1.4 Changes in Atmospheric Halogens . . . .1.45 1.5 Changes in Other Trace Gases that Influence Ozone and Climate . . . .1.61 References . . . .1.66
Chapter 2
:
HYDROFLUOROCARBONS (HFCs) Lead Authors: Stephen A. Montzka and Guus J.M. VeldersScientific Summary. . . 2.1 2.1 Summary of Findings from the Previous Ozone Assessment . . . 2.5 2.2 Introduction . . . 2.5 2.3 Atmospheric Observations and Derived Emission Estimates . . . 2.7 2.4 Atmospheric Chemistry of HFCs . . . .2.32 2.5 Potential Future Changes . . . .2.34 References . . . .2.47
Chapter 3
:
UPDATE ON GLOBAL OZONE: PAST, PRESENT, AND FUTURE Lead Authors: Peter Braesicke and Jessica NeuScientific Summary. . . 3.1 3.1 Introduction . . . 3.5 3.2 Natural Ozone Variations and Trend Detection . . . 3.9 3.3 Past Ozone in Observations . . . .3.22 3.4 Projected Ozone Changes . . . .3.40 References . . . .3.53 Appendix 3A: Data Sources . . . .3.69
Chapter 4
:
POLAR STRATOSPHERIC OZONE: PAST, PRESENT, AND FUTURE Lead Authors: Ulrike Langematz and Matthew B. TullyScientific Summary. . . 4.1 4.1 Introduction . . . 4.5 4.2 Recent Polar Ozone Changes . . . 4.6
4.4 Recovery of Polar Ozone . . . .4.28 4.5 Future Changes in Polar Ozone . . . .4.36 References . . . .4.49
Chapter 5
:
STRATOSPHERIC OZONE CHANGES AND CLIMATE Lead Authors: Alexey Yu. Karpechko and Amanda C. MaycockScientific Summary. . . 5.1 5.1 Introduction . . . 5.5 5.2 Observed Changes in Atmospheric Constituents and External Forcings that Relate to Climate . . . 5.6 5.3 Observed and Simulated Changes in Stratospheric Climate . . . .5.12 5.4 Effects of Changes in Stratospheric Ozone on the Troposphere and Surface. . . .5.29 5.5 Climate Impacts of the Montreal Protocol. . . .5.48 References . . . .5.50
Chapter 6: SCENARIOS AND INFORMATION FOR POLICYMAKERS Lead Authors: Lucy J. Carpenter and John S. Daniel
Scientific Summary. . . 6.1 6.1 Introduction . . . 6.7 6.2 Issues of Potential Importance to Stratospheric Ozone and Climate. . . 6.9 6.3 Metrics for Changes in Ozone and Climate . . . .6.21 6.4 Scenarios and Sensitivity Analyses. . . .6.25 References . . . .6.46 Appendix 6A: Current State of Knowledge on Stratospheric Sulfate Geoengineering. . . .6.57 Appendix 6B: Comparison of Past and Future Ozone Projections of the . . .
GSFC 2-D Model with GEOSCCM 3-D Simulations. . . .6.61 Appendix 6C: Evaluation of Alternative Scenarios Using New EESC Formalism . . . .6.69 Appendix A: SUMMARY OF ABUNDANCES, LIFETIMES, ODPs, REs, GWPs, GTPs . . . .A.1 Appendix B: CHEMICAL FORMULAE AND NOMENCLATURE . . . B.1 Appendix C: ACRONYM DICTIONARY . . . .C.1 Appendix D: LIST OF AUTHORS, CONTRIBUTORS, AND REVIEWERS . . . .D.1
World Meteorological Organization
Global Ozone Research and Monitoring Project – Report No. 58
e
xecutive
S
ummAry
S
cientific
A
SSeSSment
of
o
zone
D
epletion
: 2018
World Meteorological Organization
United Nations Environment Programme
National Oceanic and Atmospheric Administration
National Aeronautics and Space Administration
European Commission
National Oceanic and Atmospheric Administration National Aeronautics and Space Administration
United Nations Environment Programme World Meteorological Organization
H
igHligHtS
S
cientific
A
SSeSSment
of
o
zone
D
epletion
: 2018
The Assessment documents the advances in scientific understanding of ozone depletion reflecting the thinking of the many international scientific experts who have contributed to its preparation and review. These advances add to the scientific basis for decisions made by the Parties to the Montreal Protocol. It is based on longer observational records, new chemis-try-climate model simulations, and new analyses. Highlights since the 2014 Assessment are:
Actions taken under the Montreal Protocol have led to decreases in the atmospheric abundance of controlled ozone-depleting substances (ODSs) and the start of the recovery of stratospheric ozone. The atmospheric abun-dances of both total tropospheric chlorine and total tropospheric bromine from long-lived ODSs controlled under the Montreal Protocol have continued to decline since the 2014 Assessment. The weight of evidence suggests that the decline in ODSs made a substantial contribution to the following observed ozone trends:
The Antarctic ozone hole is recovering, while continuing to occur every year. As a result of the Montreal Protocol much more severe ozone depletion in the polar regions has been avoided.
Outside the polar regions, upper stratospheric ozone has increased by 1–3% per decade since 2000.
No significant trend has been detected in global (60°S–60°N) total column ozone over the 1997–2016 period with average values in the years since the last Assessment remaining roughly 2% below the 1964–1980 average.
Ozone layer changes in the latter half of this century will be complex, with projected increases and decreases in different regions. Northern Hemisphere mid-latitude total column ozone is expected to return to 1980 abundances in the 2030s, and Southern Hemisphere mid-latitude ozone to return around mid-century. The Antarctic ozone hole is expected to gradually close, with springtime total column ozone returning to 1980 values in the 2060s. [ES Sections 1 and 3] The Kigali Amendment is projected to reduce future global average warming in 2100 due to hydrofluorocarbons (HFCs) from a baseline of 0.3–0.5 oC to less than 0.1 oC. The magnitude of the avoided temperature increase due to the provisions of the Kigali Amendment (0.2 to 0.4 oC) is substantial in the context of the 2015 Paris Agreement, which
aims to keep global temperature rise this century to well below 2 oC above pre-industrial levels. [ES Section 2]
There has been an unexpected increase in global total emissions of CFC-11. Global CFC-11 emissions derived from measurements by two independent networks increased after 2012, thereby slowing the steady decrease in atmospheric concentrations reported in previous Assessments. The global concentration decline over 2014 to 2016 was only two-thirds as fast as it was from 2002 to 2012. While the emissions of CFC-11 from eastern Asia have increased since 2012, the contribution of this region to the global emission rise is not well known. The country or countries in which emis-sions have increased have not been identified. [ES Section 1]
Sources of significant carbon tetrachloride emissions, some previously unrecognised, have been quantified. These
sources include inadvertent by-product emissions from the production of chloromethanes and perchloroethylene, and fugitive emissions from the chlor-alkali process. The global budget of carbon tetrachloride is now much better understood than was the case in previous Assessments,and the previously identified gap between observation-based and industry-based emission estimates has been substantially reduced. [ES Sections 1 and 5]
Continued success of the Montreal Protocol in protecting stratospheric ozone depends on continued compliance with the Protocol. Options available to hasten the recovery of the ozone layer are limited, mostly because actions that
could help significantly have already been taken. Remaining options such as complete elimination of controlled and uncontrolled emissions of substances such as carbon tetrachloride anddichloromethane; bank recapture and destruc-tion of CFCs, halons, and HCFCs; and eliminadestruc-tion of HCFC and methyl bromide producdestruc-tion would individually lead to small-to-modest ozone benefits. Future emissions of carbon dioxide, methane, and nitrous oxide will be extremely
c
ontents
e
xecutive
S
ummAry
Scientific Assessment of Ozone Depletion: 2018
Preface. . . .ES.7 Introduction. . . .ES.11 Executive Summary . . . .ES.15 [1] Concentrations and trends in ozone-depleting substances (ODSs) . . . .ES.15 [2] Hydrofluorocarbons (HFCs) . . . .ES.20 [3] Stratospheric ozone . . . .ES.22 [4] Ozone change and its influence on climate . . . .ES.27 [5] Policy considerations for stratospheric ozone and climate . . . .ES.29 Executive Summary Appendix: Scientific Summaries of the Chapters . . . .ES.33 Chapter 1: Update on Ozone-Depleting Substances (ODSs) and. . . . other Gases of Interest to the Montreal Protocol . . . .ES.33 Chapter 2: Hydrofluorocarbons (HFCs) . . . .ES.37 Chapter 3: Update on Global Ozone: Past, Present, and Future . . . .ES.40 Chapter 4: Update on Polar Ozone: Past, Present, and Future . . . .ES.42 Chapter 5: Stratospheric Ozone Changes and Climate . . . .ES.44 Chapter 6: Scenarios and Information for Policymakers . . . .ES.46
p
refAce
This document contains information upon which the Parties to the Montreal Protocol on Substances that Deplete the Ozone Layer (“The Parties”) will base their future decisions regarding protection of the stratospheric ozone layer and climate from the production and consumption of ozone-depleting substances (ODSs) and their replacements.The Charge to the Assessment Panels
Specifically, Article 6 of the Montreal Protocol on Substances that Deplete the Ozone Layer states:
Beginning in 1990, and at least every four years thereafter, the Parties shall assess the control measures provided for in Article 2 and Articles 2A to 2I on the basis of available scientific, environmental, tech-nical and economic information.
To provide the mechanisms whereby these assessments are conducted, the Montreal Protocol further states: “. . . the Parties shall convene appropriate panels of experts” and “the panels will report their con-clusions . . . to the Parties.”
To meet this request, the Scientific Assessment Panel (SAP), the Environmental Effects Assessment Panel, and the Technology and Economic Assessment Panel each prepare, about every 3–4 years, major assessments that update the state of understanding in their purviews. These assessments are made available to the Parties in advance of their annual meetings at which they consider amendments and adjustments to the provisions of the Montreal Protocol.
Sequence of Scientific Assessments
The 2018 Assessment is the latest in a series of assessments prepared by the world’s leading experts in the atmospheric sciences and under the auspices of the Montreal Protocol in coordination with the World Meteorological Organization (WMO) and/or the United Nations Environment Programme (UN Environment). The 2018 Assessment is the ninth in the series of major assessments that have been prepared by the Scientific Assessment Panel as direct input to the Montreal Protocol process. The chronology of the nine scientific assessments of ozone depletion, along with other relevant reports and international policy decisions, are summarized in Table ES-1.
2018 Assessment Terms of Reference
The terms of reference of the 2018 Assessment were decided at the 27th Meeting of the Parties to the Montreal Protocol in Dubai, United Arab Emirates (1–5 November 2015) in their Decision XXVII/61:
5. To request the assessment panels to bring to the notice of the Parties any significant developments which, in their opinion, deserve such notice, in accordance with decision IV/13;
7. To request the Scientific Assessment Panel to undertake, in its 2018 report, a review of the sci-entific knowledge as dictated by the needs of the Parties to the Montreal Protocol, as called for in the terms of reference for the panels, taking into account those factors stipulated in Article 3 of the Vienna Convention, including estimates of the levels of ozone-layer depletion attributed to the re-maining potential emissions of ozone-depleting substances and an assessment of the level of global emissions of ozone depleting substances below which the depletion of the ozone layer could be comparable to various other factors such as the natural variability of global ozone, its secular trend over a decadal timescale and the 1980 benchmark level;
1 Decision XXVII/6: Potential areas of focus for the 2018 quadrennial reports of the Scientific Assessment Panel, the Environmental Effects
and in their Decision XXVII/72:
7. To request the Technology and Economic Assessment Panel and the Scientific Assessment Panel to continue their analysis of the discrepancies between observed atmospheric concentrations and reported data on carbon tetrachloride and to report and provide an update on their findings to the Twenty-Eighth Meeting of the Parties.
Significant developments since the 2014 Assessment that are included in the 2018 Assessment are (i) the adoption of the Kigali Amendment in 2016 to phase down global hydrofluorocarbon (HFC) production and consumption; (ii) the recognition of increased global emissions of CFC-11; and (iii) an improved understanding of the budget of carbon tetrachloride (CCl4).
The Assessment Process
The process of writing the current Assessment started early in 2016. The SAP co-chairs considered suggestions from the Parties regarding experts from their countries who could participate in the process. Further, an ad hoc interna-tional scientific advisory group was formed to suggest authors and reviewers from the world scientific community and to help craft the Assessment outline. As in previous Assessments, the participants represented experts from the developed and developing world who bring a special perspective to the process and whose involvement in the Assessment contributes to capacity building. The Appendix provides a listing of the approximately 280 scientists from 31 countries who contributed to the preparation and review of the Assessment.
An initial letter was sent to a large number of scientists and policy makers in November 2016 soliciting comments and inputs on a draft outline along with suggestions for authors for the 2018 Assessment. This was followed by revisions to the outline and recruitment of lead authors and co-authors. The steering committee and lead authors met in London, UK, in May 2017 to review the revised chapter outlines. The chapter writing process produced five drafts between mid-September 2017 and August 2018 aided by two author team meetings (Boulder, Colorado, USA and Les Diablerets, Switzerland). The first and third drafts were formally peer-reviewed by a large number of expert reviewers. The chapters were revised by the author teams based on the extensive review comments (numbering over 5000) and the review editors for each chapter provided oversight of the revision process to ensure that all comments were addressed appropriately.
At a meeting in Les Diablerets, Switzerland, held on 16–20 July 2018, the Executive Summary contained herein was prepared and completed by the 68 attendees of the meeting. These attendees included the steering committee, chapter lead authors, review editors, some chapter co-authors (selected by the chapter leads), reviewers (selected by the review editors), and some leading experts invited by the steering committee. The Executive Summary, initially drafted by the Assessment steering committee, was reviewed, revised, and approved line-by-line. The Highlights section was drafted during the meeting to provide a concise summary of the Executive Summary.
The success of the 2018 Assessment depended on the combined efforts and commitment of a large international team of scientific researchers who volunteered their time as lead authors, contributors, reviewers, and review editors and on the skills and dedication of the assessment coordinator and the editorial and production staff, who are listed at the end of this report.
Table ES-1. Chronology of scientific reports and policy decisions related to ozone depletion.
Year Policy Decisions Scientific Reports
1981 The Stratosphere 1981: Theory and Measurements. WMO No. 11.
1985 Vienna Convention Atmospheric Ozone 1985. Three volumes. WMO No. 16. 1987 Montreal Protocol
1988 International Ozone Trends Panel Report 1988.
Two volumes. WMO No. 18.
1989 Scientific Assessment of Stratospheric Ozone: 1989.
Two volumes. WMO No. 20. 1990 London Adjustment
and Amendment
1991 Scientific Assessment of Ozone Depletion: 1991. WMO No. 25.
1992 Methyl Bromide: Its Atmospheric Science, Technology, and Economics
(Montreal Protocol Assessment Supplement). UNEP (1992) 1992 Copenhagen Adjustment
and Amendment
1994 Scientific Assessment of Ozone Depletion: 1994. WMO No. 37.
1995 Vienna Adjustment 1997 Montreal Adjustment
and Amendment
1998 Scientific Assessment of Ozone Depletion: 1998. WMO No. 44.
1999 Beijing Adjustment and Amendment
2002 Scientific Assessment of Ozone Depletion: 2002. WMO No. 47.
2006 Scientific Assessment of Ozone Depletion: 2006. WMO No. 50.
2007 Montreal Adjustment
2010 Scientific Assessment of Ozone Depletion: 2010. WMO No. 52.
2014 Scientific Assessment of Ozone Depletion: 2014. WMO No. 55.
2016 Kigali Amendment
i
ntroDuction
The 1985 Vienna Convention for the Protection of the Ozone Layer is an international agreement in which United Nations States recognized the fundamental importance of preventing damage to the stratospheric ozone layer. The 1987 Montreal Protocol on Substances that Deplete the Ozone Layer and its succeeding amendments, adjustments, and decisions were subsequently negotiated to control the consumption and production of anthropogenic ozone-de-pleting substances (ODSs) and some hydrofluorocarbons (HFCs). The Montreal Protocol Parties base their deci-sions on scientific, environmental, technical, and economic information that is provided by their technical panels. The Protocol requests quadrennial reports from its Scientific Assessment Panel that update the science of the ozone layer. This Executive Summary (ES) highlights the key findings of the Scientific Assessment of Ozone Depletion: 2018, as put together by an international team of scientists. The key findings of each of the six chapters of the Scientific Assessment have been condensed and formulated to make the ES suitable for a broad audience.Ozone depletion is caused by human-related emissions of ODSs and the subsequent release of reactive halogen gases, especially chlorine and bromine, in the stratosphere. ODSs include chlorofluorocarbons (CFCs), bromine-c-ontaining halons and methyl bromide, hydrochlorofluorocarbons (HCFCs), carbon tetrachloride (CCl4), and methyl chloroform. The substances controlled under the Montreal Protocol are listed in the various annexes to the agree-ment (CFCs and halons under Annex A and B, HCFCs under Annex C, and methyl bromide under Annex E)3.
These ODSs are long-lived (e.g., CFC-12 has a lifetime greater than 100 years) and are also powerful greenhouse gases (GHGs). As a consequence of Montreal Protocol controls, the stratospheric concentrations of anthropogenic chlorine and bromine are declining.
In addition to the longer-lived ODSs, there is a broad class of chlorine- and bromine-containing substances known as very lived substances (VSLSs) that are not controlled under the Montreal Protocol and have lifetimes short-er than about 6 months. For example, bromoform (CHBr3) has a lifetime of 24 days, while chloroform (CHCl3) has a lifetime of 149 days. These substances are generally destroyed in the lower atmosphere in chemical reactions. In general, only small fractions of VSLS emissions reach the stratosphere where they contribute to chlorine and bro-mine levels and lead to increased ozone depletion.
The Montreal Protocol’s control of ODSs stimulated the development of replacement substances, firstly HCFCs and then HFCs, in a number of industrial sectors. While HFCs have only a minor effect on stratospheric ozone, some HFCs are powerful GHGs. Previous Assessments have shown that HFCs have been increasing rapidly in the atmo-sphere over the last decade and were projected to increase further as global development continued in the coming decades. The adoption of the 2016 Kigali Amendment to the Montreal Protocol (see Annex F) will phase down the production and consumption of some HFCs and avoid much of the projected global increase and associated climate change.
Observations of atmospheric ozone are made by instruments on the ground and on board balloons, aircraft, and satellites. This network of observations documented the decline of ozone around the globe, with extreme depletions occurring over Antarctica in each spring and occasional large depletions in the Arctic, and they allowed us to report some indications of recovery in stratospheric ozone in the 2014 Assessment. The chemical and dynamical processes controlling stratospheric ozone are well understood, with ozone depletion being fundamentally driven by the atmo-spheric abundances of chlorine and bromine.
Previous Assessments have shown projections of decreasing ODSs, and models show that global ozone should in-crease as a result. Models have also demonstrated that increasing concentrations of the GHGs carbon dioxide (CO2) and methane (CH4) during this century will cause global ozone levels to increase beyond the natural level of ozone observed in the 1960s, primarily because of the cooling of the upper stratosphere and a change of the stratospheric circulation. On the other hand, the chemical effect of increasing concentrations of nitrous oxide (N2O), another GHG, will be to deplete stratospheric ozone.
This 2018 Assessment is the ninth in a series that is provided to the Montreal Protocol by its Scientific Assessment Panel. In this Assessment, many of our previous Assessment findings are strengthened and new results are present-ed. A clear message of the 2018 Assessment is that the Montreal Protocol continues to be effective at reducing the atmospheric abundance of ODSs.
Terminology used in the Executive Summary
Equivalent effective stratospheric chlorine (EESC)
EESC is a metric for representing ODS levels in the stratosphere. It is calculated based upon three factors: surface atmospheric concentrations of individual ODSs and their number of chlorine and bromine atoms, the relative efficiency of chlorine and bromine for ozone depletion, and the time required for the substances to reach dif-ferent stratospheric regions and break down to release their chlorine and bromine atoms. As EESC continues to decrease in response to Montreal Protocol provisions, stratospheric ozone is expected to increase. In this Assessment, EESC does not include chlorine and bromine from very short-lived substances (VSLSs).
Representative concentration pathways (RCPs)
Representative concentration pathways (RCPs) were developed by the Intergovernmental Panel on Climate Change (IPCC) to help describe how climate change may evolve out to the year 2100. The RCPs define a timeline of atmospheric concentrations of greenhouse gases (GHGs) expressed in units of GtCO2-eq. The four pathways, RCP-2.6, RCP-4.5, RCP-6.0, and RCP-8.5, are labeled by the radiative forcing assumed for 2100 (i.e., RCP-2.6 has a global-mean radiative forcing from GHGs in 2100 of 2.6 W m-2). RCP-2.6 assumes that GHG emissions
will peak before 2020; RCP-4.5 assumes a peak around 2040; RCP-6.0 assumes a peak around 2080; and RCP-8.5 assumes no peak before 2100. Each scenario includes certain socio-economic assumptions about fossil-fuel use and other aspects related to GHG emissions.
Ozone-depleting substance (ODS)
An ODS is a substance that leads to stratospheric ozone depletion. Under the Montreal Protocol, most of the widely used ODSs are controlled under Annexes A, B, C, and E. These include, among others, chlorofluorocar-bons (CFCs), carbon tetrachloride (CCl4), methyl chloroform (CH3CCl3), halons, methyl bromide (CH3Br) and hydrochlorofluorocarbons (HCFCs). These ODSs typically have sufficiently long atmospheric lifetimes to reach the stratosphere after being emitted at the surface. Methyl bromide is the shortest-lived of the controlled sub-stances and has natural and anthropogenic sources. Other ODSs are not controlled under the Montreal Protocol.
Ozone depletion potential (ODP)
The Ozone Depletion Potential (ODP) is a metric for determining the relative strength of a chemical to destroy ozone. The ODP of a substance is defined as the ratio of the change in global ozone for a given mass emission of the substance to the change in global ozone for the same mass emission of CFC-11 (CFCl3). ODPs provide a direct method for comparing the impacts of specific substances on the ozone layer.
Halogenated very short-lived substances (VSLSs)
Halogenated very short-lived substances (VSLSs) have atmospheric lifetimes less than 0.5 year and yet make a contribution to stratospheric chlorine or bromine levels. As short-lived ODSs, a large fraction of VSLS emissions are destroyed in the troposphere, limiting the fraction of emissions that reaches the stratosphere and causes ozone depletion. VSLS emissions that occur in regions with rapid transport to the stratosphere will make an enhanced contribution to stratospheric halogen levels. Hence, the ODP of a VSLS is generally dependent on assumptions about the emission source region and time of the year of the emissions. VSLSs are not controlled under the Montreal Protocol.
Global warming potentials (GWPs)
The global warming potential (GWP) is a metric for determining the relative contribution of a substance to climate warming. GWP is defined as the ratio of the radiative forcing for a given mass emission of a substance relative to the same mass emission of CO2 summed over a given time period (typically 20 or 100 years). In this Assessment, a 100-yr time window is implied unless otherwise stated. For a given mass emissions of a substance, the CO2-equivalent (CO2-eq) value is defined as the emissions multiplied by the respective GWP value, noting that the GWP of CO2 is defined to be unity.
e
xecutive
S
ummAry
[1] Concentrations and trends in ozone-depleting substances (ODSs)
Total chlorine and total bromine
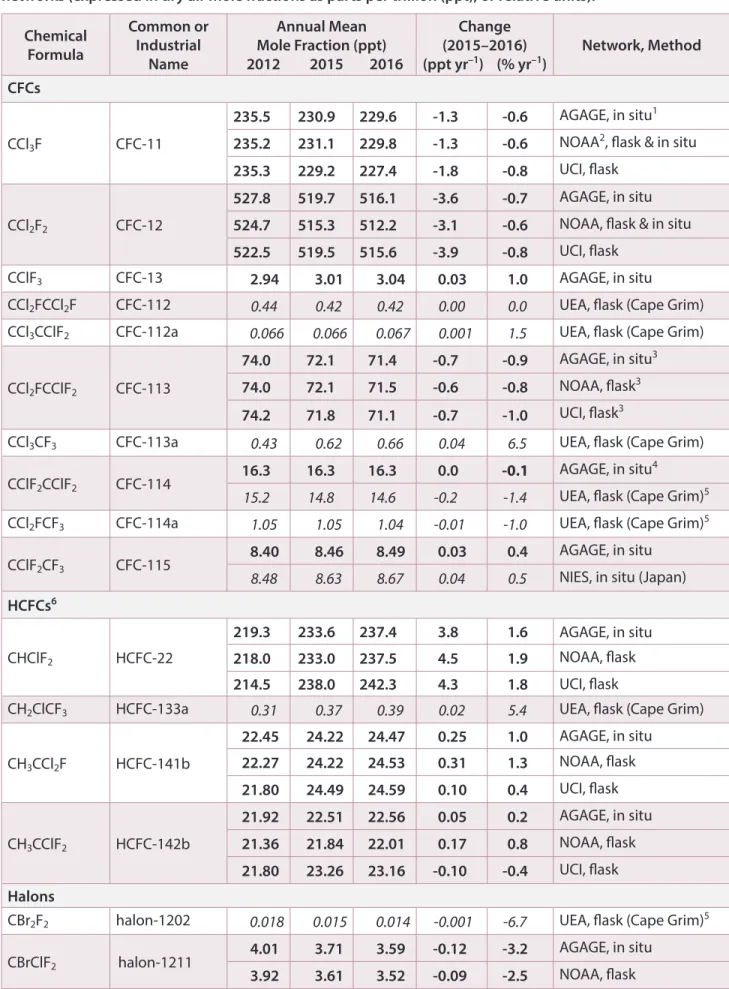
Our confidence that the Montreal Protocol is continuing to work is based on a sustained network of measurements of the long-lived source gas concentrations over several decades. These measurements allow the determination of global concentrations, their interhemispheric differences, and their trends. Combined with lifetime information, the data allow us to derive historical emissions which can be compared with emissions derived from data reported to UN Environment.
•
The atmospheric abundances of both total tropospheric chlorine and total tropospheric bromine from long-lived ODSs controlled under the Montreal Protocol have continued to decline since the 2014 Assessment (Figure ES-1, panels a, b; Table ES-2).•
During the period 2012–2016, the observed rate of decline in tropospheric chlorine due to controlled substances was 12.7 ± 0.9 ppt Cl yr-1, which is very close to the baseline projection from the 2014Assessment. The net rate of change was the result of a slower than projected decrease in CFC concentrations and a slower than projected increase in HCFCs relative to the 2014 scenario. That scenario was based on the maximum allowed production of HCFCs from Article 5 countries under the Montreal Protocol.
•
The decrease of chlorine from controlled substances has partly been offset by increases in the mainly natural CH3Cl and mainly anthropogenic very short-lived gases, which are not controlled under theMontreal Protocol.
National Oceanic and Atmospheric Administration National Aeronautics and Space Administration
United Nations Environment Programme World Meteorological Organization
1960 1980 2000 2020 2040 2060 2080 2100 0.2 0.6 1.0 1.4 1960 1980 2000 2020 2040 2060 2080 2100 0 1 2 3 4 EECl (ppb) CFC-11 eq (Mt yr -1)
Ozone (Dobson Units)
Ozone (Dobson Units)
(a) CFC-11 equivalent emissions
(c) Annual global total ozone
(d) October Antarctic total ozone
(b) Equivalent effective chlorine
280 285 290 295 halons CFC-113, -114, -115, CH3CCl3 CCl4 CFC-12 CFC-11 CH3Cl CH3Br 200 250 300 350 1960 1980 2000 2020 2040 2060 2080 2100 1960 1980 2000 2020 2040 2060 2080 2100
Timeline of ODSs and Ozone
Year
Table ES-2. Contributions of various long-lived ozone-depleting substances controlled under the Montreal
Pro-tocol to tropospheric organic chlorine and bromine in 2016, and annual average trends between 2012 and 2016.
Contribution to tropospheric chlorine and bromine in 20161
(ppt Cl/Br)
Changes in tropospheric chlorine and bromine (in parts per trillion (ppt) (Cl/Br) yr -1) from early-2012 to
late-2016
Controlled chlorine substances by group
chlorofluorocarbons (CFCs) 1979 −12.0 ± 0.4
methyl chloroform (CH3CCl3) 7.8 −2.0 ± 0.5
carbon tetrachloride (CCl4) 322 −4.5 ± 0.2
hydrochlorofluorocarbons (HCFCs) 309 +5.9 ± 1.3
halon-1211 3.6 −0.1 ± 0.01
Total Chlorine from controlled substances 2621 −12.7 ± 0.9
Controlled bromine substances by group
halons 7.8 −0.1 ± 0.01
methyl bromide (CH3Br)2 6.8 −0.04 ± 0.05
Total bromine from controlled substances 14.6 −0.15 ± 0.04
1 Values are annual averages. 2 Not all CH
3Br emissions are controlled. Some anthropogenic uses of CH3Br are exempted from Montreal
Protocol controls, and CH3Br has natural sources, which results in a natural background concentration.
Figure ES-1. Timeline of: a) CFC-11-equivalent emissions, b) equivalent effective chlorine, c) global total ozone, and d) October Antarctic total ozone. Annual CFC-11-equivalent emissions are computed for the ODSs shown
in the legend by multiplying mass emissions of a substance by its ODP (panel a). Historical emissions are derived from the measured atmospheric concentrations of individual ODSs from measurement networks. The future pro-jections of emissions assume full compliance with the Montreal Protocol and use standard methodologies based on reported production, inventory-estimates of the banks and release rates. The annual abundances of equivalent effective chlorine (EECl), shown for the global surface, are based on surface abundances (measured or derived from projected emissions and lifetimes) of the chlorine- and bromine-containing substances (panel b). The bro-mine abundances are weighted by a factor of 65 to account for the greater efficiency of brobro-mine in ozone destruc-tion reacdestruc-tions in the atmosphere. Global total column ozone represents an average over 60°N to 60°S latitudes
(panel c) and Antarctic total column ozone represents an average over 60°S to 80°S latitudes (panel d). Panels (c) and (d) include a comparison of chemistry-climate model results (black lines with gray shadings indicating
uncer-tainty ranges) and available observations (data points). The model projections into the future assume compliance with the Montreal Protocol and an increase in GHGs following the RCP-6.0 scenario. The lines with arrows mark when CFC-11-equivalent emissions (a), EECl (b) and ozone abundances (c and d) return to their 1980 values. [Data sources are: panel (a) mixing ratios in Figure 6-2 and ODPs and lifetimes in Table A-1; panel (b) following Figure 6-2 with an alpha factor of 65; panel (c) Figure 3-28; and panel (d) Figure 4-18.]
Unexpected increase in global total emissions of CFC-11
Observations of the persistent slowdown in the decline of CFC-11 concentrations have only recently allowed the robust conclusion that emissions of CFC-11 have increased in recent years, as opposed to other possible causes for the slowdown such as changing atmospheric circulation.
•
Global CFC-11 emissions, derived from measurements by two independent networks, increased after 2012 contrary to projections from previous Assessments, which showed decreasing emissions (Figure ES-2). This conclusion is supported by the observed rise in the CFC-11 hemispheric concentration differ-ence. Global CFC-11 emissions for 2014 to 2016 were approximately 10 Gg yr-1 (about 15%) higher than thefairly constant emissions derived for 2002 to 2012; the excess emissions relative to projected emissions for recent years is even larger. The increase in global emissions above the 2002–2012 average resulted in a global concentration decline in CFC-11 over 2014 to 2016 that was only two-thirds as fast as from 2002 to 2012.
•
The CFC-11 emission increase suggests new production not reported to UN Environment becausethe increase is inconsistent with likely changes in the release of CFC-11 from banks associated with pre-phaseout production. Depending on how this newly produced CFC-11 is being used, substantial in-creases in the bank and future emissions are possible.
•
Emissions of CFC-11 from eastern Asia have increased since 2012; the contribution of this region to the global emission rise is not well known. The country or countries in which emissions have increased have not yet been identified.Figure ES-2. CFC-11 global emissions and reported production. Emissions of
CFC-11 derived from AGAGE (Advanced Global Atmospheric Gases Experiment; black) and NOAA (National Oceanic and Atmospheric Administration; red) global network mea-surements of CFC-11 concentrations (see also Figure 1-4 of the Assessment) and a model using a CFC-11 lifetime of 52 years. Also shown are the production history reported to UN Environment for all uses (green), the average of annual emissions over the 2002–2012 period (grey line), and scenario projections based on observations through 2006 or through 2012 (dotted and dashed lines). These emis-sion projections are calculated using standard methodologies based on reported production, inventory estimates of the bank, and an empir-ically determined release fraction from the bank over the seven years before 2006 or 2012,
which is then applied to subsequent years (see Chapter 1 and Chapter 6). Uncertainties in emissions, shown as vertical lines on the data points, include the influence of measurement and model representation uncertainties. The uncertainties are smaller than those presented in Figure 1-4, because uncertainties related to factors con-stant across the whole time period, such as lifetimes and calibration scale, have been omitted.
Derived emissions AGAGE observations NOAA observations 2002–2012 mean Emission projections Starting in 2006 Starting in 2012 Reported production CFC-11 Annual Emissions and Production
Annual emission or produc
tion ( Gg yr -1) 120 0 20 40 60 80 100 140 1995 2000 2005 2010 2015 Year
Persistent emissions of low abundance CFCs
•
Observation-based analyses show unexpected stable or even increasing emissions of some of the low abundance (less than 20 ppt) CFCs (CFC-13, CFC-113a, CFC-114, CFC-115) between 2012 and 2016. For CFC-114 and CFC-115, atmospheric observations imply that a substantial fraction of global emissions originated from China.Ongoing substantial emissions of carbon tetrachloride (CCl
4)
•
Sources of significant CCl4 emissions, some previously unrecognized, have been quantified. At least 25 Gg yr-1 of emissions have been estimated, mainly originating from the industrial production ofchloro-methanes, perchloroethylene and chlorine. This value can be compared with total global emissions of ap-proximately 35 Gg yr-1, derived from atmospheric observations. The global CCl
4 budget is now much better
understood and the previously identified gap between observation-based and industry-based emission esti-mates has been substantially reduced compared to the 2014 Assessment.
Hydrochlorofluorocarbons (HCFCs)
•
Total chlorine from HCFCs has continued to increase in the atmosphere since the last Assessment and reached 309 ppt in 2016. The annual average growth rate of chlorine from HCFCs decreased from 9.2 ± 0.3 ppt yr-1 for the 2008 to 2012 period to 5.9 ± 1.3 ppt yr-1 for the 2012 to 2016 period.•
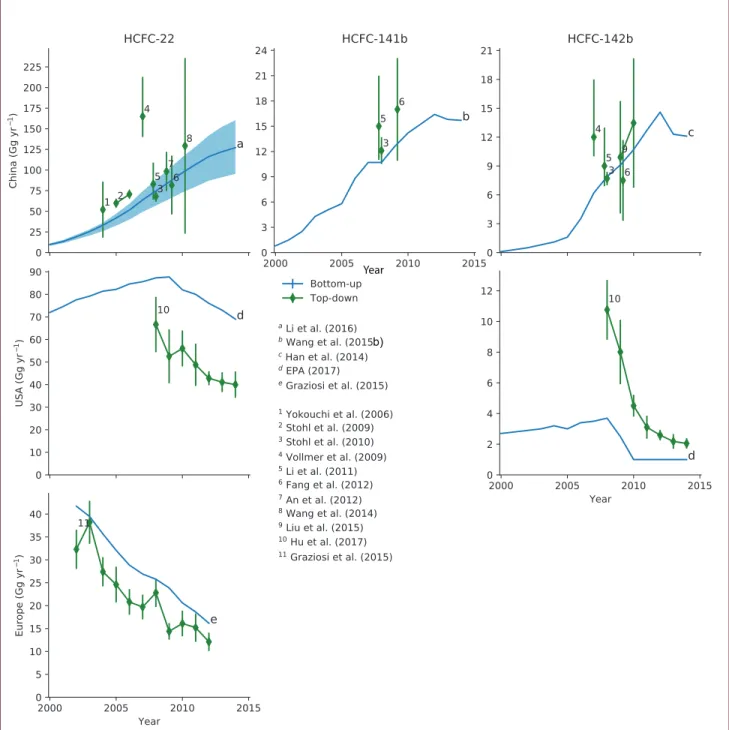
Combined emissions of the major HCFCs have declined since the last Assessment which suggests an ef-fective response to the 2007 Adjustment to the Montreal Protocol that limited HCFC emissions. Annual emissions of HCFC-22 have remained relatively unchanged since 2012, whilst emissions of HCFC-141b and-142b declined by around 10% and 18%, respectively, between 2012 and 2016. These findings are consis-tent with a decrease in reported HCFC consumption after 2012, particularly from Article 5 countries.Tropospheric bromine
•
Total tropospheric bromine from controlled ODSs (halons and methyl bromide) continued to decrease and by 2016 was 14.6 ppt, 2.3 ppt below the peak levels observed in 1998. In the 4-year period prior to the last Assessment, this decrease was primarily driven by a decline in methyl bromide (CH3Br) abundance, with a smaller contribution from a decrease in halons. These relative contributions have now reversed, with halons being the main driver of the decrease of 0.15 ± 0.04 ppt yr-1 tropospheric bromine between 2012 and 2016.•
Total bromine from halons has decreased from a peak of 8.5 ppt in 2005 to 7.7 ppt in 2016. Emissions ofhalons derived from atmospheric observations declined or remained stable between 2012 and 2016 and are
thought to originate primarily from banks.
•
The atmospheric abundance of CH3Br declined from a peak of 9.2 ppt in 1996–1998 to 6.8 ppt in 2016as a consequence of controls under the Montreal Protocol. By 2016, controlled CH3Br consumption had declined by more than 98% from its peak value. Reported consumption in quarantine and pre-shipment (QPS) uses of CH3Br, which are not controlled under the Montreal Protocol, has not changed substantially over the last two decades. Total reported anthropogenic emissions (controlled and not-controlled) have declined by about 85% from the peak value, and atmospheric CH3Br abundance is now near the expected natural background.
Halogenated very short-lived substances (VSLSs)
Halogenated VSLS substances contribute to stratospheric chlorine and bromine loading and are not controlled by the Montreal Protocol. Chlorinated VSLSs are predominantly of anthropogenic origin, while brominated VSLSs have mainly natural sources.
•
Dichloromethane (CH2Cl2) is the main component of VSLS chlorine and accounts for the majority of the rise in total chlorine from VSLSs between 2012 and 2016. A substantial fraction of the global CH2Cl2 emissions has been attributed to southern and eastern Asia. The current estimate is that total chlorine from VSLS source gases increased by about 20 ppt between 2012 and 2016 to reach 110 ppt (Figure ES-3). The growth rate shows large interannual variability.•
Several field campaigns conducted since the last Assessment have confirmed that brominated VSLSs contribute 5±2 ppt to stratospheric bromine (Figure ES-3). There is no indication in measurements of a long-term trend in the contribution of VSLSs to stratospheric bromine.Total stratospheric chlorine and bromine
Total stratospheric chlorine and bromine both continue to decline. Even though the abundance of bromine is much smaller than that of chlorine, bromine has a significant impact because it is around 60–65 times more efficient than chlorine in destroying ozone.
•
Total chlorine entering the stratosphere from well-mixed ODSs declined by 405 ppt (12%) between the 1993 peak (3582 ppt) and 2016 (3177 ppt). (Figure ES-3) This decline was driven by decreasing atmo-spheric abundances of methyl chloroform (CH3CCl3), CFC-11 and CCl4 (in order of importance). The VSLS contribution (primarily anthropogenic) has increased over this period but remains below 4% of the total in 2016. About 80% of the chlorine entering the stratosphere annually is of anthropogenic origin.•
Total bromine entering the stratosphere from well-mixed ODSs declined by 2.4 ppt (15%) between the 1998 peak (16.9 ppt) and 2016 (14.5 ppt). (Figure ES-3) This decline was driven by decreasing atmospher-ic abundances of methyl bromide (CH3Br), halon-1211, and halon 2402 (in order of importance). The VSLS (primarily biogenic) contribution has no measurable change over this period, contributing about 25% to the total in 2016. The natural components of CH3Br and VSLSs now contribute more than half of the bromine entering the stratosphere annually.•
HCl is the major chlorine component in the upper stratosphere. Its concentration in this region de-creased by about 6% between 2005 and 2016. This decrease is consistent with the decline in total chlorine entering the stratosphere.•
Total stratospheric bromine derived from bromine monoxide (BrO) observations decreased by about 8% from 2004 to 2014. This decrease is consistent with the decline in total bromine entering the stratosphere.[2] Hydrofluorocarbons (HFCs)
The Montreal Protocol phaseout of ODSs has led to the development of alternative substances for use in many sector applications. Hydrofluorocarbons (HFCs) are a widely used category of ODS alternatives that do not contain ozone-de-pleting chlorine or bromine. Long-lived CFCs, HCFCs, and HFCs are all potent greenhouse gases. Ultimately the Kigali Amendment to the Montreal Protocol, which was adopted in 2016 and will come into force in 2019, sets schedules for the phasedown of global production and consumption of specific HFCs. Although the radiative forcing supplied by atmospheric HFC abundances is currently small, the Kigali Amendment is designed to avoid unchecked growth in emissions and associated warming in response to projected increasing demand in coming decades. Discussed here are the anticipated overall effects of Kigali Amendment controls and existing national and regional HFC regulations on future HFC abundances and associated climate warming. HFCs were included as one group within the basket of gases of the 1997 Kyoto Protocol and, as a result, developed (Annex-I) countries supply annual emission estimates of HFCs to the United Nations Framework Convention on Climate Change (UNFCCC). HFC-23 is considered separately in the Kigali Amendment and in this Assessment, primarily because it is emitted to the atmosphere as a by-product of HCFC-22 production. HFC-23 has one of the longest atmospheric lifetimes and highest global warming potentials (GWP) among
Observed HFC abundances and associated emissions
•
Atmospheric abundances of most currently measured HFCs are increasing in the global atmosphere. These increases are similar to those projected in the baseline scenario of the 2014 Assessment. HFC emis-sions derived from observations increased by 23% from 2012 to 2016 and currently amount to about 1.5% of total emissions from all long-lived greenhouse gases as carbon dioxide-equivalent emissions (GtCO2-eq).Figure ES-3. Total chlorine and bromine entering the stratosphere from well-mixed ODSs and VSLSs.
These partitioned columns show the contributions of various chlorine-containing (left) and bromine-containing (right) substances from natural and human-related sources as derived from surface observations. The displayed amounts are representative of air entering the stratosphere in 2016 and in 1993 or 1998, when chlorine and bromine global abundances were near their respective peak values. Note the large difference between the total abundances of chlorine and bromine. The percentage decline or increase of the abundance of each substance in 2016 relative to the peak year and the total change are shown. Horizontal lines divide natural and human-related contributions. Both total chlorine and bromine have declined substantially from respective peaks in the 1990s (10% and 11%, respectively, when considering the sum of well-mixed ODSs and VSLSs). Human activities are the largest source of chlorine entering the stratosphere and CFCs are the largest fraction of the total; the human
con-tribution to total chlorine is 14% lower in 2016 compared to 1993. Methyl chloride (CH3Cl) is the largest natural
source of chlorine. VSLS chlorine species from human activities are a small fraction of total chlorine (less than
a few percent). Methyl bromide (CH3Br) and halons are the primary sources of stratospheric bromine. Methyl
bromide has both natural and human sources whereas halons are entirely due to human activity. The human contribution to total bromine is 22% lower in 2016 compared to 1998. Bromine from VSLSs is entirely of natural origin and is assumed constant at 5 ppt since 1998. In 2016, the sum of bromine from natural methyl bromide and VSLSs supplied more than half of the total entering the stratosphere. Chlorine compounds labeled ‘Other ODSs’
include minor CFCs and halon-1211. Other chemical terms are carbon tetrachloride (CCl4) and methyl chloroform
(CH3CCl3). Bromine compounds labeled ‘Other Halons’ include halon-1202 and halon-2402. In the vertical axes
label, ‘ppt’ denotes atmospheric abundance in units of parts per trillion. [Derived from Figure 1-17 and Table 6-4]
1993 2016 0 1000 2000 3000 4000 Human Sources Natural Sources Totals 3660 −10%3290 % change VSLS: +44% CH3CCl3: −98% Other ODS: +9.0% CFC-113: −13% HCFCs: +175% CCl4: −23% CFC-11: −14% CFC-12: +0.2% CH3Cl: +1.1% Total Chlorine (ppt) 1998 2016 0 5 10 15 20 Human Sources Total Bromine (ppt) Natural Sources Totals 22.0 19.6 −11% % change Other Halons: −21% Halon-1301: +23% Halon-1211: −8.2% CH3Br Human: −68% CH3Br Natural: 0% VSLS: 0%
•
HFC emissions estimated from the combination of inventory reporting and atmospheric observations indicate that the HFC emissions originate from both developed and developing countries. Only devel-oped (Annex I) countries are required to report HFC emissions to the UNFCCC, and these reported totals account for less than half of global emissions (as CO2-eq) derived from observations.•
Radiative forcing from measured HFCs continues to increase; it currently amounts to 1% (0.03 W m-2)of the 3 W m-2 supplied by all long-lived greenhouse gases (GHGs) including CO
2, CH4, N2O, and
halo-carbons. Total HFC radiative forcing in 2016 was about 10% of the 0.33 W m-2 supplied by all halocarbons.
•
Global annual emissions of HFC-23, a potent greenhouse gas and a byproduct of HCFC-22 production,have varied substantially in recent years. This variability in observationally derived global emissions is broadly consistent with the sum of reported HFC-23 emissions associated with HCFC-22 production from developed countries and inventory-based estimates of HFC-23 emissions from developing countries. Future HFC-23 emission trends will largely depend on the magnitude of HCFC-22 production and the effective-ness of HFC-23 destruction associated with that production.
•
Some short-lived, low-GWP replacement substances for long-lived HCFCs and HFCs have been detect-ed in the atmosphere (at concentrations typically below 1 ppt), consistent with the transition to these substances being underway. Some of these substances are unsaturated HCFCs and unsaturated HFCs, alsoknown as hydrofluoroolefins or HFOs.
Projections of HFC emissions and temperature contributions
•
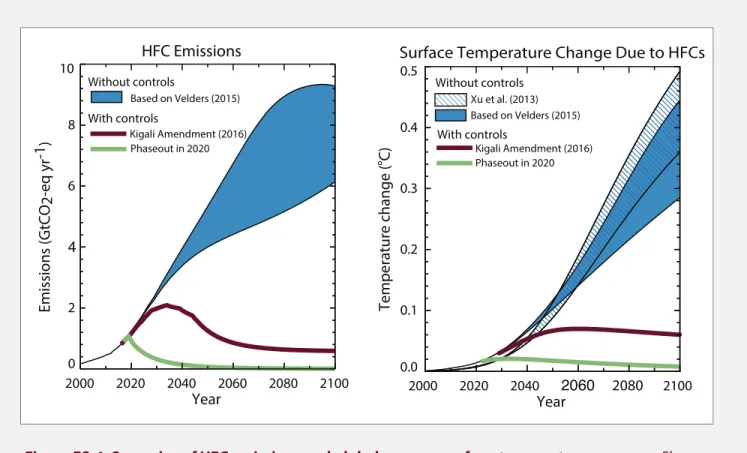
The HFC phasedown schedule of the 2016 Kigali Amendment to the Montreal Protocol substantially reduces future projected global HFC emissions (Figure ES-4). Emissions are projected to peak before 2040 and decline to less than 1 GtCO2-eq yr-1 by 2100 (Figure ES-4). Only marginal increases are projectedfor CO2-eq emissions of the low-GWP alternatives (Figure ES-5)despite substantial projected increases in their emission mass.
•
The Kigali Amendment, assuming global compliance, is projected to reduce future radiative forcing due to HFCs by about 50% in 2050 compared to a scenario without any HFC controls. The estimated benefit of the amendment is the avoidance of 2.8 - 4.1 GtCO2-eq yr-1 emissions by 2050 and 5.6 - 8.7 GtCO2
-eq yr-1 by 2100. For comparison, total CH
4 emissions are projected to be 7 - 25 GtCO2-eq yr-1 by 2100 in the
RCP-6.0 and RCP-8.5 scenarios and total N2O emissions 5-7 GtCO2-eq yr-1 by 2100.
•
The Kigali Amendment is projected to reduce future global average warming in 2100 due to HFCs from a baseline of 0.3-0.5 oC to less than 0.1 oC (Figure ES-4). If the global production of HFCs were to cease in 2020, the surface temperature contribution of the HFC emissions would stay below 0.02 oC for thewhole 21st century. The magnitude of the avoided temperature increase, due to the provisions of the Kigali Amendment (0.2 to 0.4 oC) is substantial in the context of the 2015 UNFCCC Paris Agreement, which aims
to limit global temperature rise to well below 2.0 oC above pre-industrial levels and to pursue efforts to limit
the temperature increase even further to 1.5 oC.
[3] Stratospheric ozone
The Montreal Protocol and its Amendments and Adjustments have been effective in limiting the abundance of ODSs in the atmosphere. Detecting and attributing ozone trends during this period of slow ODS decline is challenging because of large natural variability in ozone, as well as confounding factors such as climate change and changes in tropospheric ozone. While most natural variability is quasi-periodic, episodic volcanic eruptions can drive large changes in ozone in the presence of elevated halogen abundances. The Antarctic and the upper stratosphere, where the ozone depletion signal has been clearest against the backdrop of natural variability, are now showing evidence of recovery. Although the
Arctic stratosphere is warmer and experiences much more meteorological variability, severe chemical ozone loss can occur when cold conditions persist into March/April (Figure ES-6). Ozone in the tropical lower stratosphere shows little response to changes in ODSs, because halogen-driven ozone depletion is small in this region.
Antarctic and Arctic ozone
•
For the first time, there are emerging indications that the Antarctic ozone hole has diminished in size and depth since the year 2000, with the clearest changes occurring during early spring. Although ac-counting for natural variability is challenging, the weight of evidence suggests that the decline in ODSs made a substantial contribution to the observed trends.•
Even with these early signs of recovery, an Antarctic ozone hole continues to occur every year, with the severity of the chemical loss strongly modulated by meteorological conditions (temperatures and winds) (Figure ES-1). In 2015, the ozone hole was particularly large and long-lasting, as a result of a cold and undisturbed polar stratospheric vortex. Aerosols from the Calbuco volcanic eruption are also believed to have contributed to the large ozone hole area in 2015. Conversely, in 2017, the Antarctic ozone hole was very small due to a warm and unusually disturbed polar vortex.Figure ES-4. Scenarios of HFC emissions and global average surface-temperature response. Shown
are global HFC scenarios without global HFC controls and with full compliance with the Kigali Amendment. Also shown is a scenario in which global production of HFCs is phased out in 2020. For comparison, the global surface temperature from all greenhouse gases is projected to increase, relative to the 1986–2005 average, by between 1.4 °C and 4.8 °C by the end of the 21st century in the RCP-6.0 and RCP-8.5 scenarios. The contribution from HFC-23 emissions is not included here. [Figure adapted from Figure 2-20]
HFC Emissions 2000 2020 2040 2060 2080 2100 Year 0.0 0.1 0.2 0.3 0.4 0.5
Surface Temperature Change Due to HFCs
Without controls Xu et al. (2013) Based on Velders (2015) Kigali Amendment (2016) Phaseout in 2020 With controls Temperature change (C) 2000 2020 2040 2060 2080 2100 Year 0 2 4 6 8 10 Without controls Based on Velders (2015) Kigali Amendment (2016) Phaseout in 2020 With controls Emissions (GtCO 2-eq yr -1)
Figure ES-5. Historical and projected emissions, radiative forcing and surface temperature from ODSs, HFCs, and HFC alternatives. Historical and projected contributions to climate change are shown for ODSs and
high-GWP HFCs (excluding HFC-23) assuming full compliance with the provisions of the Montreal Protocol, including the Kigali Amendment. Also shown are projections for low-GWP alternatives. Quantities shown are
the (a) mass emissions, (b) CO2-eq emissions, (c) radiative forcing and (d) contributions to surface temperature
change, with a dashed vertical line indicating 2016. The surface temperature response is calculated with a param-eterized climate model. Note that the values for low-GWP alternatives in the bottom three panels (yellow lines) are sufficiently small that they require enlargement to be visible to the reader. [Figure adapted from Figures 2-20 and 6-8]
Climate Change: ODSs, HFCs, Alternatives
1950 1975 2025 2050 2075 2100 0 1 2 3 5
6 (a) Emissions (mass)
Low-GWP alternatives: Upper range Low-GWP alternatives: Lower range High-GWP HFCs ODSs 19500 1975 2000 2025 2050 2075 2100 10 12 (b) CO 2-eq emissions 1950 1975 2000 2025 2050 2075 2100 (c) Radiative forcing 1950 1975 2000 2025 2075 2100 0.0 Degrees Celsius (d) Surface temperature GtCO 2 -eq yr -1 W m -2 Mt yr -1 2050 Year 2000 0.0 0.1 0.2 0.3 0.4 0.5 8 6 4 2 4 0.3 0.2 0.1
•
In the Arctic, year-to-year variability in column ozone is much larger than in the Antarctic, preclud-ing identification of a statistically significant4 increase in Arctic ozone over the 2000–2016 period. Exceptionally low ozone abundances, similar to those experienced in Arctic spring 2011, have not been observed in the last four years. Extremely cold conditions in the 2015/2016 winter resulted in rapid chemical ozone loss, but a sudden warming of the polar stratosphere in early March curtailed further losses.4 The term ‘statistically significant’ indicates that there is a very high likelihood (above some confidence limit that is typically 95%) that a
quantity has undergone a change over a given time period and has not simply exhibited variability around an unchanged state. For a more detailed discussion of trend uncertainties, see Chapter 3.
Figure ES-6. Observed and modeled column ozone in the Arctic. Without the success of the Montreal Protocol,
a deep ozone hole could have formed in the Arctic in 2011, and smaller Arctic ozone holes would have become a regular occurrence. The 2010/2011 Arctic winter had unusually persistent low temperatures in the stratosphere that led to strong chemical ozone destruction. Satellite observations from the Ozone Monitoring Instrument (OMI) in March 2011 show a region of low column ozone surrounded by regions of higher ozone (panel (a)). The March observations are well simulated by a chemistry-transport model run with observed abundances of ODSs, as seen by comparing the maps of panels (a) and (b) as well as the black and blue curves in panel (d), which show the measured and modeled timelines for the mid-2010 to mid-2011 period of daily minimum column-ozone val-ues in the Arctic region (latitudes greater than 45°N). If the same model is run with projected ODS abundances in the absence of Montreal Protocol controls, a much more severe and prolonged Arctic ozone hole is seen (panel
(c) and the red curve in panel (d)). [See also Figure 4-17]
July Sept Nov Jan Mar May July 100
150 200 250
300
– with Montreal Protocol
Observed and Modeled Arctic Ozone
2010 2011
–
– without Montreal Protocol
Model:
Observations Observed column ozone
on March 26, 2011
M
inimum column ozone (DU)
Modeled ozone (with Montreal Protocol) on March 26, 2011
(a) (b)
(c)
Modeled ozone (without Montreal Protocol) on March 26, 2011 (d) 450 425 400 375 350 325 275 250 225 200 175 150
Column ozone (DU)
•
Model simulations show that implementation of the Montreal Protocol has prevented much more se-vere ozone depletion than has been observed in the polar regions of both hemispheres (Figure ES-6).Global ozone
•
No statistically significant trend has been detected in global (60°S–60°N) total column ozone over the 1997–2016 period (Figure ES-1). Average global total column ozone in the years since the last Assessment remain roughly 2.2% below the 1964–1980 average. These findings are expected given our understanding of the processes that control ozone.○ In the mid-latitudes, the increase in ozone expected to arise from the 15% decline in EESC since 1997 is small (1% per decade) relative to the year-to-year variability (about 5%).
○ In the tropics, where halogen-driven ozone loss is small in the lower stratosphere, total column ozone has not varied significantly with ODS concentrations, except under conditions of high volcanic aerosol loading (e.g., Mt. Pinatubo).
•
Upper stratospheric ozone, which represents only a small fraction of the total column, has increased by 1–3% per decade since 2000 outside of polar regions (Figure ES-7).Additional and improved data sets and focused studies evaluating trend uncertainties have strengthened our ability to assess ozone pro-file changes since the last Assessment. The upward trend is largest and statistically significantin northern mid-latitudes and maximizes above 40-km altitude.○ Model simulations attribute about half of the observed upper stratospheric ozone increase after 2000 to the decline of ODSs since the late 1990s.
○ The other half of the ozone increase is attributed to the slowing of gas-phase ozone destruction, which results from cooling of the upper stratosphere caused by increasing GHGs.
•
There is some evidence for a decrease in global (60°S–60°N) lower stratospheric ozone from 2000 to 2016, but it is not statistically significant in most analyses. Much of the apparent decline in the tropicsFigure ES-7. Ozone trends in the stratosphere. The largest
relative depletion of ozone out-side the polar regions occurred prior to 1997 in the northern mid-latitude, upper stratosphere
(left panel). The largest recovery
has occurred in the same region, with an upward trend of about 3% per decade since 2000 above 40-km altitude (right panel). Ozone trends derived from sat-ellite observations are shown in brown, with uncertainty ranges given by horizontal lines. Ozone trends derived from a set of chemistry-climate models are shown in orange, with the model variance given by the yellow envelope. Ozone trends from chemistry-climate models agree very well with the measured trends. [See also Figure 3-23]
–15 –10 –5 0 5 Ozone trend 1985–1996 (% per decade) –5 0 5 Ozone trend 2000–2016 (% per decade) 100 10 1 Pressure (hPa) 20 30 40 50 Altitude (km)
Northern Mid-Latitude Ozone Trends
Average ozone from35°N to 60°N Satellite observations with uncertainty Model results with variance