HAL Id: hal-01007381
https://hal.archives-ouvertes.fr/hal-01007381
Submitted on 16 Jun 2014HAL is a multi-disciplinary open access
archive for the deposit and dissemination of sci-entific research documents, whether they are pub-lished or not. The documents may come from
L’archive ouverte pluridisciplinaire HAL, est destinée au dépôt et à la diffusion de documents scientifiques de niveau recherche, publiés ou non, émanant des établissements d’enseignement et de
Thermal properties of polycrystals
Sylvain Fréour, David Gloaguen, Manuel Francois, Ronald Guillén
To cite this version:
Sylvain Fréour, David Gloaguen, Manuel Francois, Ronald Guillén. Thermal properties of polycrystals: X-ray diffraction and scale transition modelling. physica status solidi (a), Wiley, 2003, 201 (1), pp.59-71. �10.1002/pssa.200306732�. �hal-01007381�
Thermal properties of polycrystals – X-ray diffraction
and scale transition modeling
S. Fréour1, D. Gloaguen*, 1, M. François2, and R. Guillén1 1
Laboratoire d’Applications des Matériaux à la Mécanique (L.A.M.M.), L.A.M.M. – C.R.T.T., Boulevard de l’Université, BP 406, 44602 Saint Nazaire, France
2
Laboratoire des Systèmes Mécaniques et d’Ingénierie Simultanée (L.A.S.M.I.S.), Université de Technologie de Troyes, 12 Rue Marie Curie, BP 2060, 10010 Troyes, France
The development of thermal residual stresses was investigated in polycrystalline materials. Two comple-mentary ways were used: the experimental values obtained by X-ray diffraction were compared to the re-sults predicted by self-consistent scale transition approaches. First, single-phase materials were consid-ered. The model was checked through the experimental study of rolled textured polycrystalline α-Zr and α-Ti with hexagonal closed packed structure. The level and the influence of the thermal stresses on the macroscopic behaviour have been quantified. In a second part, the model was extended to the case of two-phase materials. A new approach was developed in order to characterize the coefficient of thermal expan-sion (CTE) of phases embedded in multiphase materials. The analysis of the problem was based on the coupling of numerical simulations with thermo-elastic scale transition models and experiments. The whole approach was finally checked through the study of an Al-50%vol.-SiC-50%vol. MMC. The CTE of Silicon Carbide were determined as a function of the temperature. Simulated results obtained show a very good agreement with experimental values available in the literature.
1 Introduction
The mechanical behaviour, performance [1] and durability [2] of materials are strongly related to the presence and the amount of residual stresses. Thermal treatments are fundamental steps in metal forming. During cooling processes, residual stresses appear under specific conditions. The magnitude and the sign of these stresses are strongly related to the CTE of the grains and phases constituting the material. In fact, in single-phase polycrystals, thermal stresses are only due to single-crystals CTE anisotropy. In multi-phase materials, however, inter-multi-phase thermal heterogeneities are involved in residual stresses increase during the cooling phase of heat treatments. Therefore, in order to develop materials with reliable and enhanced properties, it is necessary to understand the nature and the source of this residuals stresses. This can be investigated either through experimental techniques [3], or scale transition models [4].
One of the purposes of the present work is to compare X-ray diffraction measurements and Self-Consistent approaches. The complementarities of the methods will be demonstrated, especially in terms of results interpretations.
The CTE of a given phase, when it is embedded in a multiphase structure is also studied in section 5. The crucial question of the deviation between the CTE of the single-phase and those of the same phase included in a heterogeneous matrix will be examined. According to a preceding study performed in pure
elasticity [5], this groundwork will be used in order to implement the classical self-consistent thermo-elastic formalism. A solution will be proposed in order to characterize the CTE of a phase embedded in a multiphase material.
2 Self consistent estimates
2.1 Constitutive equationsAccording to the original formalism introduced by Kröner in pure elasticity [6], Self-Consistent (SC) estimates are suitable to deal with the question of heterogeneous materials such as polycrystals or Metal Matrix Composites (MMC) [7 – 8]. The models are based on a statistical description of the material. SC approaches are particularly adapted to represent aggregates of crystalline grains exhibiting local variations of their properties which arise from the crystallographic texture. Moreover, the formalism takes into account the elastic and/or thermal heterogeneities due to inter-phase heterogeneities, when the material is composed of two or more phases.
The material will be considered at four different scales:
– the macroscopic scale, denoted by the superscriptI. The so-called Homogeneous Effective Medium (HEM) is assumed to have the average properties of the multiphase polycrystalline aggregate.
– the pseudo-macroscopic scale, denoted by the superscriptsα,β and so on. It represents the average properties of the considered α (or β, ...) phase.
– The mesoscopic scale, denoted by the superscriptII. This level of the representation exhibits the ani- sotropic properties of an inclusion of a given phase. The orientation of a crystallite is expressed by the letter Ω.
– The microscopic scale, denoted by the superscriptIII. The properties is defined at the level of the crystal structure. For example, eIII
is the intragranular microstrain defined as the position dependent deviations from the average strain of the crystal: eIII(X) = e (X) – eI – eII(X). Where e (X) is the total
elastic strain for a grain at the position X.
Other aspects of this four level scheme can be found in Ref. [9 – 10].
Let us consider a pure thermo-elastic response of the material. In the SC approach, the aggregate is replaced by a HEM exhibiting the same thermo-elastic response and each grain is treated as an heteroge-neity with different elastic and thermal properties. The thermal dilatation created by a temperature in-crement δT is considered as a stress-free strain. The stresses respectively induced in the grains (sΙΙ), the multiphase polycrystal (sΙ) and a particular phase e.g. α(sα) are linked to the temperature and strains as follows:
( )
(
( )
)
II II T α Ω α Ω = ii − δ s c e m , (1)(
)
I I I I T = ii − δ s C e M , (2)(
T)
α = αii α − α δ s C e M . (3)Note that the temperature field is assumed uniform whatever the scale considered.
In the preceding Eqs. (1 – 3), e refers to the strains. One will obtain straightforwardly the strains from
(1 – 3) through elementary algebra.
cα, Cαand CI are the elastic stiffnesses, respectively at mesoscopic, pseudo-macroscopic and macro-scopic scales, whereas mα, Mα and MI denote the corresponding Coefficients of Thermal tensors.
A⋅ B denotes the double scalar product AijklBklmn.
SC simulation framework is based on a scale transition formalism. For ellipsoidal inclusions, mesoscopic stresses and strains are uniform in an inclusion and linearly related to the macroscopic stresses and strains through the well-known interaction Eq. [11]:
(
)
II− I = − Iii Iii II− I
C R
Where the so-called reaction tensor RI will be easily obtained from the knowledge of the morphology of the crystallites and the average properties of the HEM:
(
)
(
1)
I 1 I 1 esh esh − − − = − ii = − ii R I S S C E E . (5)Hill’s tensor E expresses the local interactions depending on the morphology assumed for the
crystal-lites [12]. It is linked to Eshelby tensor Sesh by E = CI⋅ Sesh. I is the fourth order identity tensor. Accord-ing to (1 – 5), the strains in a crystallite will follow:
( )
1(
)
( )
( )
II I I I I I I I I . T α Ω − α Ω α Ω =c +C iiR ii C +C iiR iiε +c iim −C iiM δ e (6)In another main paper, Hill demonstrated the following useful average equations [13]: II I II I . = = s s e e (7)
The pseudo-macroscopic scale has previously been defined by the average on the crystallites of the studied phase. This entails (7) to be rewritten at this level through an extension of Hill’s formulation:
II II . α α α α = = s s e e (8)
The average elastic stiffness and CTE of the polycrystal may be deduced from the well-known Eq. [14]:
( )
{
( )
}
1 I I 1, i i i N Ω Ω − = = ii + ii − C c I E c C , (9)( )
1 1( )
1( )
( )
1 I I I I I I 1, 1, i i i i i N i N Ω − − Ω − Ω Ω − = = = + ii ii ii + ii ii ii M c C R C c C R c m . (10)Where N is the number of grains in the polycrystal. It has been demonstrated in a previous work [5] that the pseudo-macroscopic stiffness of a given α-phase embedded in a multiphase polycrystal could be expressed by:
( )
1 α α α α α α Ω − = ii ii C c A A (11) with( )
{
}
1 I α α α Ω − = ii − + A E c C I . (12)In consequence, in the following, the stiffness tensor at any scale will be determined independently from the thermal expansion properties of the material. Nevertheless, it should be remembered that, in metallic materials, the elastic stiffness often vary with the temperature.
2.2 Application to X-ray diffraction
The formalism described in this first part will be used straightforwardly or extended in order to simulate the elastic and thermal properties or stresses and strains of the diffracting volume of the material. In particular, the simulation of the thermal induced stresses and strains in the diffracting grains will be cal-culated owing to (6). This method can reproduce any thermo-elastic process applied to a material. In the following, however, only pure thermal loading will be considered so that, the material will be submitted
to a stress-free macroscopic state. It was assumed that no macro or mesoscopic plastic deformation take place during the cooling process.
Hence, from I I
(
I I)
, T = =0 C ii −M δ
s e the macroscopic strain can be written as:
I I
. T =M δ
e (13)
Taking into account the condition (13) in (6) reduces the mesoscopic strains to:
( )
1( )
( )
II I I I I I . T α Ω − α Ω α Ω =c +C iiR iiC iiR iiM +c iim δ e (14)For each temperature increment δT, (9–10) will provide the required macroscopic elastic stiffness and Coefficients of Thermal Expansion from the knowledge of the single-crystal elastic and thermal proper-ties. The remaining unknown interaction tensor is then deduced from CI according to (5). This procedure ensure the evaluation of (14). The mechanical state of each grain can be completely characterize for each δT through Eqs. (14) and (10).
The lattice strain eφψ corresponds to the average of the mesoscopic strains over the well-oriented grains in the point of view of the diffraction and their projection on the measurement direction defined by the two angles φ and ψ [7, 10] (cf. Fig. 2). The procedure necessary to select the properly oriented crystallites is in detail explained in [15].
Part 3 and 4 specifically describe comparisons between experiments and SC modeling in the case of hexagonal single-phase polycrystals subjected to a slow cooling. Two-phase materials are considered in section 5.
3 Stress measurements by X-ray diffraction technique
The purpose of the present section is to combine experimental observations (X-ray diffraction) with the predictions of a self-consistent thermo-elastic model in order to obtain more informations about the dif-ferent factors responsible for the appearance of residual elastic mesostrains after a cooling process. This comparison allows a better understanding and interpretation of X-ray diffraction. This technique is a powerful tool to characterize the mechanical state at mesoscopic level of polycrystalline materials be-cause it is sensitive to the elastic strain of specifically oriented grains [16]. It uses elastic strains meas-urements and subsequent calculations of the stress state by means of mechanical equations. The capacity to measure intergranular strains provides an experimental tool for understanding how they are generated. Experimental data from X-ray diffraction offer a test at a microscopic level for the models [17, 18]. To simulate the mechanical state as observed by X-ray diffraction, a set of diffracting grain is considered for each measurement direction defined by the bisector of incident and diffracted rays. These grains are oriented so that the normal to the diffracting plane is parallel to the measurement direction. During the loading phase, these grains deform elastically according to their thermo-elastic behaviour. Due to the behaviour differences between the grains and their neighbours, strain incompatibilities occur which lead to the appearance of elastic strains to maintain the overall compatibility. After the cooling process, part of these elastic strains remain and can be measured by X-ray diffraction. As the diffracting grains are linked by crystallographic relationships, they are expected to have residual stress states that strongly depend on the diffracting planes used for measurements.
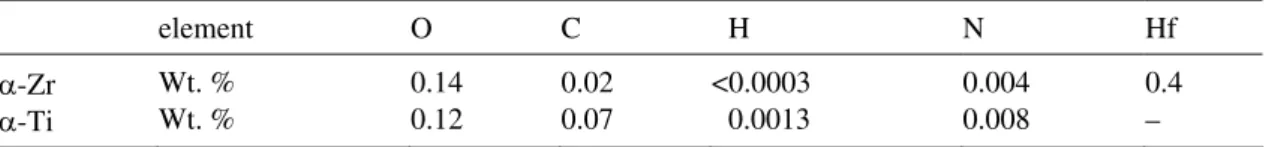
The investigated materials are cold rolled sheet of industrial grade α-zirconium (Zr702) and α-titanium (Ti40). Their chemical compositions are given in Table 1. The metallographic characteriza-
Table 1 Chemical composition of zirconium and titanium sheets.
element O C H N Hf
α-Zr Wt. % 0.14 0.02 <0.0003 0.004 0.4
tion of the annealed materials revealed an average grain size of approximately 20 µm for α-Zr and 40 µm for α-Ti.
Even after annealing, at room temperature, the material is not stress free at a mesoscopic (grain) scale, due to the anisotropy of thermal behaviour. The thermal residual stresses in the sample were evaluated using X-ray diffraction technique. After a thermal treatment at 650 °C during 4.5 h, strain measurements have been carried out at room temperature on a D500 SIEMENS goniometer with a Cr – Kα radiation for zirconium. An Ω goniometric assembly with a scintillation detector were used. Two plane families were studied: {10 14} at 2θ = 156.7° and {2022} at 2θ = 137.2°. For titanium samples, we used a Cu–Kα radiation with two plane families: {2013} at 2θ = 139.731° and {3022} at 2θ = 148.751°. Diffracto-grams were recorded for fifteen tilt angles ψ varying between –45 and 45° and for azimuth angles φ = 0, 45 and 90°. The direction φ = 0° corresponds to the rolling direction (RD). The X-ray beam output colli-mator had 0.5 mm diameter and a diffracted-beam slit limits the equatorial divergence to an angle of 0.6°. Peak position is determined by the half value width. The stress was obtained from the sin2ψ rela-tion using the macroscopic elasticity constants. Because of the low mesoscopic elastic anisotropy, εφψ vs. sin2ψ curves for a given family of diffracting planes {hkil} can be represented by straight lines. In this case, the XEC can be treated as those corresponding to an isotropic material [19]. The sample shows a typical texture of rolled Zirconium. The basal poles are preferentially oriented at an angle of 32° from the Normal Direction (ND) towards the Transverse Direction (TD), while the prism poles exhibit a weak maximum at the Rolling Direction (RD). Titanium shows a high density of basal poles around the ND, and prismatic poles are uniformly spread in the RD – TD and RD – ND planes.
The experimental data from X-ray diffraction is presented and compared with the results from our model in the fourth section.
4 Validation of the model in the case of pure single-phases:
application to zirconium and titanium
For the simulation of cooling process, we supposed that the sample is stress-free at 923 K [4]. The tex-ture was introduced in the model by a set of 1000 grains characterized by Euler angles and weights which represent their volume fraction. To simulate the experimental texture, the selection of these orien-tations was made at random, each grain was weighted by the ODF value corresponding to its orientation. To validate this choice, we used our model with different set of grains (200, 500, 1000, 2000, 4000). A set of 1000 orientations is justified by the numerical precision of our calculations. The single crystal elastic constants and the thermal expansion coefficients used in the model are listed in Table 2. The tem-perature dependence of these coefficients is taken into account by a polynomial relation proposed by Turner et al. [20]. The thermal strains due to temperature variation from 923 – 298 K are calculated. Using a polycrystalline self-consistent formulation, thermal residual strains projected on the meas-urement direction versus sin2ψ for the diffracting planes were simulated. These strains can be repre-sented by a straight line A + B sin2ψ. Predicted results were compared with experimental data using X-ray diffraction technique. The experimental strain value are determined by:
(
)
1 0 0 2 2 2 cotan α α α α ϕψ ϕψ ε = − θ − θ θ (15)Table 2 Thermal expansion coefficients (in 10–6 K–1) and elastic constants (in GPa) at single crystal
level and at room temperature [4].
m11 (= m22) m33 c11 c33 c44 c12 c13
α-Zr 5.7 11.4 143.5 164.9 32.1 72.5 65.4
0 0,1 0,2 0,3 0,4 0,5 0,6 -0,0015 -0,001 -0,0005 0 0,0005 0,001 0,0015 sin2ψψψψ εεεεφψφψφψφψ (a) 0 0,1 0,2 0,3 0,4 0,5 0,6 -0,0015 -0,001 -0,0005 0 0,0005 0,001 0,0015 sin2ψψψψ εεεεφψφψφψφψ (b)
Fig. 1 Intergranular deformations as a function of sin2ψ at room temperature with φ = 0° for a) – zirconium – 䊊 {1014} and 䉭 {2022} diffracting plane – experimental result. +, ×: predicted results. b) – titanium – 䊊 {3032} diffracting plane – experimental result. ×: predicted results.
where 0
α
θ is the Bragg angle for a stress-free specimen of the studied α phase and θ is the measured φψα Bragg angle. Consequently, it is necessary to determine the stress-free lattice parameters of the sample to calculate the thermal strains. These parameters cannot be measured using polycrystalline sample, be-cause they are distorted by intergranular strains induced by the anisotropic thermal behaviour of the grains. Then, one solution [4] is to find the stress-free parameters a0 and c0 chosen, such that the differ-ence between predicted and experimental strains values were minimized. The values obtained for the best fit are:
Zr: a = 3.2365 Å and c = 5.1498 Å or 2 Zr 0
θ
{ }
10 14 = 156.240° and 2 Zr 0θ
{ }
2022 = 136.896° . Ti: a = 2.9521 Å and c = 4.6893 Å giving 2 Ti0
θ
{ }
2133 = 139.162° and 2 Ti 0θ
{ }
3032 = 148.194° . The self-consistent formulation was used in order to determine the stress free lattice parameters. It should be noted that this determination was performed using the model in the reverse way. In this case, single crystal properties are determined by the comparison with experimental measurements done on aggregates which are the only possible source of data.Figure 1 shows the experimental (solid circles and triangles) and predicted (full line) thermal strain versus sin2 ψ curves for {1014}, {2022} (zirconium) and {2133} (titanium) diffracting planes with φ = 0°. We obtained a good agreement between the two approaches.
To give an idea of the stress magnitude, the diagonal components II 22
s and II 33
s of the stress tensor can be calculated for every grain. These values are expressed in crystal axis (with x3 // to c axis) and corre-spond to values obtained after cooling at room temperature. In zirconium, 30% of the grains have com-ponent II
22
s higher than 80 MPa and component II 22
s lower than –50 MPa. In titanium the values are much lower: the II
22
s values are always less than 6 MPa and the II 22
s values are lower (in modulus) than – 7 MPa. It is evident that, in the case of zirconium, these levels of stresses influence the appearance of microplasticity in grains, introducing an important effect on the elasto-plastic transition in zirconium alloys [1]. These thermal intergranular strains play a key role for a correct interpretation of X-ray ex-perimental results in the case of textured zirconium alloys. Intergranular strains can affect the measure-ment of total strains [4, 16, 21 – 22].
The total elastic strain for a grain at the position R can be expressed in the sample reference S as: I II III
( )R = + ( )R + ( )R
O ψ φ X1S X2S X3S X2L X1L X3L (ND) (TD) (RD)
The average strain ( , , )
d
V
hkil φ ψ ′
e for diffracting grains measured in the 3
L
x direction defined by the angles (φ, ψ) (cf. Fig. 2) can be written as:
(
)
(
)
I II III 33 33 33 I 2 I 2 I I 2 I 11 22 12 33 33 I I IIe IIti 13 23 33 33 1 , , ( ) d( cos sin sin 2 ) sin
1
cos sin sin 2 ( ) d .
d d d V d V d V hkil V V V V ϕ ψ ϕ ϕ ϕ ψ ϕ ϕ ψ ′ = ′ + ′ + ′ ′ ′ ′ ′ ′ = + + − + ′ ′ ′ ′ + + + +
∫
∫
e e e e e e e e e e e e e (17)By definition, the mean value of microstrains is zero within each grain and within the diffracting volume Vd.
All quantities defined with respect to the L frame are denoted by prime to distinguish them from those defined in the sample system S. eIIti are the intergranular stresses generate by thermal anisotropy during the cooling process and eIIe
is the strain caused by the anisotropy of elastic constants.
The relation (17) shows clearly that the measured strain can not be identified to the macroscopic strain. The presence of intergranular strain after a heat treatment influence the measured strain. In zirco- nium sample, because of the strong thermal anisotropy, the level of thermal residual stresses is impor-tant. The slope of ( , , )
d
V
hkil φ ψ ′
e versus sin2 ψ is not link to any macroscopic stress, it is a projection of mesoscopic stresses. If theses intergranular stresses are not taking account, the slope determinate by X-ray diffraction can be interpreted by mistake like a macrostress of 90 MPa.
5 Single-phase CTE determination from XRD analysis
on two-phases specimens
Several works have been achieved in the aim to predict the internal stresses and strains due to thermal responses in multiphase metallic polycrystals. The results obtained from the Mori – Tanaka procedure have been compared to neutron diffraction in [23 – 24]. The main lack of the method is that it doesn’t take into account the anisotropic properties of the diffracting volume of the material. In more recent works, this delicate question has been solved owing to Finite Elements Analysis (FEA) [25 – 26]. Never-theless, FEA is quite difficult to use because this approach implies the knowledge of the microstructural morphologic pattern of the material. So, if a statistical distribution of the phases, orientation and mor-phology can be assumed, SC modelling should be reasonably accurate. But, the knowledge of the CTE of each phase is required, whatever the model chosen to proceed to calculations.
Numerous phases are very difficult to process under an acceptable non-porous single - phase state. It is the case of many advanced materials dedicated to industrial applications, as the β-phase of α + β Titanium alloys. But, this assertion is relevant for more common materials as carbide reinforced steels. Fe3C elas-tic and thermal properties are actually still discussed. Belassel gives a point on this subject in [23]. Al-though up to date works propose a very clever solution owing to thin films processes [27 – 28], the
Fig. 2 Definition of the angles φ and ψ and orientation
of the laboratory system L with respect to the sample system P.
method remains submitted to major effects due to the porosity. Thus, the characterization of the proper-ties of phases embedded in multiphase material is a requirement for a more accurate prediction of the consequences of thermal loadings on the forming and service-life of the material.
In a previous work [5], a method was developed in order to solve the question of the elastic determina-tion of the properties of phases embedded in multiphase materials. The same approach will be applied to the analyze of the pseudo-macroscopic coefficients of thermal expansion.
5.1 Derivation of SC modeling
Our purpose is to find an expression for the CTE of a phase embedded in a multiphase material, accord-ing to the classical SC model introduced in the first part of this paper. In the case of a pure thermal load-ing, it has been previously explained that it is pertinent to assume a macroscopic stress-free state of the material. In practice, this hypothesis can be satisfied owing to an adequate thermal process dedicated to residual stresses relaxation.
Let us consider the case of a (α + β) two-phase material. α-phase elastic and thermal properties will be supposed to be perfectly identified, whereas β-phase CTE are the unknowns. In this paper, the pseudo-macroscopic elastic stiffness of the β-phase will be assumed to be known from the literature or previously determined according to the method given by Fréour et al. in [5].
Introducing the volume fractions fα and fβ, the average stress relations (7 – 8) may be rewritten as a function of the pseudo-macroscopic values:
I II II
fα α fβ β
α β
= + = +
s s s s s . (18)
Taking account of (3) and of our assumption (13) on sΙ in (18) yields
(
)
(
)
0 .fαCα ii eα −Mα δ +T fβCβ ii eβ−Mβ δ =T (19)
Thus, β CTE tensor satisfies
1 1 1 f f T f T f α α β β α α β α α β β β − − = − + δ δ ii ii ii ii M C C e C C M e . (20)
While β CTE remain unknown, the main difficulty is that the pseudo-macroscopic strain in β could not be evaluated from the classical method described in the second part and involving the application of (8) consecutively to (6). Our basic hypothesis on the macroscopic stress raises more convenient simplifi-cations. Let us integrate (13) in the strain average relation (8). eαand eβare linked through the
follow-ing formula: I I
fα αe + fβ βe =e =M δ .Τ
Thus, β pseudo-macroscopic strain verifies: I 1 f T f f β α β α β = M δ − e e . (21)
The expression obtained for eβyields the following simplified form for Mβ:
1 1 1 I 1 f f T f f f α α β β α α β α α β β β − − = − + − δ ii ii ii ii M C C I e M C C M . (22)
The values taken by Mβ components should not depend on any state variable as the pseudo-macroscopic strain or the temperature. It will be demonstrated in the following that (22) satisfies this
criterion. Let us develop the mesoscopic strain in a given α-grain (6). The pseudomacroscopic strain in α results from the average relation (8):
( )
I I 1(
I I I)
R α = α Ω + − + c C ii ii C C iiR e( )
1( )
( )
I I I I I . T α Ω − α Ω α Ω + + − δ iie c C iiR ii c iim C iiM (23)(23) should be satisfied for any macroscopic strain state. In particular, when the material is submitted to a stress free strain at macroscopic scale, (13) can be applied, so that the ratio 1
T α δ e will be expressed as follows:
( )
I I 1(
I I I)
1 T α = α Ω + − + δ e c C iiR ii C C iiR( )
1( )
( )
I I I I I . α Ω − α Ω α Ω + + − iiM c C iiR ii c iim C iiM (24)This ratio only depends on the constants describing the thermo-mechanical properties of the material. Thus, according to (24) any state variable is excluded from expression (22) obtained for the pseudo-macroscopic CTE of β. Once fα, fβ, cα, Cα, Cβ, CI, MI, mα and Mα known, e.g. from measurements or calculation, one will easily calculate the pseudo-macroscopic CTE of any given β-phase owing to (22) and (24). In spite of the assumptions concerning the macroscopic response considered for the needs of the demonstration, forms (22, 24) are general and will be satisfied whatever the mechanical state of the system.
Nevertheless, the case of the pseudo-macroscopic elastic stiffnesses and CTE should be carefully examined. In theory, (11 – 12) demonstrate the potential existence of a deviation between the elastic stiff-ness of a phase embedded in a multiphase material and the corresponding single-phase stiffstiff-ness. This point has been developed in [5]. The main implifications of SC modeling concerning this question will be summarized for the needs of the present study. In fact, in most cases, it was numerically justified that pseudo-macroscopic elastic stiffnesses could be identified with the single phase elasticity constants. However, a priori, it is not possible to predict anything about the question of pseudo-macroscopic CTE. Thus, we will discuss about this point in the following section.
5.2 SC model for pseudo-macroscopic CTE computation
In order to quantify the deviation between pure single-phases CTE and the corresponding values for the same phase when it is embedded in a multiphase material, it is first necessary to express the relation ruling thermo - elastic interactions existing between a phase and the polycrystalline matrix. Considering the case of α-phase, and according to (4), it comes:
(
)
I I I I
α − = − ii ii α −
s s C R e e . (25)
In the case when the material is not subjected to any macroscopic stress, the integration of the condi-tions (2, 3, 13) in (24) yields:
(
)
I I(
I)
T T
α ii α − α δ = − ii ii α − δ
C e M C R e M . (26)
Basic tensorial calculations lead to the following simplifications for the CTE of a given α-phase embedded in a multiphase material:
1 I I 1 I I I 1 1 T T α = α + α− α − α− δ δ ii ii ii ii ii ii M e C C R e C C R M . (27)
It should be remembered that Eq. (24) expressing the ratio 1 T
α
δ e yield the simplification of the state variables, so that Mα only depends on the thermal and mechanical constants of the material.
Several tests can be performed in order to check the form obtained for Mα. In the case of a single-phase material, the supplementary conditions should be satisfied e.g. eα =eI=MIδTand Cα = CI.
(27) then reduces to 1 1 I I I I I I I I I I I I I I I 1 1 . T T T T α = δ + − δ − − δ δ = + − = ii ii ii ii ii ii ii ii M M C C R M C C R M M R M R M M
Hence, (27) predicts the expected thermal behaviour even in the case of a single - phase material. How-ever, the SC formalism demonstrates that the average CTE of a given phase should not be the same in a pure single-phase material and in a multiphase polycrystal, due to the interphase interactions revealed by the terms CI, RI and MI which depend on the thermo-elastic properties of the others phases constituting the structure.
Notice that the evaluation of (27) only requires the knowledge of the thermal and elastic single- crystal constants of the material. The factors CI, RI, MI,Cα and 1
T
α
δ e being determined according to (5 – 12, 24).
Equation (27) was applied to several two-phases material chosen to evaluate the influence on pseudo-macroscopic CTE of the parameters listed below:
– single crystal elastic anisotropy,
– single crystal thermal expansion anisotropy, – heterogeneities of single-phase elastic stiffnesses, – heterogeneities of single-phase CTE.
Assumptions and simulation procedure are described in the following. The behaviour has been simu-lated when the material is subjected to a cooling process from 998 K to 298 K. Five compositions (vol-ume fractions) of the polycrystal have been considered: fα = {0; 0.25; 0.5; 0.75; 1}. In each case, the homogenisation procedure has been performed on 4000 crystallites per phase. A spherical shape has been chosen for the inclusions. The volume fraction of each crystallite was adjusted in order to satisfy the assumption on the volume fraction of the phase in the material. The texture is isotropic in each phase, so that the relative weight of the grains are the same in a given phase (but, it may vary from one phase to another). Notice that the case when the volume fraction of a phase tends towards zero corresponds to the limit case of the inclusion embedded in an infinite matrix developed in Eshelby’s model [29]. Single crystal thermal expansion are tabulated in Refs. [30 – 31] for Zn and Al. Figure 3 illustrates the evolu-tions observed in simulated Fe – Cu alloys. The evolution with the temperature of the CTE of each single-phase has been deduced from the measurements of the lattice parameters respectively published by Mitra et al. for Copper [32] and by Goldschmidt in the case of α-Fe [33].
The 3D curves show that the CTE does not vary in a significant manner with the composition of the material. Results obtained in numerous materials are summarized in Table 3. In most cases, pseudo-macroscopic CTE deviates from the single-phases values from less than 1%. In consequence, in spite of the expression demonstrated in (25), numerical computations justifies the identification of pseudo-macroscopic CTE to single-phase CTE.
This additional assumption implies to neglect interphase interactions. As a matter of fact, it has two major consequences. Firstly, the model reduces to the very classical “one inclusion per phase” SC model. Secondly this hypothesis provides the knowledge of the remaining unknowns in (20). Hence, this as-sumption should be considered as an enhancement of the model, because it ensures the possibility to characterize the thermal properties of a phase embedded in a two - phase material through (20).
Nevertheless, the validity of the additional hypothesis should be checked a posteriori. The formalism described along this section will now be applied to the case of silicon carbide.
0 0,2 0,4 0,6 0,8 1298 498 698 898 13 14 15 16 17 C u vo lum e fra ctio n Tempera ture (K) M1 1 (C u ) (1 0 -6 K -1)
Cu CTE simulated in Feα−Cu polycrystals
0 0,2 0,4 0,6 0,8 1298 498 698 898 13 14 15 16 17 α-F e vo lum e fra ction Temp eratur e (K) M 1 1 (α -F e ) (1 0 -6 K -1)
α-Fe CTE simulated in Feα-Cu polycrystal
Fig. 3 Evolution of the CTE at pseudo-macroscopic scale in simulated Fe – Cu polycrystals, as a function of the
temperature and composition.
Table 3 Qualitative and quantitative study of the deviation between pseudo-macroscopic and
single-phase CTE. material considered phase single- crystal elastic anisotropy single-crystal CTE anisotropy single-phase elastic stiffness heterogeneity single-phase CTE heteroge-neity maximum deviation between single-phase CTE and the corre-sponding pseudo-macroscopic CTE
α-Zr weak medium 1.2%
Zr – Ti
α-Ti weak weak
weak strong
Ⰶ1%
α-Fe medium none Ⰶ1%
Fe – Cu Cu strong none medium weak Ⰶ1% Al weak none Ⰶ1% Al – Zn Zn strong strong strong strong 2.4%
5.3 Determination of SiC CTE from analysis on a two - phase MMC
Silicon carbide (SiC) is extremely difficult to obtain in satisfactory single - phase samples. Sintered sam-ples are not rigorously polycrystalline. Moreover, they include porosities which could be considered as a strongly heterogeneous secondary phase, due to their infinite compliance. Several papers demonstrate the main effects of the porosity on the mechanical behaviour of an extensive variety materials: not only concrete, but metals and so on [34 – 36].
In terms of thermal expansion, it is almost sure that the average behaviour of a hypothethical bulk SiC polycrystal would not be the same than the one of a mixture SiC-porosities. In consequence, the study of SiC CTE should be preferably achieved on a non-porous two-phase sample, according to the formalism developed in this work.
X-ray analysis of the evolution of the CTE of Al50% vol– SiC50% vol and pure aluminum polycrystals are available in the literature [31]. The required data has been introduced in SC simulation scheme as de-
0 5 10 15 20 25 30 35 40 398 498 598 698 798 898 Temperature [K] M11 [1 0 -6 K -1]
SiC CTE (SC model) Al CTE (measured) Two-phase MMC CTE (measured) SiC CTE (measured at 773 K)
tailed in the previous section. Due to lack of information concerning the Orientation Distribution Func-tion (ODF) of the phases, the material was assumed isotropic. Figure 4 illustrates the curves obtained at macroscopic and pseudo-macroscopic scales in the composite. A horizontal line corresponding to SiC CTE measured around 773 K is given as a comparison [37].
SC model predicts values in good accordance with the experiments in a wide temperature range [648 K – 848 K]. Moreover, the results agrees with some conventional properties attributed to ceramics e.g.: a weak variation of their CTE with the temperature.
In conclusion, this study confirms the validity of approaches coupling XRD analysis to self consistent thermo-elastic simulations in order to characterize the thermal expansion of phases embedded in two-phase polycrystals.
6 Summary, conclusion and perspectives
In this study, X-ray diffraction and self-consistent modeling have been used to measure and simulate the thermal residual strains induced in either single-phase or two - phase polycrystalline materials including Metal Matrix Composites. Comparisons of these two approaches performed on commercially pure α-Ti and α-Zr textured samples show a good agreement.
The efficiency of SC estimates was also demonstrated. In particular, the model properly reproduces the behaviour of the diffracting volume of strongly thermal anisotropic materials as Zr. The simulations achieved in the case of single-phase polycrystals predicted results which could be explained owing to the properties intended to the materials and especially in relation to their crystallographic structure (texture). The formalism was extended to the case of two - phase materials in a more convenient way. The solution developed takes into account the pseudo-macroscopic scale which figure the average properties of the different phases constituting the material. An additional assumption was considered. Theory predicts that pseudo-macroscopic CTE may deviate from the single - phase corresponding values. Numerical computa-tions justifies, however, the identification of these tensors. This hypothesis is crucial, because it provides an original method for the characterization of the CTE of a phase embedded in a two - phase material. This method implies the coupling of experimental techniques and SC scale transition modeling. It was checked through the determination of the CTE of the silicon carbide included in aluminum based matrix. The simulations agree with values previously published in the literature. The main improvement con-cerning this method is that it has been conceived to be suitable even on two - phase material, so that it is no more necessary to process the material in order to obtain pure single - phase samples.
This work raises several perspectives. In further studies, SC model will be formulated in order to express the CTE of a phase directly from the pseudo-macroscopic strains measured on the diffracting volume of the material. XRD being extremely sensitive to texture effects, this alternative approach should be more pertinent to treat the case of rolled samples, for example. This method will be applied to different α + β titanium based alloys in order to study the relation between the alloying elements and the properties of the β-phase of the materials.
Fig. 4 Predicted and experimental [31]
evolution of the CTE in a 50 vol.% SiCp/Al
References
[1] D. Gloaguen, M. François, R. Guillén, and J. Royer, Acta Mater. 50, 871 (2002). [2] F. Jacquemin and A. Vautrin, Compos. Struc. 58, 1 (2002).
[3] S. R. Mac Ewen, C. Tomé, and J. Faber, Acta Mater. 37, 979 (1989). [4] M. Ortiz and A. A. Pochettino, J. Nucl. Mater. 229, 65 (1996).
[5] S. Fréour, D. Gloaguen, M. François, R. Guillén, E. Girard, and J. Bouillo, Mater, Sci. Forum 404 – 407, 723 (2002).
[6] E. Kröner, Z. Phys. 151, 504 (1958).
[7] J. M. Sprauel, M. François, and M. Barral, in: Second International Conference on Residual Stresses, edited by G. Beck, S. Denis, A. Simon, A. 172 (1988).
[8] A. Molinari, S. Ahzi, and R. Kouddane, Mech. Mater. 26, 43 (1997).
[9] J. M. Sprauel, in: le Commissariat à l’Energie Atomique (editor), Analyse des contraintes résiduelles par dif-fraction des rayons X et des neutrons, chapter VIII, 185 (1996).
[10] J. M. Sprauel and L. Castex, L., in: First European Powder Diffraction International Conference on X-ray stress analysis, Munich (1991).
[11] C. N. Tomé, N. Christodoulou, P. A. Turner, M. A. Milles, C. H. Woo, and T. M. Holden, J. Nucl. Mat. 227, 237 (1996).
[12] R. Hill, J. Mech. Phys. Solids. 13, 89 (1965). [13] R. Hill, J. Mech. Phys. Solids. 15, 79 (1967).
[14] C. N. Tomé, in: U. F. Kocks, C. N. Tomé, H.-R. Wenk (editors), Texture and anisotropy, chapter 7, p. 283 (1998).
[15] P. Mabelly, Doctoral Thesis, ENSAM, Aix en Provence (1996).
[16] I. C. Noyan, J. B. Cohen, in: Residual stress: measurement by diffraction and interpretation, (Springer-Verlag, 1987).
[17] J. W. L. Pang, T. M. Holden, P. A. Turner, and T. E. Masson, Acta Mater. 47, 373 (1999). [18] M. R. Daymond and H. G. Priesmeyer, Acta Mater. 50, 1613 (2002).
[19] M. Ortiz, A. A. Pochettino, J. L. Lebrun, and G. Maeder, Metall. Trans. 24 A, 389 (1993). [20] P. A. Turner, N. Christodoulou, and C. N. Tomé, Int. J. Plast. 11, 251 (1995).
[21] V. Hauk, in: Elsevier (editor), Structural and Residual Stress Analysis by Nondestructive Methods (1997). [22] A. Baczmanski, K. Wierzbanowski, P. Lipinski, R. B. Helmholdt, G. Ekambaranathan, and B. Pathiraj, Philos.
Mag. A 69, 3, 437 (1994).
[23] M. Belassel, Doctoral Thesis, (Paris 1994).
[24] M. Belassel, J. L. Lebrun, S. Denis, E. Gautier, and J. P. Bettembourg, Proceedings ICRS 4, 392 (1994). [25] A. Saigal and G. G. Leisk, Mater. Sci. Eng. A 237, 65 (1997).
[26] C. M. Weisbrook and A. D. Krawitz, Mater. Sci. Eng. A 209, 318 (1996).
[27] S. J. Li, M. Ishihara, H. Yumuto, T. Aizawa, and M. Shinomotai, Thin Solid Films 316, 100 (1998). [28] H. Mizubayashi, S. J. Li, H. Yumoto, and M. Shimotomai, Scripta Materialia, 40, n° 7, 773 (1999). [29] J. D. Eshelby, Proc. Roy. Soc. A 241, 376 (1957).
[30] M. Humbert, J. Wegria, and C. Esling, Textures Microstruct. 14 – 18, 463 (1991). [31] B. G. Kim, S. L. Dong, and S. D. Park, Mater. Chem. Phys. 72, 42 (2001). [32] G. B. Mitra and S. K. Mitra, Indian J. Phys. 37, 462 (1963).
[33] H. J. Goldschmidt, Advances in X-ray analysis 5, 191 (1962).
[34] L. P. Martin, E. A. Lindgren, M. Rosen, and H. Sidhu, Mater. Sci. Eng. A 279, 87 (2000). [35] I. Sevostianov and M. Kachanov, J. Biomech. 33, 881 (2000).
[36] Q. Yang, W. Lengauer, T. Koch, M. Scheerer, and I. Smid, J. Alloys Comp. 309, L5 (2000).
[37] K. Lonsdale, in: International tables for X-ray crystallography, edited by C. H. Macgillavry, G. D. Rieck, and K. Lonsdale, 125 (1968).
![Table 2 Thermal expansion coefficients (in 10 –6 K –1 ) and elastic constants (in GPa) at single crystal level and at room temperature [4]](https://thumb-eu.123doks.com/thumbv2/123doknet/11572203.297605/6.892.129.763.1004.1075/table-thermal-expansion-coefficients-elastic-constants-crystal-temperature.webp)


![Fig. 4 Predicted and experimental [31]](https://thumb-eu.123doks.com/thumbv2/123doknet/11572203.297605/13.892.135.494.182.393/fig-predicted-and-experimental.webp)
