HAL Id: hal-01917049
https://hal.insa-toulouse.fr/hal-01917049
Submitted on 26 Nov 2018HAL is a multi-disciplinary open access archive for the deposit and dissemination of sci-entific research documents, whether they are pub-lished or not. The documents may come from teaching and research institutions in France or abroad, or from public or private research centers.
L’archive ouverte pluridisciplinaire HAL, est destinée au dépôt et à la diffusion de documents scientifiques de niveau recherche, publiés ou non, émanant des établissements d’enseignement et de recherche français ou étrangers, des laboratoires publics ou privés.
Combination of the Wenner resistivimeter and Torrent
permeameter methods for assessing carbonation depth
and saturation level of concrete
Stéphanie Bonnet, Jean-Paul Balayssac
To cite this version:
Stéphanie Bonnet, Jean-Paul Balayssac. Combination of the Wenner resistivimeter and Torrent per-meameter methods for assessing carbonation depth and saturation level of concrete. Construction and Building Materials, Elsevier, 2018, 188, pp.1149-1165. �10.1016/j.conbuildmat.2018.07.151�. �hal-01917049�
1
Corresponding author. Tel.: +33 2 40 17 81 88; E-mail address: stephanie.bonnet@univ-nantes.fr
Combination of the Wenner resistivimeter and Torrent Permeameter methods for
1
assessing carbonation depth and saturation level of concrete
2 3 4
Stéphanie BONNET1, Jean-Paul BALAYSSAC2 5
6
1
LUNAM Université, Université de Nantes, GeM, Institut de Recherche en Génie civil et 7
Mécanique – CNRS UMR 6183 52 rue Michel Ange, BP 420, 44606 Saint-Nazaire cedex, 8 France 9 stephanie.bonnet@univ-nantes.fr 10 11 2
LMDC, INSA/UPS Génie Civil, 135 Avenue de Rangueil, 31077 Toulouse cedex 04 France 12 jean-paul.balayssac@insa-toulouse.fr 13 14 Abstract 15
Assessing carbonation depth is of great interest for the diagnosis of reinforced concrete
16
structures because carbonation is one of the origins of steel corrosion. The assessment of
17
carbonation depth is usually performed by a simple and reliable semi-destructive test
18
consisting in spraying a colored indicator on a sample extracted from the structure. When the
19
structure is large, this test must be reproduced many times if an assessment of the variability
20
of carbonation depth is required. In this case, the extraction of multiple samples can be
21
prohibitive from the technical and economic points of view. So, in this case, a non-destructive
22
testing (NDT) method could be relevant. However, even when NDT methods can be used,
23
there is a need to improve the interpretation of their results. In this study, the use of two usual
24
NDT methods is proposed: resistivity measurement by a Wenner probe and surface
25
permeability assessment by a Torrent permeameter. Both techniques are implemented on
26
carbonated slabs having different carbonated depths and at different saturation degrees. The
27
results show that the two techniques are sensitive to moisture and carbonation. For a given
28
saturation level, resistivity increases when the carbonated depth increases and resistivity
29
decreases when the saturation level increases. Torrent permeability decreases when the
30
saturation degree and carbonated depth increase. Good repeatability is observed for resistivity
31
measurements while a larger scatter is obtained for Torrent permeability. Empirical laws are
built for the relationships between resistivity or permeability and saturation degree and
33
carbonated depth. For resistivity, either a linear model between resistivity and saturation
34
degree is used or Archie’s law is adapted to take the effect of carbonation into account.
35
Following the same idea, a linear law between Torrent permeability and saturation degree is
36
adapted to the effect of carbonation. Because resistivity can be measured only if the saturation
37
degree is rather high, i.e. if there is a continuity of the interstitial solution, and because
38
permeability assessment is impossible if the concrete is fully saturated, these laws are limited
39
to saturation degrees in the 40 to 83% range.
40
Then, these laws are used to predict carbonation depth and saturation degree on a wall
41
designed with the same concrete but stored in different conditions. The results show that
42
resistivity and Torrent permeability can be used for the combined assessment of carbonation
43
depth and saturation degree in laboratory conditions.
44
Keywords: Concrete, carbonation depth, saturation level, Torrent permeability, Wenner 45 resistivity 46 47 1 Introduction 48
The corrosion of reinforcing steel within reinforced concrete structures produces damage such 49
as spalling of the concrete cover. Steel parts then remain uncovered and cause a sharp 50
decrease in the load-bearing capacity of the structure. This failure condition is usually due to 51
the presence of chloride or to a carbonation process. The present study was conducted to 52
examine, more specifically, the carbonation process. Carbonation is a physical-chemical 53
process, which may cause a decrease in concrete pH value from 13 to 9. Carbon dioxide from 54
the air (CO2) reacts with the portlandite of concrete (Ca(OH)2) to form calcium carbonate
55
(CaCO3 + H2O) (Figure 1). If the whole of the concrete cover is carbonated, steel frame
passivation is initiated and results in the delamination of the concrete cover due to swelling of 57
the corroded steel. 58
59
60
Figure 1: pH decrease in concrete cover due to carbonation [Ta 2016]
61
According to a literature review conducted by Ta et al. [Ta 2016 and 2018], a considerable 62
amount of effort has been devoted to the study of the propagation of CO2 and to the
63
examination of the factors affecting the carbonation rate, such as mix proportions in concrete 64
(e.g., cement content and water to cement ratio) [Chang 2004], [Papadakis 1989], mineral 65
admixtures [Hui-Sheng 2009] [Papadakis, 1999 and 2000] [Younsi 2011], exposure 66
conditions (e.g., temperature (T) [Saetta 1993] and external relative humidity (RH) [Houst 67
1983] [Papadakis, 1989]). 68
Because carbonation takes place throughout the life cycle of concrete, accurate assessment of 69
its progress is essential to predict the initiation of steel corrosion. To achieve this, the 70
condition of the concrete cover of structures must be surveyed at regular intervals in order to 71
plan maintenance. The most common technique used for measuring carbonation depth is the 72
semi-destructive coring method [RILEM CPC-18]. Phenolphthalein is sprayed on the fresh 73
cores obtained [Chang 2006, Villain 2006]. Phenolphthalein is an organic compound used as a 74
pH indicator: it is colorless at low pH values (around pH 9) but has a characteristic purple or 75
magenta color at pH values exceeding 10.5. 76
Testing is carried out at structure level with a sufficiently representative number of 77
measurement points, requiring a large variety of core samples [Breysse, 2017]. For improved 78
conservation of structures, non-destructive survey techniques must be favored as they can be 79
used to detect and characterize defects or damage without the need for coring [Bungey 2006]. 80
The objective of this research is to examine the sensitivity to the presence of carbonation in 81
concrete structures of two currently available non-destructive methods: the Torrent 82
permeameter and the Wenner resistivimeter. Carbonation affects the microstructure of 83
concrete by reducing porosity [Nagla 1997, Auroy 2015] because the volume of hydrates 84
increases by an average of 11.7% [Song and Kwon 2007]. As the carbonation front 85
progresses, an increasing number of pores become clogged and reduce porosity in the depth of 86
carbonated concrete. Porosity is one factor among others (e.g. water content and rebars)
87
affecting resistivity measurements in cementitious materials. Sbartaï et al. [Sbartaï 2007] have 88
demonstrated that resistivity increases when the W/C ratio of the studied concrete decreases, 89
leading to decreased porosity. A similar trend was observed by Lübeck et al. [Lübeck 2012] 90
after measuring concrete specimens with different water to binder ratios. As regards 91
permeability, some studies addressing the problem of permeability measurements using the 92
Cembureau method have shown that permeability decreases with the porosity of the studied 93
concrete [Hui-Sheng 2009] [Djerbi 2008 and 2013]. This trend is also reflected by 94
permeability measurements performed using the Torrent permeameter: Romer has measured 95
greater permeability values in mortars with a W/C ratio of 0.6 than in mortars with a W/C 96
ratio of 0.35 [Romer 2005] and the same tendency was also found by Neves et al. [Neves 97
2012]. The results presented by Neves et al. show that the permeability values obtained using 98
the Torrent method decrease as compressive strength rises and that porosity therefore 99
decreases [Neves 2015]. Sena da Fonseca et al. found a relation between Torrent air-100
permeability and open porosity measured on stones [Sena da Fonseca 2015]. So it can be 101
assumed that the permeability of carbonated concrete is bound to decrease and that, 102
conversely, its resistivity may increase. We therefore selected two already available non-103
destructive methods: the Wenner resistivimeter [Polder 2001] used to measure concrete 104
resistivity and the Torrent permeameter [Torrent, 1992] used to measure surface permeability. 105
In situ measurements were carried out on structures that were never completely dry for 106
auscultation. Depending on the weather conditions, the saturation degree of concrete may 107
differ. Because resistivity and permeability are both sensitive to concrete moisture content, 108
the sensitivity must be taken into account in the measurement analysis of both devices. The 109
influence of the resistivity as a function of the saturation level has been investigated by 110
Sbartaï et al. [Sbartaï 2007] and the results demonstrate that concrete electrical resistivity 111
decreases when saturation level increases. Resistivity varies between 54 and 960 Ω.m but 112
cannot be measured when the saturation level is less than 60%. Similar results are found in 113
other studies. In [Saleem 1996], resistivity ranges from 80 to 780 Ω.m and, the lower the 114
water content, the higher the resistivity. At a mass water content of about 1.5%, the resistivity 115
cannot be measured because the concrete slab is too dry to allow the current to flow within the 116
sample. The work of Lopez and Gonzalez [Lopez and Gonzalez, 1993] underlines the effect 117
of the pore saturation level in relation to resistivity. They carried out tests on mortars with a 118
W/C ratio of 0.5. The resistivity values changed within a narrow range when the pore 119
saturation level varied between 60 and 100%. Then, between 60 and 30%, the resistivity 120
increased sharply, up to a limit corresponding to a saturation level at which measurement was 121
impossible. Recent studies have improved the resistivity techniques to monitor water and 122
chloride ingress in concrete by using a multi electrode resistivity system [Du Ploy 2015, 123
Lecieux 2015, Fares 2018]. 124
Gas permeability is a transport property characterizing gas flow under a pressure gradient and 125
is used to determine the speed with which a gas (potentially an aggressive gas like carbon 126
dioxide) may penetrate into concrete. Air permeability is affected by the concrete moisture 127
content and the concrete saturation level has been shown to have an effect on transport 128
properties. For instance, the air permeability of a concrete specimen, measured using the 129
Cembureau method, increases when the saturation level decreases [Villain 2001, Picandet 130
2001]. Kameche et al. [Kameche 2014] confirmed this influence and the present study was 131
conducted to examine the intrinsic permeability variations of CEM II concrete materials 132
according to the degree of saturation, from a saturated state to a completely dry state. Because 133
gas intrinsic permeability decreases when the saturation level increases, Cembureau 134
measurements are not possible with saturation rates above 80%. Romer conducted an 135
experimental study to assess the Torrent and Cembureau methods in CEM I mortar samples 136
prepared with different cement contents [Romer, 2005]. The tests were carried out by varying 137
the relative humidity of the samples via processing at different ambient conditions. The 138
results thus obtained confirm that the permeability values measured using both Cembureau 139
and Torrent methods increase as the samples become drier. However, the study does not 140
determine the sample saturation level. 141
It thus appears from the studies listed above that both resistivity and permeability decrease 142
when the saturation level increases. Moreover, resistivity measurements are possible with 143
saturation rates above 30% (water content higher than 1.5%) whereas Cembureau 144
permeability measurements are only possible with rates below 80%. 145
Permeability is a transport property depending on the porosity of the material studied. 146
Because carbonation decreases porosity, the surface permeability of carbonated concrete 147
measured using the Torrent permeameter can be expected to change. As regards water 148
permeability, the water flow is weaker in carbonated than in non-carbonated concrete [Song 149
and Kwon, 2007]. Auroy et al. underline a decrease in intrinsic permeability after carbonation 150
for CEM I Portland cement [Auroy, 2015]. 151
Similarly, because resistivity is affected by the material microstructure, variations in 152
resistivity can be expected according to the carbonation depth. However, the literature 153
reviewed for this paper contains no research on the resistivity and permeability of carbonated 154
concrete specimens using Wenner’s and Torrent’s methods. The present study, therefore, 155
addresses carbonation and moisture effects on resistivity and permeability measurements in 156
terms of both quality and quantity in laboratory conditions. It is also important to note that
157
rebar close to surface affects the resistivity. We chose to avoid this effect as it is difficult to
158
evaluate, except maybe by using a numerical model for the determination of apparent
159
resistivity [Nguyen 2017]. 160
Using the Wenner resistivimeter and the Torrent permeameter, and taking account of the 161
sensitivity of the measurement equipment, resistivity and permeability results measured in 162
concrete slabs made of the same mixture, with varying carbonation depths and saturation 163
levels ranging from a dry state to a saturated state, were determined. The experimental results 164
are analyzed below and translated into laws considering the dispersion of the measurement 165
values. The objective of this analysis is the simultaneous use of both non-destructive methods 166
(NDT) to assess saturation level and carbonation depth in real structures. Finally, the laws of 167
correlation established were validated using a concrete wall made of the same concrete mix as 168
the experimental slabs. 169 170 171 172 173 174
2 Materials and experimental program 175
2.1 Concrete specimens 176
The concrete mix was composed of CPA-CEM I 52.5 Portland cement with a water/cement 177
ratio of 0.8 to accelerate the carbonation process (Table 1). Eleven slabs (rectangles 50 x 25 178
and 12 cm thick) were prepared from a single batch of concrete in a laboratory in Toulouse 179
(France): nine were cast for non-destructive testing, one was used for determining the 180
physical and mechanical properties and the last one was sealed on five faces and put into the 181
carbonation chamber to monitor carbonation depth. The concrete mixtures were cast in plastic 182
molds and compacted under vibration. After casting, the slabs were stored in a room at 20 °C 183
with about 95% relative humidity (RH) for 24 h until demolding, after which they were cured 184
in water at 20 °C for 28 days. 185
After 28 days, two slabs were used to assess the mechanical and physical properties of the
186
concrete. Cylindrical cores were extracted from these slabs to drive these tests. The results are 187
summarized in Tables 2 and 3. Open porosity was measured using the water saturation 188
method on three specimens. Three specimens were tested under axial compressive loading 189
conditions with measurement of lateral and axial displacements, and three other discs were 190
sealed with two layers of adhesive aluminum tape to ensure a one-dimensional gas flow 191
through the discs. These specimens were oven-dried at 105 °C to constant weight before 192
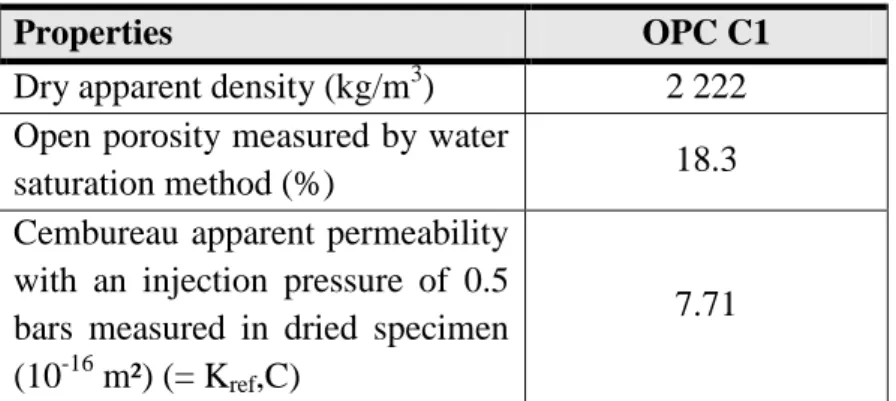
permeability testing was conducted using the Cembureau device. 193 194 Constituents (kg/m3) OPC C1 Cement CEM I 52.5 N CE CP2 NF 240 Siliceous Sand 0/2 or 0/4 941 Siliceous aggregates 4-14 or 10-14 1019 Water 193 Superplasticizer 0.96 W/C 0.8 Slump (cm) 14
Table 1: Mix proportions of concrete
196
Properties OPC C1
Dry apparent density (kg/m3) 2 222 Open porosity measured by water
saturation method (%) 18.3
Cembureau apparent permeability with an injection pressure of 0.5 bars measured in dried specimen (10-16 m²) (= Kref,C)
7.71
Table 2: Physical and transport properties (average of three measurements)
197 198
Mechanical properties (28 days) OPC C1
compressive strength (MPa) 21.5 Modulus of elasticity (MPa) 24927
Poisson ratio 0.208
Table 3: Mechanical properties at 28 days (average of three measurements)
199 200
2.2 Carbonation procedure 201
The nine slabs intended for non-destructive testing were referenced as N or T (Table 4). After 202
exposure to carbonation, the slabs referenced N were stored in Nantes (France) and those 203
referenced T, in Toulouse. 204
After a 28-day residence time in water, the slabs were oven-dried at 80 °C until constant 205
weight was reached. The dry mass, Wd, was used to calculate the water content at time t
206
(Equation 1), which, in turn, was used to calculate the degree of saturation at time t (Equation
207
2). At the end of the drying phase, the slabs were stored in laboratory conditions. The four 208
slabs referenced as 1 (C1-1-7N, C1-1-8N, C1-1-1T, C1-1-2T) were completely sealed with 209
two layers of adhesive aluminum tape to prevent carbonation. The slabs referenced C1-2N, 210
C1-3N, C1 4N, C1-2T, and C1-3T were sealed on five faces only, to ensure a one-211
dimensional carbonation processing from one side of the slab only (50 cm x 25 cm). These 212
slabs were placed in a chamber at 20 °C, with a relative humidity of 65% and a CO2 content
213
of 50% to accelerate the carbonation process. The core samples were extracted from the 214
specific sampling slab at the end of the curing phase and stored with the slabs in the 215
laboratory. They were also placed in the carbonation chamber to monitor carbonation 216
progress, just like the slabs. However, during this phase, the different core samples were 217
regularly broken and immediately sprayed with the phenolphthalein color indicator so as to 218
assess the carbonation depth at a given point of time. When the different desired carbonation 219
depths had been reached on the control core samples, the slabs were removed from the 220
chamber and immersed in water to stop carbonation and to ensure complete saturation of the 221
slabs. 222
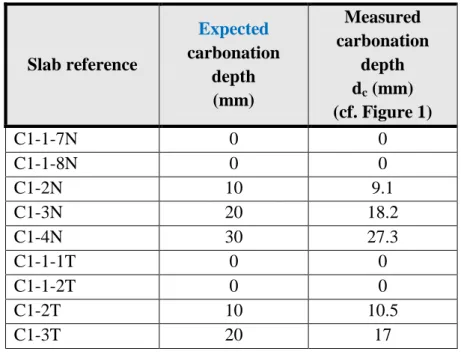
The real carbonation depths measured after completion of the whole experimental procedure 223
using NDT techniques, are presented in Table 4. 224 225 Slab reference Expected carbonation depth (mm) Measured carbonation depth dc (mm) (cf. Figure 1) C1-1-7N 0 0 C1-1-8N 0 0 C1-2N 10 9.1 C1-3N 20 18.2 C1-4N 30 27.3 C1-1-1T 0 0 C1-1-2T 0 0 C1-2T 10 10.5 C1-3T 20 17
Table 4: Expected and measured carbonation depths
226 227
2.3 Experimental procedure 228
The operating method consisted in varying the slab water content in order to obtain 229
permeability and resistivity correlation curves according to the saturation level. After 230
saturation, different phases of drying were undertaken in order to achieve measurements with 231
targeted water contents corresponding to identical saturation levels for all the slabs. For that 232
purpose, the slabs were placed in a drying oven at 80 °C and dried while their weight loss was 233
monitored. It was assumed that the concrete was not modified at 80 °C, since ettringite is
234
considered to dehydrate at a temperature higher than 80 °C [Zhou and Glasser 2001] and
235
therefore would have remained almost stable at 80 °C. When the targeted mass was obtained 236
and the drying phase completed, the slabs were hermetically sealed in airtight bags for forty 237
days to balance the humidity level of the slabs and prevent natural carbonation. Their mass 238
was measured regularly to leak-check the bags. Once the slabs were taken to be homogenized, 239
the slab mass, W(t), was measured again. Then, resistivity and permeability measurements 240
were carried out. The water content was determined from Equation 1: 241
w(t) = (W(t)-Wd)/Wd (1)
242
where w(t) is the water content at time t, W(t) is the mass of the slab at time t (kg) and Wd is
243
the mass of the dried slab (kg). 244
The degree of saturation at time t is obtained from Equation 2 as: 245
S(t) = w(t)/ wsat (2)
246
where wsat is the water content of the saturated slabs.
247 248
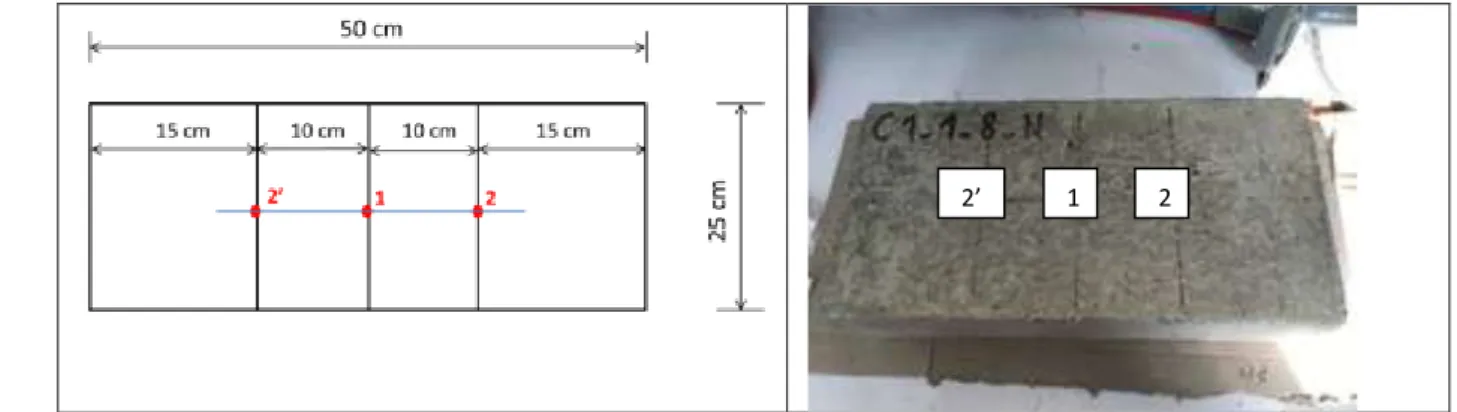
For each measurement method (Wenner resistivimeter and Torrent permeameter), a total of 249
ten measurements per test point and saturation level were performed. Measurements were 250
carried out in the center of all the slabs (Point 1 in Figure 2). However, in order to check slab 251
homogeneity and measurement sensitivity to side effects, measurements were also carried out 252
on either side of Slab C1-1-8-N center (Points 2 and 2’ in Figure 2). The measurements were
253
made first at point 1, then at point 2 and finally at point 2’ before returning to spot 1. So there
254
was enough time between consecutive measurements in the same spot to allow vacuum
255
dissipation.
The Wenner resistivity measurements were first carried out to determine the resistivity 257
values, which were afterwards used for the Torrent surface permeability measurements 258
[Torrent 1992]. 259
Figure 2: Location of measurement points on the slabs
260 261
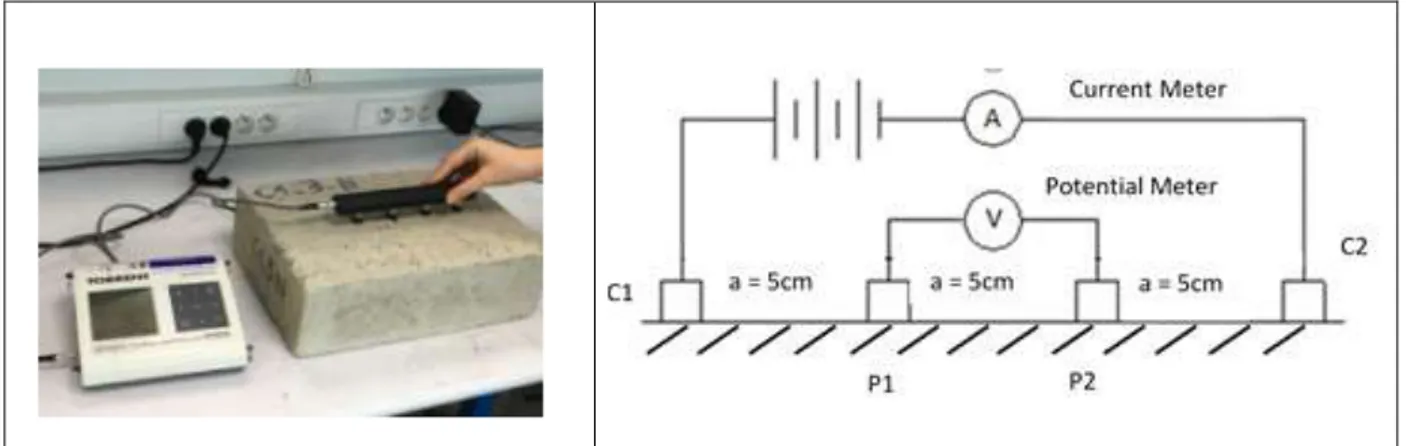
The Wenner resistivimeter is a measurement device using Wenner protocol to determine the 262
apparent resistivity of concrete facings. Measurements are assumed to be carried out on a 263
semi-infinite homogeneous material. The measurement device is called a Wenner 264
resistivimeter because of the electrode arrangement, in which the distance interval between 265
the electrodes, called a, is the same, with a (Figure 3). The device used 266
in this work had a distance interval of 5 cm. First, an electric current, I, is injected between 267
electrodes C1 and C2. Then, the electrical potential is measured between electrodes P1 and 268
P2. The apparent resistivity is calculated by the control acquisition unit, based on the 269
following formula: 270
(3)
271
where ρ is the resistivity in Ω.m, a is the distance interval between the electrodes in m, V is 272
the voltage in volts and I is the current intensity injected into the sample in amperes. 273
274
1 2
Figure 3: Wenner resistivity measurements
275 276
After the resistivity measurement was finished, the Torrent permeability was measured, if 277
possible, depending on the slab saturation level. The test principle is to create a vacuum inside 278
the test chamber using a vacuum pump and then disconnect the pump when the desired 279
pressure is reached (Figure 4). 280 281 282 283 284 285 286 287 288 289 290 291 292 293
Figure 4: Torrent permeameter
294 295
The rate of increase of pressure inside the vacuum cell can be measured and the air 296
permeability can be calculated according to the following formula: 297 (4) 298 299
Air pump Test result screen
The two chambers Pressure
measurement
with: K: Torrent gas permeability coefficient (m²), 300
µ: Air dynamic viscosity at 20 °C (2.0.10-5 N.s/m²), 301
Vc: Capacity of the inner chamber and of the elements, through which air flows during 302
the filling phase (Vc = 222.10-6 m3), 303
ε: Concrete porosity introduced in the data (18.3 %, cf. Table 2). 304
A: concrete cross-section where air flows in the vacuum cell (19.6.10-4 m²), 305
ΔP: Pressure difference in the inner chamber in N/m², 306
Pa: Atmospheric pressure in N/m², 307
t0: Test start time (60 s), 308 t: Test duration (< 720 s). 309 310 3 Results 311 3.1 Resistivity results 312
Resistivity measurements at the three points on a given slab showed little scatter in the results,
313
indicating that the concrete was homogeneous over the whole slab volume. It was concluded
314
that the saturation level of the slab was spatially homogeneous on the surface investigated.
315
Moreover, resistivity values were not influenced by side effects. Consequently, only the
316
average of the different measuring points appears in Figures 5 to 8. The standard deviations
317
were calculated from thirty measurements (ten measurements for Point 1, ten measurements
318
for Point 2 and ten measurements for Point 2’).
319
For saturation levels below 41%, measurements proved impossible for the most carbonated
320
slab because it was too dry to allow electricity to flow freely between the electrodes.
321
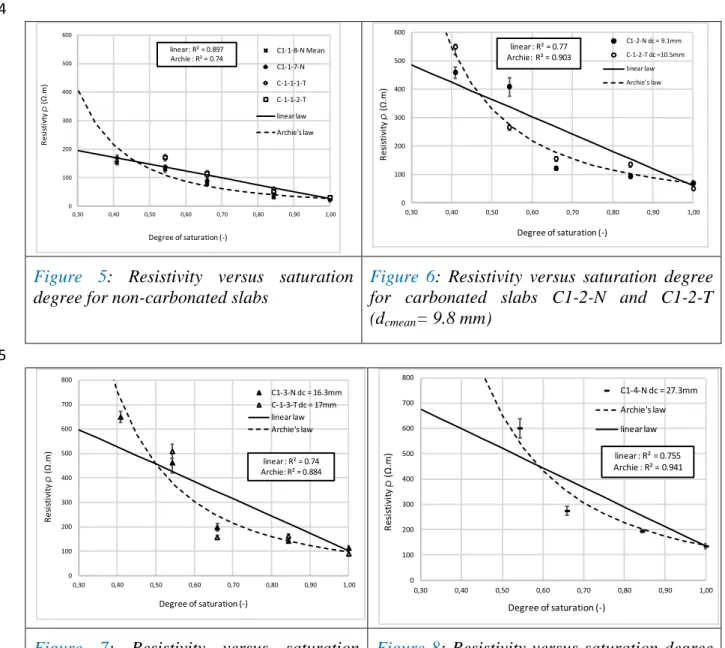
Whatever the carbonation depth reached, Figure 5, 6, 7 and 8 show a lower resistivity when 322
the sample saturation level increases. The trend observed in Figures 6 and 7 for non-323
carbonated samples has been highlighted by many authors [Sbartaï 2007, Saleem 1996, Lopez 324
1993]. When the saturation level decreases, the concrete liquid phase gradually changes to a 325
discontinuous pattern that makes ion conduction more difficult. Resistivity values then 326
increase sharply. In non-carbonated slabs, resistivity increases by a factor of six between 327
saturated samples and samples with a 41% saturation level. This explains the non-linear 328
behavior of the electrical resistivity in relation to the variations of concrete saturation levels. 329
Carbonation depth also affects resistivity. For the same saturation level, resistivity increases 330
because of concrete structural changes due to carbonation reactions. The decrease in porosity 331
induced by carbonation increases the material compactness, resulting in a less prevalent liquid 332
phase. The current then flows less freely and resistivity increases. 333
334
Figure 5: Resistivity versus saturation
degree for non-carbonated slabs
Figure 6: Resistivity versus saturation degree for carbonated slabs C1-2-N and C1-2-T (dcmean= 9.8 mm)
335
Figure 7: Resistivity versus saturation Figure 8: Resistivity versus saturation degree
0 100 200 300 400 500 600 0,30 0,40 0,50 0,60 0,70 0,80 0,90 1,00 R es is ti vt y ρ (Ω .m) Degree of saturation (-) C1-1-8-N Mean C1-1-7-N C-1-1-1-T C-1-1-2-T linear law Archie's law linear : R² = 0.897 Archie : R² = 0.74 0 100 200 300 400 500 600 0,30 0,40 0,50 0,60 0,70 0,80 0,90 1,00 R es is ti vi ty ρ (Ω .m) Degree of saturation (-) C1-2-N dc = 9.1mm C-1-2-T dc =10.5mm linear law Archie's law linear : R² = 0.77 Archie: R² = 0.903 0 100 200 300 400 500 600 700 800 0,30 0,40 0,50 0,60 0,70 0,80 0,90 1,00 R es is ti vi ty ρ (Ω .m) Degree of saturation (-) C1-3-N dc = 16.3mm C-1-3-T dc = 17mm linear law Archie's law linear : R² = 0.74 Archie: R² = 0.884 0 100 200 300 400 500 600 700 800 0,30 0,40 0,50 0,60 0,70 0,80 0,90 1,00 R es is ti vi ty ρ (Ω .m) Degree of saturation (-) C1-4-N dc = 27.3mm Archie's law linear law linear : R² = 0.755 Archie : R² = 0.941
degree for carbonated slabs 3-N and
C1-3-T (dcmean= 16.65 mm)
for carbonated slab C1-4-N with dc= 27.3 mm
Some mathematical laws are now examined for best fitting of the experimental points. We 336
first select a linear law because the results achieved for the non-carbonated slabs, within the 337
saturation level range for which measurements are possible, follow a linear trend. Then the 338
linear equation to determine the mean resistivity of saturated slabs when the degree of 339
saturation is 100% is taken as: 340
(5)
341 342
In the case of non-carbonated and fully saturated slabs, b is the reference value ref, called the
343
reference resistivity. This value corresponds to the mean resistivity obtained on non-344
carbonated slabs in saturated conditions (C1-1-8-N, C1-1-7N, C1-1-1-T, C1-1-2-T). Here, the 345
value of b is 27.627 Ω.m. 346
In the case of carbonated slabs, b is the mean resistivity calculated from the two saturated 347
slabs (S=100%). For a carbonation depth of 27.3 mm, the value of b is obtained using Slab 348
C1-4-N only. The values of a obtained by fitting the experimental data using Equation 5 are 349
reported in Table 6. 350
351
The empirical Archie’s law [Archie 1942] is also used to describe the general trend identified 352
in these figures. This law describes the dependency of resistivity on the degree of saturation 353
(S), porosity ( ) and resistivity of the composition pore solution ( as: 354
(6)
355
Parameters m and n are usually regressed over the experimental data. 356
357
To use this law, some parameters must be set. The pore solution resistivity is assumed to be 358
constant throughout the carbonation process. However, it is reasonable to believe that the 359
change in the cement matrix due to the dissolution of the portlandite modifies the pore 360
solution and therefore its conductivity. 361
The conductivity of the pore solution (σsol=1/ ) can be expressed as: 362
σ σ (7)
363
where σ , corresponding to the water conductivity as found in [Shi 2003]
364
ionic content (mol/m3) 365
ionic molar conductivity (S.m²/mol) 366
367
The conductivity of the pore solution is assessed by combining data by Andersson et al. 368
[Andersson 1989] and Nguyen [2006] (Table 5). Two solution conductivities are calculated: 369
σsol = 8.92 S/m with the values by Nguyen and σsol = 6.41 S/m with the values by 370
Andersson. Both these authors used very similar Portland cement but the mixes were 371
different. The mean value (σsol = 7.66 S/m) is used to calculate the resistivity of the pore
372
solution of the sample tested. This value is of the same order of magnitude as the values found 373
in the literature, although the literature values obviously depend on cement type and water to 374
cement ratios [Sanish 2013, Sant 2011, Neithalath 2006]. 375
376
Ion Ionic molar conductivity (mS.m²/mol) Ionic content (mol/m3) [Nguyen 2006] Ionic content (mol/m3) [Andersson 1989] Na+ 5,01 100 42.3 K+ 7.35 272 161.1 Ca2+ 11.9 2.6 2.2 Cl- 7.63 0.5 Not evaluated OH- 19.86 321.4 251.2 (calculated using measured pH)
Table 5: Values used to calculate the conductivity of the pore solution
377 378
In order to determine the factor n, which is assumed to be constant for both carbonated and 379
non-carbonated slabs, the data obtained on non-carbonated slabs are used. In this case, the 380
factor m is calculated using Archie’s law for S=100% ( ). We then have 381
mref = 3.153 with ref =27.627 Ω.m. The factor n is therefore determined by fitting the
382
experimental data of the non-carbonated slabs using Archie’s law as: n = 2.24 (Figure 5). For 383
the carbonated slabs (Figures 6, 7 and 8), n is kept constant and only m is adjusted to achieve 384
the best possible fitting with the experimental data because it is assumed to depend on the 385
microstructure, which changes during carbonation. 386
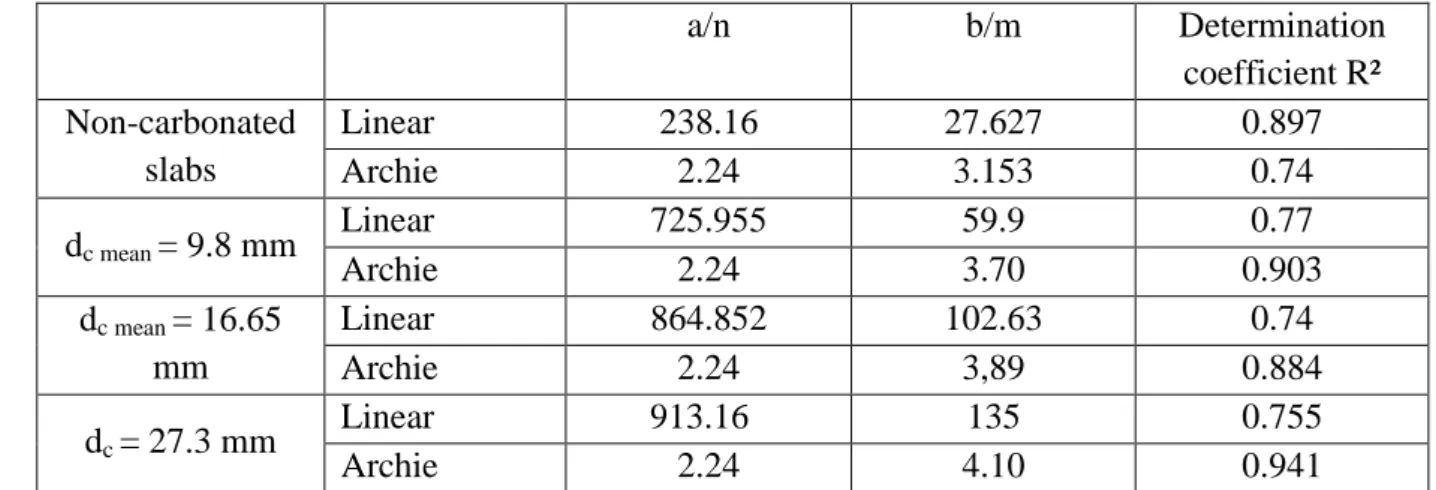
Table 6 displays the different law parameters and determination coefficients obtained. Both 387
laws can be used to represent the trend obtained because the determination coefficients are 388
correct in both cases. The determination coefficients given by the linear law, however, are 389
lower, except on non-carbonated slabs, as the linear law does not represent points obtained for 390
low saturation levels very accurately. It seems likely that, for a dry material, resistivity tends 391
toward a very high value. This trend is thus best represented by Archie’s law. 392 393 a/n b/m Determination coefficient R² Non-carbonated slabs Linear 238.16 27.627 0.897 Archie 2.24 3.153 0.74 dc mean = 9.8 mm Linear 725.955 59.9 0.77 Archie 2.24 3.70 0.903 dc mean = 16.65 mm Linear 864.852 102.63 0.74 Archie 2.24 3,89 0.884 dc = 27.3 mm Linear 913.16 135 0.755 Archie 2.24 4.10 0.941
Table 6: a and b (linear law), n and m (Archie’s law) and corresponding determination
394
coefficient R²
395 396
The relations of coefficients a and b with mean carbonation depth are described as a 397
logarithmic function (Equation 8) with R² = 0.984 and a linear function (Equation 9) with R² 398
= 0.982, respectively. As regards Archie’s law, the plot of coefficient m versus mean 399
carbonation depth is described by a linear function with R² = 0.91 (Equation 10). 400 (8) 401 (9) 402 (10) 403
By combining relationships 5 and 6 with Equations 8, 9 and 10, we obtain the laws describing 404
electrical resistivity versus carbonation depth and saturation degree, respectively (Equations 405 11 and 12): 406 (11) 407 (12) 408
where dc is the carbonation depth in mm and the Wenner resistivity (Ω.m)
409 410
The coefficients of determination obtained for the linear law parameters are higher than that 411
obtained for parameter m of Archie’s law. These laws may be used for the calculation of the 412
saturation level from a resistivity measurement with knowledge of the carbonation depth. This 413
depth would have been determined, for instance, by spraying phenolphthalein on a freshly 414
drilled core sampled from the structure. Carbonation depth determination is faster than 415
saturation level determination because it can be read immediately after sampling without 416
waiting for the complete drying needed for saturation level measurements. However, the laws 417
established here apply only to concrete with similar porosity (about 18%) and mixed with 418
CEM I cement. Solution resistivity and carbonation process both depend on the type of 419
cement and any addition modifies the chemical reactions. These laws should also consider the 420
measurement error aspects. In order to seriously take the standard deviations displayed in 421
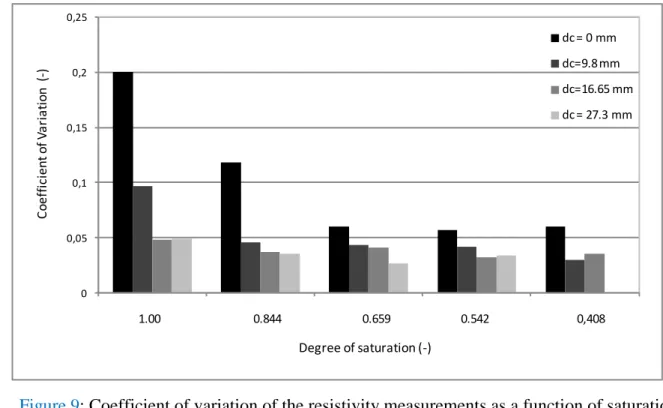
Figures 5, 6, 7 and 8 into account, Figure 9 presents the Coefficient of Variation (CoV), 422
corresponding to the standard deviation divided by the average of the values measured, for all 423
the saturation levels. CoV values are very low (lower than 10% when the value obtained from 424
the saturation measurements carried out on the non-carbonated slabs is eliminated). Moreover, 425
this maximum value of 20% is of the same order of magnitude as the CoV calculated from 426
laboratory measurements (approximately 18%) [Aït-Mokhtar, 2013]. It may be recalled that 427
measurements appear reliable here, because the lower the CoV value, the higher the 428
measurement accuracy. The results obtained on the non-carbonated slabs correspond to the 429
lowest resistivity values and, hence, to higher CoV values. This analysis suggests that the 430
Wenner measurements carried out using this device can be reproduced. 431
432
Figure 9: Coefficient of variation of the resistivity measurements as a function of saturation 433
degree and carbonation depth 434
435
3.2 Air permeability results 436
Permeability measurements at the three points on a given slab showed scatter in the results.
437
The differences observed cannot be attributed to the heterogeneity of the concrete material as
438
all the resistivity measurements performed on the same slab for a given saturation level are
439 0 0,05 0,1 0,15 0,2 0,25 C o ef fi ci en t o f V ar ia ti o n ( -) Degree of saturation (-) dc = 0 mm dc=9.8 mm dc=16.65 mm dc = 27.3 mm 1.00 0.844 0.659 0.542 0,408
almost identical whatever the measurement point. Because side effects have not been
440
demonstrated, the three point averages are presented with, on either side, the range defined by
441
the standard deviation calculated from all the values (30 measurements). Moreover, on 442
different concrete compositions, Neves et al. showed that, if the average of a set is used as the 443
representative value, it is possible to distinguish between different concrete mixes and 444
different curing (for the same mix) [Neves 2012]. 445
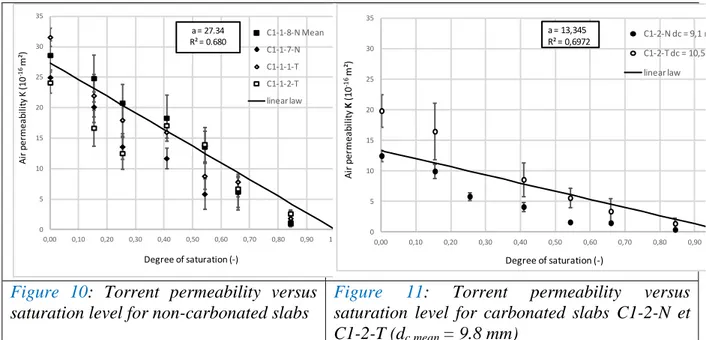
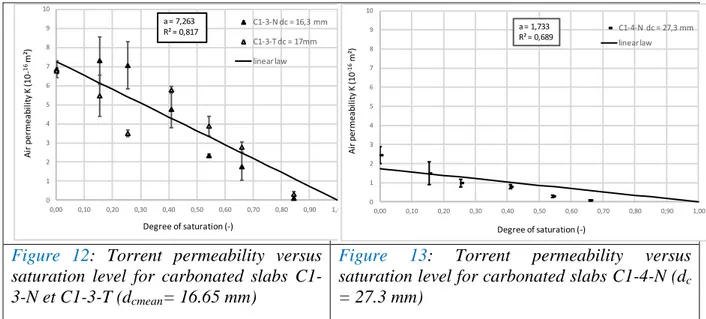
Figures 10 through 13 show that, for a given carbonation depth, gas permeability decreases 446
when the saturation level increases and also decreases when carbonation depth increases. 447
Permeability also varies greatly in the slabs, which are supposed to be of the same concrete 448
and in the same saturation state. Figure 10 shows that, when Sr = 15%, permeability ranges 449
from 17 to 25.10-16 m², i.e. an increase of almost 50%. Although measurements are not 450
possible on the fully saturated samples, they can, nevertheless, be performed up to 84%. 451
Above this saturation rate, gas can no longer flow freely because of water molecule continuity 452
in the concrete porous network. Concrete relative humidity reduces pore interconnectivity 453
and, therefore, affects its permeability. The permeability vs. saturation level curve has already 454
been assessed in the literature for non-carbonated materials using Cembureau measurements 455
carried out on different concrete types [Kameche 2014, Abbas 1999]. These authors have 456
established a logarithmic law to describe, as far as possible, the experimental results regarding 457
intrinsic permeability as a function of saturation level for different sample sizes. 458
Measurements are possible up to approximately 80% of the saturation level. As regards the 459
work of Abbas et al. [Abbas 1999], a linear law best represents the results obtained for the 460
apparent permeability measurements at different pressures as a function of the saturation 461
level, with a saturation threshold of 90%. It should, however, be noted that the measurement 462
variation ranges of both studies are larger than that obtained in the present paper using the 463
Torrent permeameter, which results in a logarithmic display of their results. The present 464
results, on the other hand, are displayed on a linear scale for viewing comfort. They are fitted 465
with a linear law for all the carbonation depths reached by imposing zero permeability as a 466
condition for the saturated samples (S = 100%). This law is described by Equation 13. As 467
regards dry, non-carbonated slabs, the reference value, Kref,T is imposed as the value for a.
468
This value corresponds to the average obtained from the Torrent permeability measurements 469
carried out on the dry non-carbonated Slabs C1-1-8-N, C1-1-7-N, C1-1-1-T and C1-1-2-T, is 470 27.34 10-16 m². 471 (13) 472 473
The coefficients of determination are correct in view of the large standard deviations, which 474
make it possible to confirm that the linear laws express Torrent permeability evolution 475
satisfactorily as a function of the saturation level. 476
Figure 10: Torrent permeability versus saturation level for non-carbonated slabs
Figure 11: Torrent permeability versus saturation level for carbonated slabs C1-2-N et
C1-2-T(dc mean = 9.8 mm) 0 5 10 15 20 25 30 35 0,00 0,10 0,20 0,30 0,40 0,50 0,60 0,70 0,80 0,90 1,00 A ir p er m ea bi lit y K (1 0 -16 m ²) Degree of saturation (-) C1-1-8-N Mean C1-1-7-N C1-1-1-T C1-1-2-T linear law a = 27.34 R² = 0.680 0 5 10 15 20 25 30 35 0,00 0,10 0,20 0,30 0,40 0,50 0,60 0,70 0,80 0,90 1,00 A ir p er m ea b ili ty K (1 0 -16 m ²) Degree of saturation (-) C1-2-N dc = 9,1 mm C1-2-T dc = 10,5mm linear law a = 13,345 R² = 0,6972
Figure 12: Torrent permeability versus saturation level for carbonated slabs
C1-3-N et C1-3-T (dcmean= 16.65 mm)
Figure 13: Torrent permeability versus
saturation level for carbonated slabs C1-4-N (dc
= 27.3 mm)
Equation 14 describes coefficient a versus carbonation depth and is then introduced into 477
Equation 15 to obtain Torrent permeability as a function of carbonation depth and saturation 478
degree. Law 14 is obtained with a good determination coefficient R² = 0.964. Both equations 479
take the form: 480
(14)
481
(15)
482
where dc is the carbonation depth in mm and K is the Torrent measurement (10-16 m²)
483 484
This law (15) could be used to calculate the saturation level from a permeability measurement 485
with knowledge of the carbonation depth from phenolphthalein spraying on the fresh core 486
sampled from the concrete structure. 487
In view of Figures 10 through 13, standard deviation appears to decrease when saturation 488
level increases (only beyond a saturation level of 15%) to reach the lowest values for samples 489
with an 84% saturation level. However, this observation is surprising since permeability 490
measurements were conducted on completely dry samples, a condition required for correct 491
measurement of the gas permeability. So, the coefficients of variation according to the 492
saturation levels for the four carbonation depths studied are displayed in Figure 14. 493 0 1 2 3 4 5 6 7 8 9 10 0,00 0,10 0,20 0,30 0,40 0,50 0,60 0,70 0,80 0,90 1,00 A ir p er m ea bi lit y K (1 0 -16 m ²) Degree of saturation (-) C1-3-N dc = 16,3 mm C1-3-T dc = 17mm linear law a = 7,263 R² = 0,817 0 1 2 3 4 5 6 7 8 9 10 0,00 0,10 0,20 0,30 0,40 0,50 0,60 0,70 0,80 0,90 1,00 A ir p er m ea bi lit y K (1 0 -16 m ²) Degree of saturation (-) C1-4-N dc = 27,3 mm linear law a = 1,733 R² = 0,689
494
Figure 14: Coefficient of variation of Torrent permeability measurements as a function of
495
saturation degree and carbonation depth.
496 497
The results presented in Figure 14 are closer to expectations. Carbonation depth has no effect 498
on the measurements because trends observed in the carbonated slabs differ depending on the 499
saturation level. CoV, on the other hand, effectively increases with the degree of saturation. It 500
should be noted, however, that CoV could not be measured for dc = 27.3 mm at an 84.1%
501
saturation level, which was at the device operating limit. Moreover, with this saturation level, 502
the coefficient of variation ranges between 30 and 50%. This high range raises questions as to 503
measurement reliability. With these saturation levels, the device operating limits are 504
exceeded, all the more so when the concrete is compact. A key idea of this analysis is that 505
saturation level S and carbonation depth dc can be determined from the measured K and by
506
combining Equation 15 with Equation 11 or 12. However, these established relationships 507
apply only if the concrete porosity is equivalent (about 18%) and the formulation uses CEM I 508
cement, as in this study. Resistivity and permeability measurements depend on the material 509
composition, which in turn affects the porosity and conductivity of the pore solution. 510 0 0,1 0,2 0,3 0,4 0,5 0,6 C o e ff ic ie n t o f va ri a ti o n (-) Degree of saturation (-) dc = 0 mm dc=9.8 mm dc=16.65 mm dc = 27.3 mm 0.00 0.15 0.25 0.41 0.54 0.66 0.84
Moreover, the combination of the two laws is possible only if both measurements can be 511
performed simultaneously, i.e., when the concrete saturation level falls within the range 40-83 512
%, which is quite often the case where in situ concrete is concerned. 513
514
4 Result analysis 515
4.1 Correlation between resistivity and Torrent gas permeability 516
Figure 15 shows the correlation between Torrent gas permeability measurements for dried 517
slabs (S= 0%) and resistivity measurements carried out on saturated slabs (S = 100%). This 518
comparison is possible since the saturation level is set aside as the impact of pore saturation is 519
canceled out. The symbols used are the same as in Figures 5 through 8 and 10 through 13. A 520
linear correlation is observed between the two parameters. The slabs with the highest 521
permeability present the lowest resistivity. Both properties share some crucial pore structure 522
characteristics, such as total porosity, pore tortuosity and connectivity, of the cover concrete 523
subjected to carbonation. They are sensitive to the different phases occurring within pores: 524
gas permeability is linked with the characteristics of the gas phase and resistivity depends on 525
the liquid phase through its electrochemical composition. Nevertheless, a good linear 526
correlation is observed for the material studied here. The correlation established by Gui et al. 527
[Gui 2016] for a study conducted to examine gas permeability using the Cembureau device 528
and electrical conductivity using the high frequency alternating current method on laboratory 529
concrete specimens with different water to binder ratios and different admixtures is not as 530
good as the correlation proposed in this paper. 531
532
Figure 15: Torrent permeability for dried slabs versus resistivity for saturated slabs
533 534
4.2 Resistivity analysis 535
Relative resistivity is considered because it could be useful to compare different concretes: it 536
has been used by Gui el al. to study electrical conductivity and gas permeability of concrete 537
formulated with CEM I and blast-furnace slag cement [Gui, 2016]. Using a relative value for 538
resistivity and permeability could also be very useful for a modeling approach [Li, 2016]. 539
Resistivity values are then processed after dividing them by the reference value ref. This
540
value can be considered as an intrinsic transport property since the impact of carbonation and 541
pore saturation is canceled out. This value is measured directly on the slabs using the Wenner 542
method. However, in future, taking the value measured on laboratory samples as the reference 543
value when selecting concrete type might be contemplated [Baroghel-Bouny, 2004; Aït-544
Mokhtar, 2013]. 545
We use the following relationship to fit the experimental data: 546
(16)
547
with A=a/ ref and B = b/ ref, a and b being the values reported in Table 6.
548 Kdry= -0.2445*ρsat+ 33.046 R² = 0.912 0 5 10 15 20 25 30 35 0 20 40 60 80 100 120 140 160 A ir p e rm e ab ilit y fo r d rie d s la b s (1 0 -16 m ²)
Solutions are obtained from Equations 8 and 9 as: 549 (17) 550 (18) 551
Considering Archie’s law, Equation 16 becomes: 552
(19)
553
where n= 2.24, mref corresponds to the value calculated in Section 3.1, mref = 3.153, and
554
values of m are given by Equation 10. We have: 555 (20) 556 (21) 557
where and dc is the carbonation depth in mm
558 559
If these laws are validated with concretes presenting other porosities, they may be used for
560
different concrete types if the ref measurement is given. This ref measurement value should
561
become a durability indicator on which the choice between concretes for engineering 562
structures could be based [Baroghel-Bouny, 2004].
563
These laws present equations with two unknown variables (saturation level and carbonation 564
depth) whereas the survey of the structure provides only the resistivity . Consequently, it is 565
essential to combine this equation (linear or exponential) with the relationship established for 566 permeability. 567 568 4.3 Permeability analysis 569
In order to establish correlations that are independent of the permeability measured on dry, 570
non-carbonated concrete, a relative permeability approach is used [Djerbi Tegguer 2013, 571
Kameche 2014]. Permeability values are then processed after being dividing by the reference 572
value Kref,T. This value, which is the average value of the Torrent permeability measurements
on dry Slabs C1-1-8-N, C1-1-7-N, C1-1-1-T and C1-1-2-T, is 27.34 10-16 m². The 574
permeability measured on a sound, dry sample should become a mandatory parameter for 575
selecting concrete mixtures. This value can be considered as an intrinsic transport property 576
since the impact of carbonation and pore saturation is canceled out. This measurement value 577
might become a durability indicator that could be provided with the formulation of concrete 578
[Baroghel-Bouny 2004, Aït-Mokhtar 2013]. 579
The results are displayed in Figures 16 through 19 for different carbonation depths. They are 580
fitted first with a linear law, then with a Van Genuchten law modified by Mualem [1976] and 581
used by [Kameche 2014] to represent relative permeability as a function of saturation level. 582
When fitting with the linear law, the coefficients of determination achieved using Equation 15 583
are obtained as: 584
(22)
585
with dc the carbonation depth in mm.
586
The modified Van Genuchten law (VG law) is then defined as: 587
(23)
588
Parameter q is determined by fitting this law with the experimental results obtained on non-589
carbonated slabs. The results displayed in Figure 16 show that q = 0.89. This value is lower 590
than the values previously achieved for cementitious materials. Monlouis-Bonnaire 591
[Monlouis-Bonnaire 2004] proposes q = 5.5 for cementitious materials and [Kameche 2014], 592
q = 3.5 for relative gas permeabilites measured using the Cembureau method. Permeability 593
variations are very pronounced when they are measured using the Torrent permeameter. For a 594
40% saturation level, relative permeability is 0.6 with the Torrent method but only 0.1 with 595
the Cembureau method [Kameche 2014]. Parameter q, used to quantify the effect of saturation 596
level on relative permeability, is held constant for carbonated slabs. However, a C factor is 597
introduced to consider the decrease in relative permeability with carbonation. 598
599
The VG law then becomes: 600
(24)
601
Figure 20 presents the empirical parameter, C, determined by fitting with the experimental 602
results. 603
Figure 16: Relative permeability versus saturation degree for non-carbonated slabs
Figure 17: Relative permeability versus saturation degree for carbonated slabs
C1-2-N et C1-2-T (dc mean = 9.8 mm)
604
Figure 18: Relative permeability versus saturation degree for carbonated slabs C1-3-N
et C1-3-T (dc mean = 16.65 mm)
Figure 19 : relative permeability versus
saturation degree for carbonated slabs
C1-4-N (dc = 27.3 mm) 605 0,00 0,20 0,40 0,60 0,80 1,00 1,20 0,00 0,20 0,40 0,60 0,80 1,00 K /Kre f,T (-) Degree of saturation (-) C1-1-8-N Mean C1-1-7-N C1-1-1-T C1-1-2-T linear law VG law linear : R² = 0.87 VG : R² = 0.865 0,00 0,20 0,40 0,60 0,80 1,00 1,20 0,00 0,10 0,20 0,30 0,40 0,50 0,60 0,70 0,80 0,90 1,00 K /Kre f,T (-) Degee of saturation (-) C1-2-N dc = 9,1 mm C1-2-T dc = 10,5mm linear law VG law linear : R² = 0.697 VG: R² = 0.774 0,00 0,10 0,20 0,30 0,00 0,10 0,20 0,30 0,40 0,50 0,60 0,70 0,80 0,90 1,00 K /Kre f,T (-) Degree of saturation (-) C1-3-N dc = 16,3 mm C1-3-T dc = 17mm linear law VG law linear : R² = 0.817 VG : R² = 0.81 0 0,05 0,1 0,15 0,2 0,25 0,3 0,00 0,10 0,20 0,30 0,40 0,50 0,60 0,70 0,80 0,90 1,00 K /Kre f,T (-) Degree of saturation (-) C1-4-N dc = 27,3 mm linear law VG law linear : R² = 0.7343 VG : R² = 0.902
Figure 21: Parameter C of the V.G. law as a function of carbonation depth
606
The coefficients of determination demonstrate that the VG law describes relative permeability 607
evolution better. This law can therefore be used to describe Torrent permeability evolution 608
according to carbonation depth and saturation level as: 609
610
(25)
611
with dc the carbonation depth in mm.
612
The VG law for relative permeability and Archie’s law for relative resistivity can be used to 613
obtain better coefficients of determination than with linear laws, in particular for carbonated 614
slabs. The two laws can be combined to determine the saturation level and the carbonation 615
depth of similar concrete structures. However, in order to use both measurement techniques 616
simultaneously, the concrete saturation level of the structure must fall within the range 40-617
66%. 618
If validated with concrete presenting other porosities, these laws may also be used on other
619
concrete materials if Kref,T measurements, carried out using the Torrent permeameter on dry
620
non-carbonated samples, and ref measurements, carried out using the Wenner resistivimeter
621
on saturated non-carbonated samples, are given. Both measurements could be performed prior 622
to the construction in order to ensure the best choice of concrete formulations. During the 623
survey conducted to apply these laws, the surveyed areas of the structure should be checked 624 C = e-0.09*d c R² = 0.963 0 0,2 0,4 0,6 0,8 1 1,2 0 5 10 15 20 25 30 Carbonation depth dc (mm) C for VG law
for cracking, as concrete damage modifies permeability [Picandet, 2001; Djerbi, 2008 and 625
2013] as well as resistivity measurements [Taillet, 2014; Lataste 2003]. If damage is detected, 626
another non-destructive technique should be used and relationships between, for instance, 627
resistivity measurement and saturation level, carbonation depth and damage should be 628
established. 629
630
4.4 Validation using a concrete wall 631
The slabs studied in this paper were used to examine the influence of carbonation on NDT 632
measurements by studying moisture homogeneity on saturated or partially saturated concrete. 633
Equations 11, 12 and 15 were established using experimental measurements carried out on the 634
slabs. In order to validate the performance of these laws, an experimental wall, 100 cm x 75 635
cm and 20 cm thick, was prepared (Figure 21a). The concrete used for the wall was the same
636
as for the slabs. A reinforcement mesh was placed at a depth of 25 mm on one face of the
637
wall. The diameter of the bars was 10 mm and the size of square mesh was 20 cm.
638
Measurements were only made on the non-reinforced side of the wall in order to avoid the
639
influence of the reinforcement, especially on resistivity measurements. This face of the wall 640
was divided into three vertical sections corresponding to different carbonation depths. After 641
28 days of storage in a humid chamber, the first section (noted 1 in Figure 21), corresponding 642
to a carbonation depth of 0 mm, was completely sealed. Then, the wall was placed in a 643
carbonation chamber at 20 °C and 65% relative humidity, with a CO2 content of 50% to 644
accelerate the carbonation process. Section 2, corresponding to a carbonation depth of 20 mm, 645
was also sealed after the same exposure to the carbonation process as Slabs 3N and C1-646
3T. The wall was finally removed from the carbonation chamber after the same exposure time 647
as Slab C1-4N. 648
a) Wall dimensions b) Photo of the wall
Figure 21: Experimental concrete wall
649
NDT measurements were carried out at twelve points on the wall (indicated with crosses in 650
Figure 21b). Then, core samples were taken in the center of each mesh to obtain real 651
carbonation depths and saturation levels. Each core sample was cut into three pieces: one 652
from each end, with a thickness corresponding to the desired carbonated depth, and one 653
middle piece corresponding to sound concrete (non-carbonated). Because coring and sawing
654
were done under water, at the end of the operations, samples were dried with acloth to avoid
655
the absorption of water as far as possible and so to avoid modifying the moisture content. The 656
carbonation depth was observed by spraying the core samples with the phenolphthalein color 657
indicator and the saturation level was calculated after drying the core samples as described in 658
Section 2.3. The values reported in Table 7 are the mean values obtained from 8 659
measurements (four core samples for each vertical section and two pieces for each core 660 sample). 661 Vertical section Measured carbonation depth (mm) Measured saturation level (%) Mean permeability 10-16 m² Mean Wenner resistivity Ω.m Calculated carbonation depth (mm) Calculated saturation level (%) equations 11 + 15 equations 12 + 15 equations 11 + 15 equations 12 + 15 1 0.25 65 1.7 22 0.003 0 93.7 93.7 2 18.9 58.9 1.07 407 24.4 24.38 61.7 61.8 3 33.1 60.6 0.101 504 48.8 38.9 64.9 86
Table 7: Comparison between measured and calculated values of carbonation depth and
662
saturation level.
663 664
In Section 1, Torrent permeability measurements were carried out with a saturation level that 665
was considered high for such a measuring technique. As shown in Figure 14, CoV increased 666
with the degree of saturation. This can explain the high calculated degree of saturation 667
obtained in Section 1 in both cases (Equations 11+15 and 12+15). As regards the carbonated 668
sections, the calculated values for carbonation depth were overestimated by non-destructive 669
testing, which provides a safety margin regarding the service life assessment of concrete 670
structures but can be expensive for owners because repair will take place earlier. The 671
combination of Equations 12 and 15 is more consistent with the measured data especially as 672
regards carbonation depth. This combination is recommended for carbonation depth 673
calculations, while the combination of Equations 11 and 15 is advised for calculating the 674
saturation level after testing concrete structures using the Wenner resistivimeter and the 675 Torrent permeameter. 676 677 5 Conclusion 678
In this study, resistivity and permeability measurements were performed on carbonated slabs 679
conditioned at different saturation degrees. The results confirm that resistivity and 680
permeability are both very sensitive to concrete moisture. They also clearly show that 681
carbonation affects resistivity and permeability. The higher the carbonated depth is, the higher 682
is the resistivity and the lower is the permeability. This can be related to the reaction of 683
carbonation, which decreases porosity. Resistivity cannot be assessed for water saturation 684
degrees of less than 40% because, at such low moisture content, the continuity of the 685
interstitial solution vanishes and the electrical current cannot circulate. On the other hand, 686
permeability cannot be measured for saturation degrees higher than 83% due to the 687
obstruction of pores by the interstitial solution, which prevents gas penetration. An analysis of 688
the test results has shown a coefficient of variation of 20% for resistivity and less than 30% 689
for permeability, which increases with the increase of saturation degree whatever the 690
carbonated depth. 691
Two empirical laws have been proposed here to model resistivity measurements versus 692
carbonated depth and saturation degree. The first one is adapted from a linear law between 693
resistivity and saturation degree to take the carbonated depth into account. For the second one, 694
Archie’s law is adapted to take carbonation into account. The coefficient of determination is 695
better for the linear model, which is easier to determine. In the same way, a linear model 696
between permeability coefficient and saturation degree is extended to take the carbonated 697
depth into account with a good determination coefficient. 698
Models involving relative resistivity and relative permeability have also been proposed. For 699
resistivity, both the linear and Archie’s law are considered. For permeability modeling, a 700
modified Van Genuchten law seems more efficient than the modified linear model. It would
701
be interesting to check these models with concrete presenting other porosities.
702
Finally, the different models have been used to predict both saturation degree and carbonated 703
depth on a wall made with the same concrete as the slabs. The results show that the models 704
are able to distinguish different carbonated depths but the assessment precision needs to be 705
improved. Additional research is required, in particular to take the presence of cracks into 706
consideration. These may due to shrinkage or to mechanical effects, for instance, which have 707
a significant influence on measurements. In order to improve the quality of the investigation, 708
a third technique could be proposed, such as ultrasonic surface waves, which are able to 709
investigate the cover concrete. 710
711 712
6 Acknowledgment 713
The French National Research Agency (ANR “Building and Sustainable Cities”) is gratefully 714
acknowledged for supporting the ANR EvaDéOS project. Our thanks are extended to Susan
715
Becker, a native English speaker, commissioned to proofread the final English version of this
716 paper. 717 718 7 References 719
[Aït-Mokhtar 2013] Aït-Mokhtar A., Belarbi R., Benboudjema F., Burlion N., Capra B., 720
Carcassès M., Colliat J.-B., Cussigh F., Deby F., Jacquemot F., De Larrard T., Lataste J.-F., 721
Le Bescop P., Pierre M., Poyet S., Rougeau P., Rougelot T., Sellier A., Séménadisse J., 722
Torrenti J.-M., Trabelsi A., Turcry P., Yanez-Godoy H., Experimental investigation of the 723
variability of concrete durability properties, Cement and Concrete Research 45 (2013) 21–36. 724
[Abbas 1999] Abbas A., Carcasses M., Ollivier J.P., Gas permeability of concrete in relation 725
to its degree of saturation, Materials and Structures, Vol. 32, January-February 1999, pp 3-8. 726
[Andersson 1989] Andersson K., Allard B , Bengtsson M., Magnusson B., chemical 727
composition of cement pore solutions, cement and concrete research, Vol. 19, pp. 327-332, 728
1989. 729
[Archie 1942] Archie G.E., The electrical resistivity log as an aid in determining some
730
reservoir characteristics, Transaction of AIME, 1942, 146, pp.54-62
731
[Baroghel-Bouny 2004] Baroghel-Bouny, V., “Concrete design for structures with predefined 732
service life – durability control with respect to reinforcement corrosion and alkali–silica 733
reaction state-of-the-art and guide for the implementation of a performance-type and 734
predictive approach based upon durability indicators.” English version of Documents 735
Scientifiques et Techniques de l’AFGC (Civil Engineering French Association), 2004. 736
[Bungey 2006] Bungey J., Millard S., Grantham M., Testing of Concrete in Structures, 4th 737
Edition, Taylor and Francis Editors, 2006. 738
[Auroy 2015] Auroy M., Poyet S., Le Bescop P., Torrenti J.M., Charpentier T., Moskura M., 739
Bourbon X., Impact of carbonation on unsaturated water transport properties of cement-based 740
materials, Cement and Concrete Research, Volume 74, August 2015, Pages 44-58. 741
![Figure 1: pH decrease in concrete cover due to carbonation [Ta 2016]](https://thumb-eu.123doks.com/thumbv2/123doknet/11593125.298832/4.892.156.726.209.540/figure-ph-decrease-concrete-cover-due-carbonation-ta.webp)