Speckle interferometry at 10 micrometers wavelength: a combined
thermography and interferometry technique and its application in
aeronautical nondestructive testing
Marc P. Georges*
a, Jean-François Vandenrijt
a, Cédric Thizy
a, Igor Alexeenko
b,
Giancarlo Pedrini
b, Jonathan Rochet
c, Birgit Vollheim
d, Iagoba Jorge
e, Ion López
e, Wolfgang Osten
ba
Centre Spatial de Liège, Université de Liège, Liege Science Park, B-4031 Angleur (Liege),
Belgium;
bInstitut für Technische Optik, Universität Stuttgart, Pfaffenwaldring 9, D-70569,
Stuttgart, Germany;
cOptrion S.A., Boulevard de Colonster 4, B-4000 Liege;
dInfraTec GmbH,
Gostritzer Str. 61-63, D-01217 Dresden;
eCentro de Tecnologías Aeronáuticas, C/Juan de la Cierva
1, SP-01510Miñano (Álava)
ABSTRACT
Speckle interferometry with CO2 laser (10 micrometers) and microbolometer array has been developed and the final outcome is a mobile interferometer. The long wavelength allows to measure large deformations and is well immune against external perturbations, so as it can be used in field conditions. The technique is based on specklegram recording on the microbolometer array. The background of the specklegram is constituted by the thermal image of the object. Consequently the technique allows simultaneous observation of deformation and temperature difference when an object undergoes a given stress. We show several applications in aerospace nondestructive testing.
Keywords: Speckle interferometry, CO2 lasers, long-wave infrared, thermography, microbolometer arrays, nondestructive testing, composite materials, aerospace applications
1. INTRODUCTION
Electronic Speckle Pattern Interferometry (ESPI)[1][2] is a well known technique which is used for the non-contact measurement of solid objects full-field displacements, which can be determined through fringes patterns (interferograms) superimposed to the object image. The measurement range and other metrological parameters of holographic and speckle techniques depend on the laser wavelength λ[1][2]. In visible light they are often not well suited for field applications or for large displacement measurement due to the short wavelength used, which imposes high stability constraints. One way to decrease this sensitivity is to use a longer wavelength. Our purpose is to investigate holography and speckle interferometry in the long-wave infrared (LWIR) range and more specifically at 10 µm with CO2 lasers. This provides a typical 20 factor of decrease of the stability requirements; meanwhile the range of measurement is increased by the same factor. In a previous paper [3] we performed a review of potential holographic recording media in that spectral range and we concluded that no convincing photochemical material exists yet for holographic interferometry in the LWIR range. Furthermore it does not seem that research is currently ongoing in that field. For these reasons electronic hologram represents an interesting alternative in view of LWIR ESPI or digital holographic interferometry (DHI).
The very first evidence of such LWIR electronic recording was provided by Løkberg and Kwon in 1984[4] which showed ESPI with CO2 lasers associated with pyroelectric vidicon cameras. In 2003 Allaria et al.[5] proposed LWIR digital holography with a modified pyroelectric sensor array which allow imaging of static objects. They used a Mach-Zehnder configuration and showed the reconstruction of Fresnel digital holograms of a 700 µm mask object observed in transmission and later the reconstruction 3D shape of reflective objects [6]. Other LWIR array sensor technologies offer advantages over the pyroelectric, in particular uncooled microbolometers arrays which do not require artificial variations of light beams, as was shown by George et al. [7].
Our group works on developments of LWIR holographic techniques in view of full-field displacement metrology. Our preliminary results concerned out-of-plane and in-plane ESPI at 10 µm, and also lensless DHI[8][9]. Based on this, two separate projects followed. One concerned the study of LWIR DHI for the deformation metrology of large aspheric space reflectors under space simulated environment [3][10][11].
The other project (FANTOM) concerns the nondestructive testing (NDT) and nondestructive evaluation (NDE) of aeronautical composites and structures and is the topics of the present paper. This project is entitled FANTOM for "Full-field advanced non-destructive technique for on-line thermo-mechanical measurement on aeronautical structures" and was funded by the European Union in the FP7 frame. In the paper we will present results referred as obtained with the FANTOM system.
The basic concept of FANTOM is that LWIR ESPI allows simultaneous recording the specklegram and the thermogram of an object at any instant, and in each pixel. Indeed thermographic cameras are used to measure the intensity of light in that range, which can be correlated to temperature of the object (this constitutes the basis of the thermography technique). In addition, if a laser is used to illuminate the object in an interferometric set-up, like in ESPI, one is able to record both the coherent part (specklegram) and the incoherent (thermogram). This can be of major interest in numerous applications where the deformation and the temperature fields need to be correlated, like in thermomechanical assessment of structures undergoing thermal stresses generating deformations [12]. Also there has been recently a huge interest in different domains to correlate comparative measurement by holographic techniques and thermography for NDE of cultural heritage [13] and fault detection in composite materials [14][15][16]. In the latter, the deformation and temperature measurements are obtained by different techniques and deformation and temperature data or images have to be correlated, e.g. by coregistration. This can be fastidious and lead to error sources because the various technique to correlate have different field-of-view, image formats, perspective angles, etc. Here we propose a natural data fusion because a single array sensor records both signal in the same time and each pixel.
In this paper we will recall the basic principle of ESPI and describe the combination of temperature and deformation measurement by LWIR ESPI. Then we describe the set-up and present a series of applications, from the thermo-mechanical measurements on composites to defect detection performed on-site.
2. PRINCIPLE OF THE TECHNIQUE
2.1 Basic principles of ESPISpeckle interferometry consists in illuminating a diffusive object with a laser and superposing its image on a camera detector with a reference beam directly coming from the laser. Their interference on the detector produces intensity pattern (specklegram) given by
(1) where and are respectively the intensities of reference and object beams at the sensor level,
is the difference of and which are respectively the phases of the reference and object beams. We have omitted in (1) the contributions of incoherent noise sources and which would have added an intensity term on the right-hand side.
During the acquisition of the specklegrams the camera is synchronized with the phase shifting of the piezo element: a set of four images are recorded for positions of the MPZT mirror which induce a λ/2 phase shift between each acquisition. Therefore the phase shifted specklegrams are expressed as (leaving aside the dependency for a matter of simplicity):
(2)
with n = 1,2,3,4. Equation (2) is used to calculate the phase according to the well-known four buckets algorithm [1]:
If we record two such sets of four specklegrams and for two states of the object, noted a and b, one can compute their phases and . The phase difference can be related to the displacement d of each object point, imaged in each point of the camera . This relationship is given by:
(4)
where the sensitivity vector defined by is determined by the geometry of the set-up, with and are the
unit vectors of illumination and observation respectively. In section 3 we will present a series of phase maps which were obtained when composite samples undergo thermal loads.
2.2 Combination of thermography and ESPI
When speckle interferometry is applied at thermal wavelengths, the specklegram is recorded on a thermographic camera array sensor. The total intensity pattern can be expressed as the superposition of the specklegram , given by (1), and an incoherent thermal background (thermogram) term :
(5)
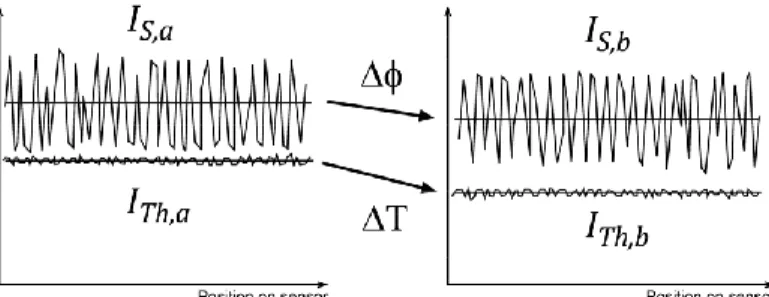
The situation is depicted in Figure 1 with the object in two different states. The left diagram shows schematically the line profile of the specklegram and the thermogram of the object at a given moment. Some instants later, the object has undergone a shape change, causing a phase variation , leading to a new specklegram . If the deformation occurs in the same time as a temperature change occurs, the thermal background will also vary from to .
Figure 1. Principle of combination of speckle interferometry and thermography in LWIR, with specklegrams and thermograms shown along a line and in two different object states a,b.
As a consequence, LWIR speckle interferometry should enable one to observe simultaneously shape and temperature changes, in each pixel. Usually the end-user needs separate temperature and deformation maps, therefore algorithm and procedure need to be developed to produce these two types of data. Before going further we must note that we do not measure the temperature itself but the intensity of the thermal radiation over the microbolometer spectral sensitivity range. The temperature itself can be determined by a calibration process. In the following when we speak about temperature variation, it is understood that it is in fact a difference in the intensity of the thermal radiation.
A first procedure is quite simple and consists in, first, capturing the total intensity (5) and performing the phase shifting, second, close a shutter at the laser output and, third, then record the thermogram alone. If one supposes that the thermal background has not changed between the first and second part of the procedure, then it is simple to subtract from the four intensities to find (n=1 to 4) given by (2) and compute the phase given by (3). Doing this procedure for different object states allows finding the deformation and temperature difference by simply calculating the phase and temperature differences respectively. This approach is valid as long as the phenomena to observe are much slower than the time to apply the above procedure (typically half a second).
A second procedure has been developed to observe fast object deformation and temperature changes. In that case, there is no separate measurement of by closing a shutter. Instead a sequence of phase-shifted interference patterns is captured continuously. Provide the object has not moved during the phase-shifting sequence, the phase can be computed through (3) and the deformation between two instants by using (4). Concerning the temperature variation, the post-processing is the following. For each object state, we use the set of phase shifted images which can be written as follows (taking into consideration equations (2) and (5).
(6.1) (6.2) (6.3) (6.4)
It is easy to see that summing the 4 images leads to
(7)
When recording the above sets of 4 phase-shifted images for 2 different object states and and considering that the reference and object beam intensities have not varied, we obtain an image of the temperature difference simply by computing
(8)
2.3 Set-up
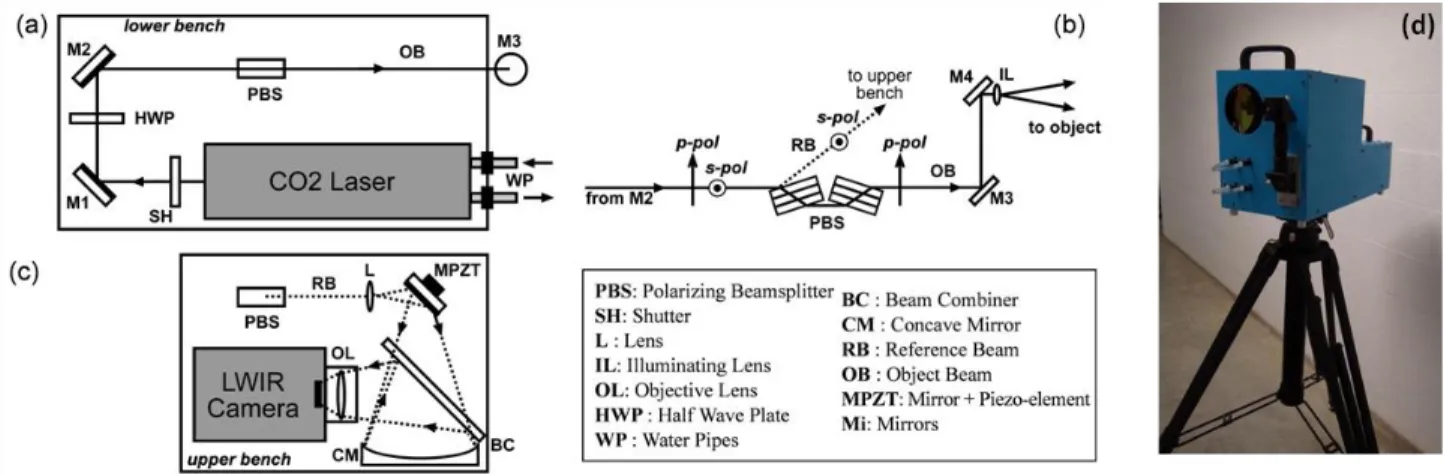
The development of the set-up we use was already presented in several papers: we studied various configurations such as LWIR DHI [17][18], ESPI [18] and shearography [18]. The camera is a Jenoptik Variocam HR based on an uncooled microbolometer array with 640x480 pixels, each pixel being 25 µm wide. The camera uses a frontal objective lens which cannot be removed to introduce the reference beam through a beam combiner placed between the objective lens and the array sensor, as is generally the case in visible holographic/speckle systems. In Reference [18] we discussed different configurations for the reference beam injection into the frontal objective lens of the microbolometer camera. Finally a large beam combiner is placed in front of the objective lens. After this development, we built a mobile setup which incorporates all the necessary components (laser, camera, beamsplitter, combiner, etc.) [19] which is shown in Figure 2. Except when stated, the results which will be presented in the next sections were obtained with the mobile setup. Figure 2(d) shows a picture of the system on a tripod. The FANTOM system is composed of two benches. The lower bench (Figure 2(a)) consists of the laser, a half-wave-plate (HWP) and a polarizing beamsplitter (PBS), Figure 2(b) gives in more detail the scheme of the separation between reference and object beams by the PBS. Figure 2(c) shows the upper bench with the thermographic camera and the large beam combiner (BC).
Figure 2. Mobile LWIR ESPI interferometer (FANTOM system): (a) lower bench with laser and separation stage, (b) principle of working of separation stage, (c) upper bench with camera and beam combiner, (d) picture of the instrument
3. APPLICATIONS
3.1 Demonstration of the combination on a sandwich panel with repair.With a laboratory setup discussed in a previous papers [18][20] we have performed the first demonstration of the thermography-ESPI combination. The sample was a sandwich panel made of carbon fiber reinforced plastic and honeycomb core. It has a circular repair made of another material. The experiment consisted in heating the sample with halogen lamps placed in front and on the back side of the sample (Figure 3(a)). A series of phase-shifted specklegrams were recorded before starting the lamp heating. After the heating is produced (a few seconds) series of phase-shifted specklegrams are recorded and the phase difference is calculated (Figure 3(b)). The phase unwrapping is performed (Figure 3(c)) in order to compute the deformation map (Figure 3(d)). From the same sets of images, the temperature variation is calculated, showing in red the highest temperature variations and in blue the lowest ones (Figure 3(e)). Figure 3(f) shows a 3D representation of both types of data compiled.
Figure 3. Demonstration of combined deformation-temperature variations measurement on a sandwich panel with circular repair (a). (b) shows the wrapped phase map, (c) the unwrapped phase map, (d) the 3D plot of the deformation, (e) the temperature variation, (f) a combined 3D plot of both the deformation and the temperature variation.
3.2 Thermo-mechanical behavior assessment of composite and hybrid coupons
The deformation of a series of coupons made of composites and steel superficial sheet were to be measured when heated at 150°. Such high temperature induces typically a few hundreds of microns deformation, In a previous paper [20] we already compared the measurement of large deformation with respect to holographic interferometry in visible with a photorefractive holographic camera [21]. The advantage of LWIR ESPI is that deformation can be measured which are larger by a factor of 20 when compared to visible holographic measurement. Indeed too many fringes would be observed in a too short time. Also the temperatures are so high that air turbulences around the samples would compromise the hologram capture in the visible.
Therefore we measured the deformation with a method not based on laser interferometry but instead on fringe projection. The latter consists in dimensional measurement at a given temperature when the object is stable. A white light fringe pattern is projected on the object which is digitized by 2 cameras. A post-processing is applied and the coordinates of surface points are retrieved allowing determining the profile of the object. A similar measurement is performed when the
object has moved or in our case is deformed when heated. The two sets of measurements are subtracted to obtain the deformation.
The set-up with separate fringe projection measurement head (ATHOS from GOM company) and thermal camera (from FLIR) is shown in Figure 4(a). Figure 4(b) shows a detail of the 3 coupons lying on a copper baseplate which is heated by mica heater attached on the back side. Figure 4(b) shows the deformation of the sample at 150°C. The deformation is coded in colors with the red the highest elevation of the sample in its central part. Figure 4(c) shows the temperature profiles of 2 on the 3 samples. Figure 4(e) and (f) show respectively the deformation and temperature signals obtained by the FANTOM system simultaneously.
Figure 4. (a) Comparison between results obtained for deformation measurements of coupons at 150° by fringe projection technique (b) with separate temperature measurements (c) and simultaneous results obtained with FANTOM (e) and (f).
3.3 Detection of defects in workshop conditions
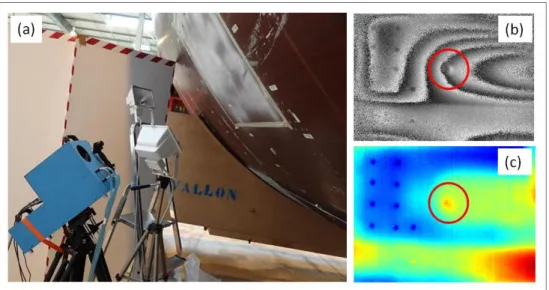
To demonstrate the advantages of the lower sensitivity of LWIR ESPI, we have tested it in the facilities of a leading aircraft manufacturer. Figure 5(a) shows the mobile FANTOM system in inspection position in front of a large composite fuselage with the inspection aera covered with removable white powder to allow backscattering into the camera, necessary for ESPI. We have investigated and successfully detected defects on composite structures in the presence of air conditioning fans, air disturbances due to the frequent opening and closing of the hangar door, as well as usual traffic and activities in industrial plants. The quality of the interferences observed where slightly decreased, but they were still good enough for defect detection, as can be seen at Figure 5(b), while Figure 5(c) shows the difference in temperature field at the same time of interferogram observation.
FANTOM thermogram FANTOM deformation
Coupons on heating baseplate
(d) (e) (f)
Thermogram Fringe projection deformation
Fringe projection + Thermographic camera
(a) (b) (c)
Coupons
Fringe projection Thermal camera
Coupons
Figure 5. Observation of a delamination in CFRP structure in workshop condition with the FANTOM system. (a) the instrument in typical working position in the testing facility, (b) Phase difference image showing the deformation, (c) Thermal difference image.
4. CONCLUSION
In this paper, we have presented a new technique consisting of long wave infrared ESPI using CO2 laser emitting at 10 µm and a microbolometer array camera sensitive in the 8-14 µm range. The interference pattern (specklegram) recorded by the infrared camera is affected advantageously by an uncoherent background coming from the thermal radiation of the observed object. This makes possible the simultaneous capture of two types of information, related to shape and temperature of the object. Therefore it is possible to deduce the deformation and temperature variations of objects when the latter is undergoing a deformation which is accompanied by temperature change.
We have shown the basis of the technique and how we process the recorded intensity pattern. We have presented the mobile setup used and shown a series of applications in nondestructive testing of aeronautical composite coupons and sample in the lab.
We also have shown an application in field condition, where the system was used in industrial working conditions for defect detection on a large composite fuselage. This proved also that holographic/speckle techniques at such long wavelengths can be exported outside laboratory.
These examples show how interesting can be the complementarity of techniques, like holography/speckle on one side and thermography on the other side, especially with a single instrument allowing perfect simultaneity of both measurements.
ACKNOWLEDGEMENTS
This work was funded by the FP7 European project FANTOM (ACP7-GA-2008-213457).
REFERENCES
[1] Kreis, T., [Holographic interferometry: principles and methods], Akademie Verlag (1996).
[2] Jones, R. and Wykes, C., [Holographic and Speckle Interferometry], Cambridge University Press (1989). [3] Georges, M.P., Vandenrijt, J-F., Thizy, C., Stockman, Y., Queeckers, P., Dubois, F., Doyle, D., “Digital
holographic interferometry with CO2 lasers and diffuse illumination applied to large space reflector metrology [invited]," Appl. Opt.52 (1), A102-A116 (2013)
[4] Løkberg, O. J. and Kwon, O., “Electronic speckle pattern interferometry using a CO2 laser,” Opt. Las. Tech., 187-192 (1984).
[5] Allaria, E., Brugioni, S., De Nicola, S., Ferraro, P., Grilli, S. and Meucci, R., “Digital holography at 10.6 µm,” Opt. Comm. 215, 257-262 (2003).
[6] De Nicola, S., Ferraro, P., Grilli, S., Meucci, R., Buah-Bassuah, P. K. and Arecchi, F. T., “Infrared digital reflective-holographic 3D shape measurements,” Opt. Comm. 281, 1445-1449 (2008).
[7] George, N., Khare, K. and Chi, W., “Infrared holography using a microbolometer array,” Appl. Opt. 47(4), A7-A12 (2008).
[8] Vandenrijt, J.-F. and Georges, M.. “Infrared electronic speckle pattern interferometry at 10 µm,” Proc. SPIE 6616, 66162Q (2007).
[9] Vandenrijt, J.-F., Georges, M. P., “Electronic speckle patter interferometry with microbolometer arrays at 10.6 µm,” Appl. Opt. 49, 5067-5075 (2010).
[10] Georges, M. P., Vandenrijt, J. Thizy, C., Stockman, Y., Queeckers, P., Dubois, F., Doyle, D., "Digital Holographic Interferometry With CO2 Laser Applied To Aspheric Space Reflector Testing," in Digital
Holography and Three-Dimensional Imaging, OSA Technical Digest (online) (Optical Society of America,
2013), DW3A.4.
[11] Vandenrijt, J. Thizy, C., Stockman, Y., Queeckers, P., Dubois, F., Doyle, D., Georges, M. P., "Long-wave infrared digital holographic interferometry with diffuser or point source illuminations for measuring deformations of aspheric mirrors", Opt. Eng. 53(11), 112309 (2014)
[12] Thizy, C., Eliot, F., Ballhause, D., Olympio, K.R., Kluge, R., Shannon, A., Laduree, G., Logut, D., Georges, M.P., "Holographic interferometry based on photorefractive crystal to measure 3D themo-elastic distortion of composite structures and comparison with finite element models", Proc. SPIE 8788, 878807 (2013)
[13] Ibarra-Castanedo, C., Sfarra, S., Ambrosini, D., Paoletti, D., Bendada, A., Maldague, X., "Diagnostics of panel paintings using holographic interferometry and pulsed thermography," Quantitative Infrared Thermography Journal 7(1), 85-114 (2010)
[14] Burleigh, D., "Portable combined thermography/shearography NDT system for inspecting large composite structures," Proc. SPIE 4710, 578-587 (2002)
[15] Sfarra, S., Ibarra-Castanedo, C., Bendada, A., Maldague, X., Ambrosini, D., Paoletti, D., "Comparative study for the nondestructive testing of advanced ceramic materials by infrared thermography and holographic interferometry," Proc. SPIE 7661, 76610Q (2010)
[16] Sfarra, S., Ibarra-Castanedo, C., Santulli, C., Sarasini, F., Ambrosini, D., Paoletti, D., Maldague, X.,"Eco-friendly laminates: From the indentation to non-destructive evaluation by optical and infared monitoring techniques," Strain 49(2), 175-189 (2013)
[17] Alexeenko, I., Vandenrijt, J.-F., Georges, M. P., Pedrini, G., Cédric, T., Osten, W. and Vollheim, B., “Digital holographic interferometry by using long wave infrared radiation (CO2 laser),” Applied Mechanics and Materials 24-25, 147-152 (2010).
[18] Alexeenko, I., Vandenrijt, J.-F., Pedrini, G., Thizy, C., Vollheim, B, Osten, W., Georges, M. P., “Nondestructive testing by using long-wave infrared interferometric techniques with CO2 lasers and microbolometer arrays," Appl. Opt. 52(1), A56-A67 (2013)
[19] Vandenrijt, J.-F., Thizy, C., Alexeenko, I., Pedrini, G., Rochet, J., Vollheim, B., Jorge, I., Venegas, P., Lopez I., Osten, W., Georges, M.P., "Mobile speckle interferometer in the long-wave infrared for aeronautical nondestructive testing in field conditions," Opt. Eng. 52(10), 101903 (2013)
[20] Georges, M. P., Vandenrijt, J.-F., Thizy, C., Alexeenko, I., Pedrini, G., Osten, W., "Speckle interferometry at 10 µm with CO2 lasers and microbolometers array," Proc. SPIE 8412, 84121O (2012)
[21] Lemaire, Ph., Georges, M., “Dynamic holographic interferometry: Devices and applications,” in Photorefractive Materials And Their Applications 3: Applications, P. Günter and J-P. Huignard, eds., Springer Series in Optical Sciences 115, 223-251 (2007)