LLAMA and obscuration
Local Luminous AGN with Matched Analogs
Leonard Burtscher, Ric Davies, Ming-yi Lin,
Gilles Orban de Xivry, David Rosario et al.
Max-Planck-Institut für extraterrestrische Physik
Garching
ESO AGN workshop 27 June 2016
LLAMA and obscuration
Local Luminous AGN with Matched Analogs
Leonard Burtscher, Ric Davies, Ming-yi Lin,
Gilles Orban de Xivry, David Rosario et al.
Max-Planck-Institut für extraterrestrische Physik
Garching
ESO AGN workshop 27 June 2016
Sample and rationale
A complete, hard X-ray selected local sample
Sample and rationale
A complete, hard X-ray selected local sample
hard X-ray selected
(14-195 keV)
CT fraction in local universe ~ 30%; we have 3/20 = 15%,
i.e. miss ~ 3 sources
Sample and rationale
A complete, hard X-ray selected local sample
The most luminous
local sources: AGN
activity is more than
just „weather“
hard X-ray selected
(14-195 keV)
CT fraction in local universe ~ 30%; we have 3/20 = 15%,
i.e. miss ~ 3 sources
Sample and rationale
A complete, hard X-ray selected local sample
Local AGNs: we can
resolve the
circum-nuclear star cluster
The most luminous
local sources: AGN
activity is more than
just „weather“
hard X-ray selected
(14-195 keV)
CT fraction in local universe ~ 30%; we have 3/20 = 15%,
i.e. miss ~ 3 sources
Davies, LB + 2015
optically obscured; only three are just X-ray absorbed. These
exceptions are “minor” since they are all close to the boundary
between the regimes. The X-ray absorbed AGN NGC 1365 is
optically classified as Sy 1.8 and, although in many studies is
taken to be a Sy 2, here we adopt a strict definition and so
classify it as Sy 1. Similarly MCG-05-23-016 is X-ray absorbed
and has only weak broad Hα, hence its previous classification
as a Sy 2 which we have revised to Sy 1.9. The Sy 1.8
NGC 2992 has a column only marginally above our X-ray
absorption threshold and so is on the borderline in both
classifications. It would be classified as X-ray unabsorbed
according to other definitions that set the threshold at 10
22cm
−2(Panessa & Bassani
2002
). As such, there could be two more
optically obscured and one less X-ray absorbed AGN than
found using the strict definitions we apply in Figure
6
. This is
reflected by the ranges shown in Figure
7
.
The joint optical/X-ray classifications are summarized in
Figure
6
where we adopt the terminology of Merloni et al.
(
2014
) in which the first/second digit of the classification
denotes the optical/X-ray type. This leads to the following
types:
type 11: optically unobscured and X-ray unabsorbed;
type 22: optically classified as Sy 2 and X-ray absorbed;
type 21: optically classified as Sy 2 but X-ray unabsorbed;
type 12: optically unobscured but X-ray absorbed.
Thus, with reference to the curves in Figure
7
adapted from
Merloni et al.
(
2014
) to the 14–195 keV luminosity scale, we
also have:
type 22+12: all X-ray absorbed AGNs
(regardless of their
optical classification);
type 22+21: all AGNs optically classified as Sy 2
(indepen-dent of whether they are X-ray absorbed
).
Comparing the AGNs in our sample to the left edge of
Figure
7
immediately highlights a discrepancy. Above, we
noted that 50%–60% of our complete sample are optically
obscured and classed as Sy 2s, a fraction similar to that
estimated by Lawrence & Elvis
(
2010
). However, Merloni
et al.
(
2014
) class
∼90% of their AGNs in an overlapping
luminosity range
log
L
14 195−∼
43
–
43.5 as Sy 2s. The
differ-ence is due to the large fraction of AGNs classified by these
authors as type 21, that is X-ray unabsorbed Sy 2 galaxies
(Pappa et al.
2001
; Panessa & Bassani
2002
; Brightman &
Nandra
2008
; Bianchi et al.
2012
).
4.2. How Common are X-Ray Unabsorbed Seyfert 2s?
X-ray unabsorbed Sy 2s are believed to be galaxies with a
direct view to the AGNs but in which there is no BLR
(such
objects are also known as pure or true Sy 2s
). This view is
supported by, for example, the six objects identified by
Hawkins
(
2004
) as having optical spectra typical of Sy 2s
(HβFWHM
< 1000 km s
−1and
[O
III]/Hβ
> 3) but large
amplitude variations typical of Sy 1s. Subsequent X-ray
observations of three by Gliozzi et al.
(
2007
) confirmed that
these do not have significant absorption in the 0.3–8 keV band.
These authors also showed that these AGNs are relatively
luminous
(intrinsic
log
L
0.5 8−>
43.2
). Thus, despite their
rather low Eddington ratios
L
bolL
Edd<
0.01
(Gliozzi
et al.
2007
), the absence of a BLR cannot be explained by
low luminosities and/or accretion rates either being unable to
sustain a disk wind
(Nicastro
2000
; Elitzur & Ho
2009
) or
meaning that high dispersion prevents BLR clouds from
surviving
(Laor
2003
). At present, the reason that they may not
have a BLR is still open.
These objects may be related to the Sy 2s for which
spectropolarimetry shows no evidence of a hidden BLR. There
have been many studies of polarized emission from hidden
BLRs. The largest indicate that Sy 2s in which a hidden BLR
has not been detected have less luminous AGNs than other
Sy 2s but are not more optically obscured
(Tran
2001
,
2003
;
Gu & Huang
2002
)—qualitatively, but not necessarily
quantitatively, consistent with the idea that BLR may not form
in low luminosity AGNs. It also suggests that a BLR is
completely absent in at least 50% of Sy 2s. However, this
fraction is difficult to put in perspective because of
complica-tions due to the impact of detection limits as well as the
expected scattering efficiency. The latter issue was addressed
by Heisler et al.
(
1997
) who showed that the ability to detect
polarized emission was related to the far-infrared colors in a
way that suggested the scattering particles were in the throat of
the torus, and so even they would be hidden at high
inclinations. Following on from work of Ramos Almeida
et al.
(
2011
) which shows that the intrinsic properties (rather
than just the inclination
) of the tori in Sy 1s and Sy 2s are
different, Ichikawa et al.
(
2015
) have fitted torus models to
Sy 2s with and without polarized emission. Their results again
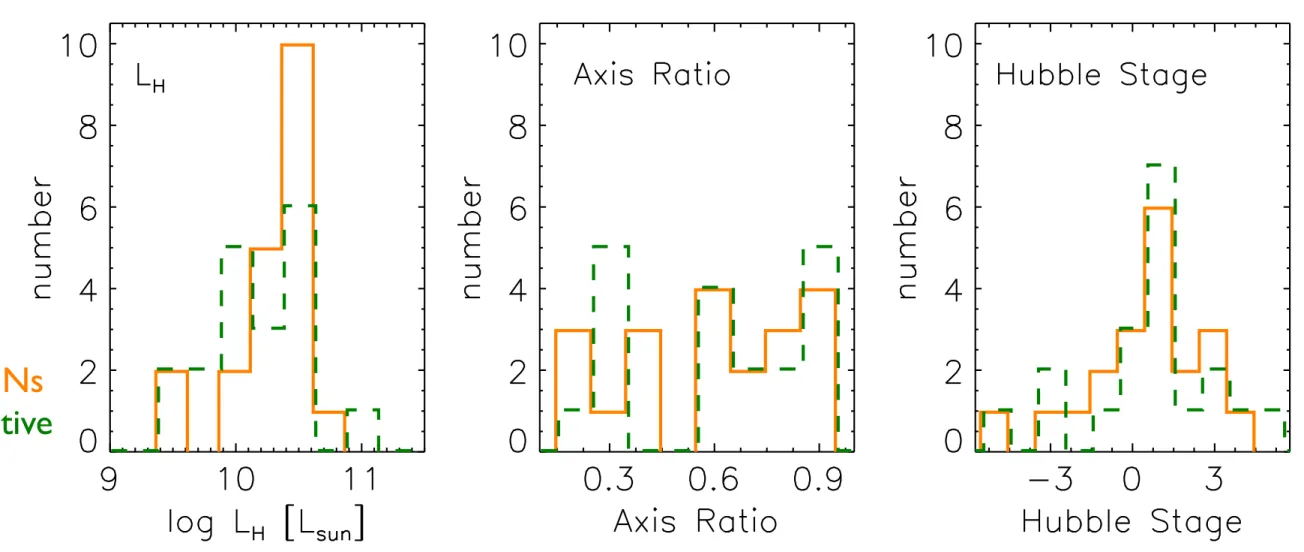
Figure 3. Comparison of several host galaxy properties between the hard X-ray selected AGNs (orange; solid lines or plusses), and the matched inactive sample (dark green; dashed lines or crosses): H-band luminosity as a proxy for stellar mass (far left), axis ratio (center left), Hubble type (center right), and H-band luminosity vs. distance (far right). There is no obvious relation between host galaxy luminosity and distance; and as expected by design, the distributions of the inactive sample properties match those of the AGNs very well. The biggest discrepancy is in distance, and this results from our preference to select closer, rather than more distant, inactive galaxies when possible.
7
The Astrophysical Journal, 806:127 (14pp), 2015 June 10 Davies et al.
AGNs
inactive
Leonard Burtscher: Infrared Interferometry of AGNs
The torus: more than obscuration
A starburst-AGN connection?
Leonard Burtscher: Infrared Interferometry of AGNs
The torus: more than obscuration
A starburst-AGN connection?
Davies+ 2007
powerful AGN
activity only in
post-starburst
nuclei?
Li
n+
(in
pr
ep)
• SINFONI IFU
cubes to analyze
gas inflow /
outflow
The next steps
A complete, hard X-ray selected local sample
Nuclear Stellar Kinematics of Hard X-ray Selected AGNs with Matched Inactive Galaxies
Abstract
In a matched sample of local, 14–195 keV selected active galactic nuclei (AGN) and inactive galaxies, we investigate the spatially resolved stellar kinematics and distributions on the scale of 10-300 pc. Here we present first results on part of the sample. We extract the observed stellar velocity fields and stellar velocity dispersion field of both AGNs and inactive galaxies. With larger scale 2MASS Ks band image, the disk, bar, and bulge have been decomposed. We find that there is a flux excess above the fitted bulge Sérsic profile in the innermost region. In the next step, we will search for evidence of dynamically cold nuclear stellar populations distinct from the bulge, and study the nuclear M/LK ratios. The key goal of this project is to understand the role of nuclear star formation in the AGN fueling process.
.
Sample Selection – Local Luminous AGN with Matched Analogs (LLAMA)
Extracting the Kinematic Map of CO(2-0) 2.29µm Stellar Absorption and Measuring Position Angle (PA)
Ming-Yi Lin
1,2,
Richard Davies
1,
Leonard Burtscher
1, David Rosario
1,31 – Max-Planck-Institut für extraterrestrische Physik, Gießenbachstr.1, 85748 Garching,
2 – Department of Physics, Ludwig-Maximilians-Universität München
3 – Department of Physics, Durham University, South Road, Durham DH1 3LE, UK
Decomposition and Nuclear Excess Flux
(Fig. 1) A complete volume-limited sample, selected from Swift/BAT 58 month all-sky catalogue. This is generally accepted as the least biased way to select AGN purely on their intrinsic luminosity. The criteria are: X-ray luminosity > 1042.5; z < 0.01; declination <15° (Davies et al. 2015).
(Tab. 1) First half VLT SINFONI H+K band 100mas (FOV 3”×3”) observations of the LLAMA sample. All targets have been extracted 2D kinematics maps of CO(2-0) 2.29µm stellar absorption. The detailed disk/bar/bulge decomposition has been studied with Pair 6 & Pair 8 (labeled as red).
Table 1
PA~155°
PA~55°
Method:
Results:
The kinematic PA measured from SINFONI is roughly consistent with the photometric PA derived from 2MASS image.
★ The stellar
velocity and
velocity dispersion
map of
Pair 5
:
Active galaxy
(Top: NGC 7582)
and
Inactive galaxy
(Bottom: NGC
4224).
★ The dashed line is
the fitted
kinematic PA.
★ Both galaxies
show a clear
stellar rotation.
Using Penalized Pixel-Fitting
(pPXF; Cappellari & Emsellem 2004):
Gemini spectral templates have been convolved to SINFONI H+K spectral resolution, we used it as stellar library.
Radius (arcsec) Radius (arcsec)
Bulge Bar Disk No excess flux Bulge
Disk Nuclear excess
flux
(GALFIT)
(GALFIT)
Method:
Results:
In order to look at whether there is an excess flux in the nucleus, we use larger scale 2MASS Ks band images to constrain the bulge Sérsic index(nbulge) and effective
radius(Rebulge). In our fitting procedure, ndisk is fixed to 1, Redisk, nbulge, Rebulge are free parameters. If a bar has been identified in the host galaxy, then we add a bar component.
★ We present the 2MASS GALFIT result and SINFONI 1D stellar continuum radial profile of
Pair 8
: Active galaxy (Top: NGC 6814) and Inactive galaxy (Bottom: NGC 4254).
★ We have analyzed
Pair 6 & Pair 8
.
Except NGC 6814 (Seyfert 1.5), other 3 galaxies show
clear excess flux above the Sérsic fit to bulge in the innermost region, which can be
explained as an additional inner component.
Bulge
Bulge
Cappellari et al. (2007) & Krajnovic et al. (2006)
Cappellari et al. 2007, MNRAS, 379, 418
Cappellari et al. 2010, AIP Conf. Proc. ,1240,211 Cappellari & Emsellem 2004, PASP, 16, 138
Davies et al. 2015, ApJ, 806, 127
Krajnovic et al. 2006, MNRAS, 366, 787 Peng et al. 2002, AJ, 124, 266
This project is a work in progress; we plan to combine the flux profile and dispersion profile to simultaneously
assess the evidence for a photometrically and kinematically distinct stellar population in the central tens of parsecs. With the observed velocity field, we can look for whether there is non-circular motion. We will also construct
dynamical models with Jeans Anisotropic Models method (Cappellari et al. 2010). The M/LK ratio can help us to constrain the age of the stellar population and understand whether BH accretion is associated with nuclear star formation.
References
Summary of the Next Steps
Peng et al. 2002
Li
n+
(in
pr
ep)
• SINFONI IFU
cubes to analyze
gas inflow /
outflow
• X-SHOOTER
spectra to robustly
analyze the star
formation histories
The next steps
A complete, hard X-ray selected local sample
Nuclear Stellar Kinematics of Hard X-ray Selected AGNs with Matched Inactive Galaxies
Abstract
In a matched sample of local, 14–195 keV selected active galactic nuclei (AGN) and inactive galaxies, we investigate the spatially resolved stellar kinematics and distributions on the scale of 10-300 pc. Here we present first results on part of the sample. We extract the observed stellar velocity fields and stellar velocity dispersion field of both AGNs and inactive galaxies. With larger scale 2MASS Ks band image, the disk, bar, and bulge have been decomposed. We find that there is a flux excess above the fitted bulge Sérsic profile in the innermost region. In the next step, we will search for evidence of dynamically cold nuclear stellar populations distinct from the bulge, and study the nuclear M/LK ratios. The key goal of this project is to understand the role of nuclear star formation in the AGN fueling process.
.
Sample Selection – Local Luminous AGN with Matched Analogs (LLAMA)
Extracting the Kinematic Map of CO(2-0) 2.29µm Stellar Absorption and Measuring Position Angle (PA)
Ming-Yi Lin
1,2,
Richard Davies
1,
Leonard Burtscher
1, David Rosario
1,31 – Max-Planck-Institut für extraterrestrische Physik, Gießenbachstr.1, 85748 Garching,
2 – Department of Physics, Ludwig-Maximilians-Universität München
3 – Department of Physics, Durham University, South Road, Durham DH1 3LE, UK
Decomposition and Nuclear Excess Flux
(Fig. 1) A complete volume-limited sample, selected from Swift/BAT 58 month all-sky catalogue. This is generally accepted as the least biased way to select AGN purely on their intrinsic luminosity. The criteria are: X-ray luminosity > 1042.5; z < 0.01; declination <15° (Davies et al. 2015).
(Tab. 1) First half VLT SINFONI H+K band 100mas (FOV 3”×3”) observations of the LLAMA sample. All targets have been extracted 2D kinematics maps of CO(2-0) 2.29µm stellar absorption. The detailed disk/bar/bulge decomposition has been studied with Pair 6 & Pair 8 (labeled as red).
Table 1
PA~155°
PA~55°
Method:
Results:
The kinematic PA measured from SINFONI is roughly consistent with the photometric PA derived from 2MASS image.
★ The stellar
velocity and
velocity dispersion
map of
Pair 5
:
Active galaxy
(Top: NGC 7582)
and
Inactive galaxy
(Bottom: NGC
4224).
★ The dashed line is
the fitted
kinematic PA.
★ Both galaxies
show a clear
stellar rotation.
Using Penalized Pixel-Fitting
(pPXF; Cappellari & Emsellem 2004):
Gemini spectral templates have been convolved to SINFONI H+K spectral resolution, we used it as stellar library.
Radius (arcsec) Radius (arcsec)
Bulge Bar Disk No excess flux Bulge
Disk Nuclear excess
flux
(GALFIT)
(GALFIT)
Method:
Results:
In order to look at whether there is an excess flux in the nucleus, we use larger scale 2MASS Ks band images to constrain the bulge Sérsic index(nbulge) and effective
radius(Rebulge). In our fitting procedure, ndisk is fixed to 1, Redisk, nbulge, Rebulge are free parameters. If a bar has been identified in the host galaxy, then we add a bar component.
★ We present the 2MASS GALFIT result and SINFONI 1D stellar continuum radial profile of
Pair 8
: Active galaxy (Top: NGC 6814) and Inactive galaxy (Bottom: NGC 4254).
★ We have analyzed
Pair 6 & Pair 8
.
Except NGC 6814 (Seyfert 1.5), other 3 galaxies show
clear excess flux above the Sérsic fit to bulge in the innermost region, which can be
explained as an additional inner component.
Bulge
Bulge
Cappellari et al. (2007) & Krajnovic et al. (2006)
Cappellari et al. 2007, MNRAS, 379, 418
Cappellari et al. 2010, AIP Conf. Proc. ,1240,211 Cappellari & Emsellem 2004, PASP, 16, 138
Davies et al. 2015, ApJ, 806, 127
Krajnovic et al. 2006, MNRAS, 366, 787 Peng et al. 2002, AJ, 124, 266
This project is a work in progress; we plan to combine the flux profile and dispersion profile to simultaneously
assess the evidence for a photometrically and kinematically distinct stellar population in the central tens of parsecs. With the observed velocity field, we can look for whether there is non-circular motion. We will also construct
dynamical models with Jeans Anisotropic Models method (Cappellari et al. 2010). The M/LK ratio can help us to constrain the age of the stellar population and understand whether BH accretion is associated with nuclear star formation.
References
Summary of the Next Steps
Peng et al. 2002
see poster B9 by Ming-Yi Lin
Bur
ts
cher+
(in
pr
ep)
Li
n+
(in
pr
ep)
• SINFONI IFU
cubes to analyze
gas inflow /
outflow
• X-SHOOTER
spectra to robustly
analyze the star
formation histories
• APEX data to
probe molecular
inventory (+ trying
to get ALMA +
HST…)
The next steps
A complete, hard X-ray selected local sample
Nuclear Stellar Kinematics of Hard X-ray Selected AGNs with Matched Inactive Galaxies
Abstract
In a matched sample of local, 14–195 keV selected active galactic nuclei (AGN) and inactive galaxies, we investigate the spatially resolved stellar kinematics and distributions on the scale of 10-300 pc. Here we present first results on part of the sample. We extract the observed stellar velocity fields and stellar velocity dispersion field of both AGNs and inactive galaxies. With larger scale 2MASS Ks band image, the disk, bar, and bulge have been decomposed. We find that there is a flux excess above the fitted bulge Sérsic profile in the innermost region. In the next step, we will search for evidence of dynamically cold nuclear stellar populations distinct from the bulge, and study the nuclear M/LK ratios. The key goal of this project is to understand the role of nuclear star formation in the AGN fueling process.
.
Sample Selection – Local Luminous AGN with Matched Analogs (LLAMA)
Extracting the Kinematic Map of CO(2-0) 2.29µm Stellar Absorption and Measuring Position Angle (PA)
Ming-Yi Lin
1,2,
Richard Davies
1,
Leonard Burtscher
1, David Rosario
1,31 – Max-Planck-Institut für extraterrestrische Physik, Gießenbachstr.1, 85748 Garching,
2 – Department of Physics, Ludwig-Maximilians-Universität München
3 – Department of Physics, Durham University, South Road, Durham DH1 3LE, UK
Decomposition and Nuclear Excess Flux
(Fig. 1) A complete volume-limited sample, selected from Swift/BAT 58 month all-sky catalogue. This is generally accepted as the least biased way to select AGN purely on their intrinsic luminosity. The criteria are: X-ray luminosity > 1042.5; z < 0.01; declination <15° (Davies et al. 2015).
(Tab. 1) First half VLT SINFONI H+K band 100mas (FOV 3”×3”) observations of the LLAMA sample. All targets have been extracted 2D kinematics maps of CO(2-0) 2.29µm stellar absorption. The detailed disk/bar/bulge decomposition has been studied with Pair 6 & Pair 8 (labeled as red).
Table 1
PA~155°
PA~55°
Method:
Results:
The kinematic PA measured from SINFONI is roughly consistent with the photometric PA derived from 2MASS image.
★ The stellar
velocity and
velocity dispersion
map of
Pair 5
:
Active galaxy
(Top: NGC 7582)
and
Inactive galaxy
(Bottom: NGC
4224).
★ The dashed line is
the fitted
kinematic PA.
★ Both galaxies
show a clear
stellar rotation.
Using Penalized Pixel-Fitting
(pPXF; Cappellari & Emsellem 2004):
Gemini spectral templates have been convolved to SINFONI H+K spectral resolution, we used it as stellar library.
Radius (arcsec) Radius (arcsec)
Bulge Bar Disk No excess flux Bulge
Disk Nuclear excess
flux
(GALFIT)
(GALFIT)
Method:
Results:
In order to look at whether there is an excess flux in the nucleus, we use larger scale 2MASS Ks band images to constrain the bulge Sérsic index(nbulge) and effective
radius(Rebulge). In our fitting procedure, ndisk is fixed to 1, Redisk, nbulge, Rebulge are free parameters. If a bar has been identified in the host galaxy, then we add a bar component.
★ We present the 2MASS GALFIT result and SINFONI 1D stellar continuum radial profile of
Pair 8
: Active galaxy (Top: NGC 6814) and Inactive galaxy (Bottom: NGC 4254).
★ We have analyzed
Pair 6 & Pair 8
.
Except NGC 6814 (Seyfert 1.5), other 3 galaxies show
clear excess flux above the Sérsic fit to bulge in the innermost region, which can be
explained as an additional inner component.
Bulge
Bulge
Cappellari et al. (2007) & Krajnovic et al. (2006)
Cappellari et al. 2007, MNRAS, 379, 418
Cappellari et al. 2010, AIP Conf. Proc. ,1240,211 Cappellari & Emsellem 2004, PASP, 16, 138
Davies et al. 2015, ApJ, 806, 127
Krajnovic et al. 2006, MNRAS, 366, 787 Peng et al. 2002, AJ, 124, 266
This project is a work in progress; we plan to combine the flux profile and dispersion profile to simultaneously
assess the evidence for a photometrically and kinematically distinct stellar population in the central tens of parsecs. With the observed velocity field, we can look for whether there is non-circular motion. We will also construct
dynamical models with Jeans Anisotropic Models method (Cappellari et al. 2010). The M/LK ratio can help us to constrain the age of the stellar population and understand whether BH accretion is associated with nuclear star formation.
References
Summary of the Next Steps
Peng et al. 2002
see poster B9 by Ming-Yi Lin
Bur
ts
cher+
(in
pr
ep)
First results: BLR properties and obscuration
Schnorr-Müller+ 2016 (re-submitted)
Broad Line Region in local Seyferts
15
658 660 662 664 500 1000 1500 2000 Hα 658 660 662 664 λ (nm) 500 1000 1500 2000 flux (10 − 17 erg s − 1 Å − 1 ) MCG−06−30−015 Hβ 484 486 488 490 492 494 λ (nm) 100 200 300 400 500 flux (10 − 17 erg s − 1 Å − 1 ) Hγ 430 432 434 436 438 440 442 444 λ (nm) 100 150 200 250 flux (10 − 17 erg s − 1 Å − 1 ) [OIII] Paβ 1275 1280 1285 1290 1295 1300 1305 λ (nm) 150 200 250 300 350 flux (10 − 17 erg s − 1 Å − 1 ) Paγ 1070 1080 1090 1100 1110 1120 λ (nm) 200 250 300 350 400 flux (10 − 17 erg s − 1 Å − 1 ) HeI Paδ 995 1000 1005 1010 1015 1020 1025 1030 λ (nm) 200 250 300 350 flux (10 − 17 erg s − 1 Å − 1 )
Figure 8. Observed Hα, Hβ, Hγ, Paβ, Paγ and Paδ line profiles from an integrated spectrum of the inner 1.′′2 (black), fitted broad (blue) and broad plus narrow (red) profiles lines. On the Hγ panel, we show in grey a combination of the fitted Hγ profile and the spectrum of an inactive galaxy, in order to illustrate that most of the differences between the observed and fitted profiles are due to the shape of the underlying stellar continuum. On the Paγ panel, broad He I was subtracted from the spectrum.
650 655 660 665 670 100 200 300 400 500 600 Hα 650 655 660 665 670 λ (nm) 100 200 300 400 500 600 flux (10 − 17 erg s − 1 Å − 1 ) NGC1365 Hβ 480 482 484 486 488 490 492 494 λ (nm) 40 60 80 100 120 flux (10 − 17 erg s − 1 Å − 1 ) Hγ 432 434 436 438 440 442 λ (nm) 20 30 40 50 60 flux (10 − 17 erg s − 1 Å − 1 ) [OIII] Paβ 1270 1280 1290 1300 1310 λ (nm) 100 120 140 160 180 200 flux (10 − 17 erg s − 1 Å − 1 ) Paγ 1080 1085 1090 1095 1100 1105 1110 λ (nm) 100 110 120 130 140 150 160 flux (10 − 17 erg s − 1 Å − 1 ) HeI Paδ 1000 1005 1010 1015 1020 1025 λ (nm) 90 100 110 120 130 140 150 flux (10 − 17 erg s − 1 Å − 1 ) FeII HeII
Figure 9. Observed Hα, Hβ, Hγ, Paβ, Paγ and Paδ line profiles from an integrated spectrum of the inner 1.′′2 (black), fitted broad (blue) and broad plus narrow (red) profiles lines. On the Hγ panel, we show in grey a combination of the fitted Hγ profile and the spectrum of an inactive galaxy, in order to illustrate that most of the differences between the observed and fitted profiles are due to the shape of the underlying stellar continuum. On the Paγ panel, broad He I was subtracted from the spectrum.
First results: BLR properties and obscuration
Schnorr-Müller+ 2016 (re-submitted)
6
A. Schnorr-M¨
uller et al.
9 10 11 12 13 14 17.0 17.5 18.0 18.5 19.0 19.5 20.0 9 10 11 12 13 14 log (n [cm−3]) 17.0 17.5 18.0 18.5 19.0 19.5 20.0 log ( Φ [cm − 2 s − 1 ]) MCG0514 MCG0523 MCG0630 NGC1365 NGC2992 NGC3783 NGC4235 NGC4593 NGC6814
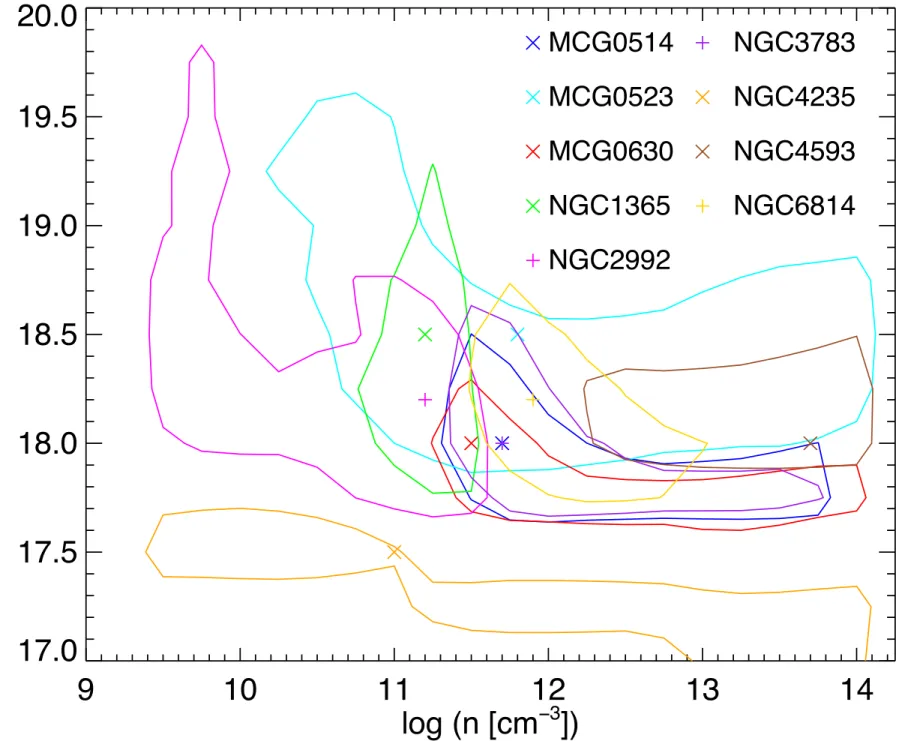
Figure 1. Ionising photon flux ΦH versus hydrogen number den-sity nH. The points show the location of best fit parameters ΦH and nH. These are defined as the median of grid points where the difference between each model and de-reddened observed line ratios is less than 20%. The extinction is optimised as a free pa-rameter independently at each grid point, and the resulting values are listed in Table 2. The contours delimit the regions correspond-ing to 1σ uncertainty on the derived parameters nH and ΦH. De-tails of the procedure are given in Section 3.3. Abbreviated name: MCG–05-14-012, MCG–05-23-16 and MCG–06-30-015.
as estimated from the He II lines for each object. The errors
in these estimates were derived assuming an uncertainty of
20% in the observed line ratios.
In the case of the H I lines, determining A
V(NLR), is a
straightforward process since, as outlined in Section
3.1.3
, a
fixed set of intrinsic line ratios can be assumed. Deriving the
extinction A
V(N LR) to the NLR was done during the step
of fitting and subtracting the narrow lines as described in
that Section. In Table
2
we list A
V(NLR) as estimated from
the H I lines for each object. The errors in A
Vestimates were
derived assuming an uncertainty of 20% in the observed line
ratios.
The extinction to the BLR is derived in a different way,
since the H I intrinsic line ratios are not known. To do so,
we followed these steps:
1) We compared the measured emission line ratios to
those derived from photoionisation calculations across
the entire density-flux plane. At each individual point
in the grid, we performed an independent
Levenberg-Marquardt least-squares minimisation to derive the best
fitting A
Vat that point. This results in a χ
2redmap
show-ing how well the observations can be matched by
pho-toionisation calculations for a wide range of density and
incident flux.
2) As an estimate of the error in the broad line fluxes
mea-surements is difficult to obtain, since it is dominated by
systematic effects, we adopted an uncertainty of 20% for
each line ratio (corresponding to a fiducial 10%
uncer-tainty on each line flux). From the resulting χ
2redvalues,
we are able to draw in the standard way the region
cor-Object AV (NLR) AV (BLR) H I He II H I He II MCG0514 0.7+0.7−0.7 0.2+0.3−0.2 0.0±0.2 0.0±0.3 MCG0523 1.6+0.6−0.8 1.3+0.3−0.4 7.7±1.3 4.2∗ MCG0630 2.4+0.7−0.8 1.5+0.3−0.3 2.8±0.4 3.0∗ NGC1365 1.3+0.7−0.7 2.2+0.4−0.3 4.2±0.5 4.4∗ NGC2992 2.8+0.7−0.8 3.2+0.3−0.3 4.7±0.5 4.5∗ NGC3783 0.0+0.6−0.0 - 0.1±0.2 -NGC4235 2.5+0.7−0.7 - 1.5±0.5 -NGC4593 0.0+0.6−0.0 - 0.0±0.1 -NGC6814 1.4+0.6−0.8 2.3+0.4−0.3 0.4±0.4 0.0±0.3
Table 2. Extinction to the narrow line region, AV (NLR), and ex-tinction to the broad line region, AV (BLR), derived from Balmer and Paschen H I line ratios and the He II λ4686/He II λ10126.4 line ratio as described in Section 3.3. In objects where broad He II λ4686 is not detected a lower limit to AV (BLR) was deter-mined from broad He II λ10126.4˚A. These lower limits are marked with an asterisk. Abbreviated name: 14-012, MCG–05-23-16 and MCG–06-30-015.
Object log(ΦH) log(nH) MCG0514 18.0±0.2 11.7±0.8 MCG0523 18.5±0.5 11.8±1.3 MCG0630 18.0±0.3 11.5±0.9 NGC1365 18.5±0.7 11.2±0.9 NGC2992 18.2±0.6 11.2±1.0 NGC3783 18.0±0.3 11.7±0.9 NGC4235 17.5±0.3 11.0±1.5 NGC4593 18.0±0.2 13.7±0.6 NGC6814 18.2±0.8 11.9±1.3
Table 3. Best fit parameters ΦH and nH. Abbreviated name: MCG–05-14-012, MCG–05-23-16 and MCG–06-30-015.
responding to 1σ uncertainty on the derived parameters
n
Hand Φ
Has shown in Fig.
1
.
3) In order to further constrain the range of valid grid
points, we apply an additional constraint that the
cal-culated ratios must all individually differ by less than
20% from the unreddened measured values. Grid points
that did not fulfil this criterion were discarded. If more
than one grid point fulfilled it, we calculated median
val-ues of n
H, Φ
H, A
V(BLR) and line ratios. From here on
we refer to the median values of the valid grid point as
best fitting values. The best fitting values of n
Hand Φ
Hare shown in tables
3
. The best fitting A
V(BLR) and
predicted line ratios values are listed in Table
4
. We note
that the median values of n
H, Φ
Hand A
V(BLR) are not
significantly affected by increasing the selection
thresh-old to 30%. It is only when we allow the calculated and
unreddened measured ratios to differ by 40% or more that
the differences become significant, because at that point
the density and photon flux become poorly constrained.
We also note that the grid points fulfilling our chosen
20% criterion cover a much smaller range in the n
H-Φ
Hplane than the range covered by the 1σ uncertainty
con-tours shown in Fig.
1
. Except for MCG–05-23-16 and
First results: BLR properties and obscuration
Schnorr-Müller+ 2016 (re-submitted)
6
A. Schnorr-M¨
uller et al.
9 10 11 12 13 14 17.0 17.5 18.0 18.5 19.0 19.5 20.0 9 10 11 12 13 14 log (n [cm−3]) 17.0 17.5 18.0 18.5 19.0 19.5 20.0 log ( Φ [cm − 2 s − 1 ]) MCG0514 MCG0523 MCG0630 NGC1365 NGC2992 NGC3783 NGC4235 NGC4593 NGC6814
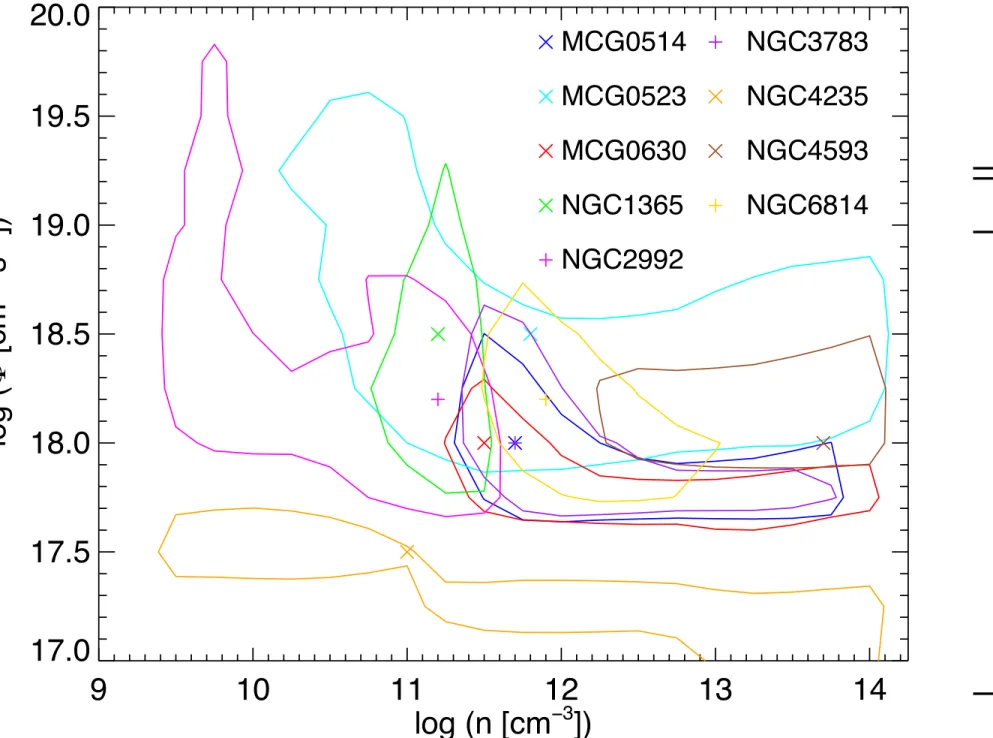
Figure 1. Ionising photon flux ΦH versus hydrogen number den-sity nH. The points show the location of best fit parameters ΦH and nH. These are defined as the median of grid points where the difference between each model and de-reddened observed line ratios is less than 20%. The extinction is optimised as a free pa-rameter independently at each grid point, and the resulting values are listed in Table 2. The contours delimit the regions correspond-ing to 1σ uncertainty on the derived parameters nH and ΦH. De-tails of the procedure are given in Section 3.3. Abbreviated name: MCG–05-14-012, MCG–05-23-16 and MCG–06-30-015.
as estimated from the He II lines for each object. The errors
in these estimates were derived assuming an uncertainty of
20% in the observed line ratios.
In the case of the H I lines, determining A
V(NLR), is a
straightforward process since, as outlined in Section
3.1.3
, a
fixed set of intrinsic line ratios can be assumed. Deriving the
extinction A
V(N LR) to the NLR was done during the step
of fitting and subtracting the narrow lines as described in
that Section. In Table
2
we list A
V(NLR) as estimated from
the H I lines for each object. The errors in A
Vestimates were
derived assuming an uncertainty of 20% in the observed line
ratios.
The extinction to the BLR is derived in a different way,
since the H I intrinsic line ratios are not known. To do so,
we followed these steps:
1) We compared the measured emission line ratios to
those derived from photoionisation calculations across
the entire density-flux plane. At each individual point
in the grid, we performed an independent
Levenberg-Marquardt least-squares minimisation to derive the best
fitting A
Vat that point. This results in a χ
2redmap
show-ing how well the observations can be matched by
pho-toionisation calculations for a wide range of density and
incident flux.
2) As an estimate of the error in the broad line fluxes
mea-surements is difficult to obtain, since it is dominated by
systematic effects, we adopted an uncertainty of 20% for
each line ratio (corresponding to a fiducial 10%
uncer-tainty on each line flux). From the resulting χ
2redvalues,
we are able to draw in the standard way the region
cor-Object AV (NLR) AV (BLR) H I He II H I He II MCG0514 0.7+0.7−0.7 0.2+0.3−0.2 0.0±0.2 0.0±0.3 MCG0523 1.6+0.6−0.8 1.3+0.3−0.4 7.7±1.3 4.2∗ MCG0630 2.4+0.7−0.8 1.5+0.3−0.3 2.8±0.4 3.0∗ NGC1365 1.3+0.7−0.7 2.2+0.4−0.3 4.2±0.5 4.4∗ NGC2992 2.8+0.7−0.8 3.2+0.3−0.3 4.7±0.5 4.5∗ NGC3783 0.0+0.6−0.0 - 0.1±0.2 -NGC4235 2.5+0.7−0.7 - 1.5±0.5 -NGC4593 0.0+0.6−0.0 - 0.0±0.1 -NGC6814 1.4+0.6−0.8 2.3+0.4−0.3 0.4±0.4 0.0±0.3
Table 2. Extinction to the narrow line region, AV (NLR), and ex-tinction to the broad line region, AV (BLR), derived from Balmer and Paschen H I line ratios and the He II λ4686/He II λ10126.4 line ratio as described in Section 3.3. In objects where broad He II λ4686 is not detected a lower limit to AV (BLR) was deter-mined from broad He II λ10126.4˚A. These lower limits are marked with an asterisk. Abbreviated name: 14-012, MCG–05-23-16 and MCG–06-30-015.
Object log(ΦH) log(nH) MCG0514 18.0±0.2 11.7±0.8 MCG0523 18.5±0.5 11.8±1.3 MCG0630 18.0±0.3 11.5±0.9 NGC1365 18.5±0.7 11.2±0.9 NGC2992 18.2±0.6 11.2±1.0 NGC3783 18.0±0.3 11.7±0.9 NGC4235 17.5±0.3 11.0±1.5 NGC4593 18.0±0.2 13.7±0.6 NGC6814 18.2±0.8 11.9±1.3
Table 3. Best fit parameters ΦH and nH. Abbreviated name: MCG–05-14-012, MCG–05-23-16 and MCG–06-30-015.
responding to 1σ uncertainty on the derived parameters
n
Hand Φ
Has shown in Fig.
1
.
3) In order to further constrain the range of valid grid
points, we apply an additional constraint that the
cal-culated ratios must all individually differ by less than
20% from the unreddened measured values. Grid points
that did not fulfil this criterion were discarded. If more
than one grid point fulfilled it, we calculated median
val-ues of n
H, Φ
H, A
V(BLR) and line ratios. From here on
we refer to the median values of the valid grid point as
best fitting values. The best fitting values of n
Hand Φ
Hare shown in tables
3
. The best fitting A
V(BLR) and
predicted line ratios values are listed in Table
4
. We note
that the median values of n
H, Φ
Hand A
V(BLR) are not
significantly affected by increasing the selection
thresh-old to 30%. It is only when we allow the calculated and
unreddened measured ratios to differ by 40% or more that
the differences become significant, because at that point
the density and photon flux become poorly constrained.
We also note that the grid points fulfilling our chosen
20% criterion cover a much smaller range in the n
H-Φ
Hplane than the range covered by the 1σ uncertainty
con-tours shown in Fig.
1
. Except for MCG–05-23-16 and
MNRAS 000, 000–000 (0000)
Broad Line Region in local Seyferts
9
Object
r
bMCG–05-14-012
1.0
MCG–05-23-16
0.5
MCG–06-30-015
1.0
NGC1365
0.7
NGC2992
0.8
NGC3783
0.8
NGC4235
1.8
NGC4593
0.9
NGC6814
0.9
Table 5. Distance from the nucleus to the broad H I emitting
region in terms of the dust sublimation radius (see Section
4.1
for
details).
sionally suppressed at densities larger than 10
9.5cm
−3.
Re-verberation mapping studies of nearby AGN found that
both Hβ and C III] λ 1909˚
A have similar time lags,
im-plying they are produced at similar radii, in the outer
part of the BLR (
Onken & Peterson 2002
;
Trevese et al.
2014
), thus one might expect the H I emitting gas and
C III] λ 1909˚
A have similar densities. Regarding this issue,
we note that a broad range of densities is expected in a
sin-gle cloud with N
H≈ 10
23cm
−2, so a density of 10
11cm
−3for Hβ and 10
9.5cm
−3for C III] λ 1909˚
A is consistent with
reverberation mapping results. For an additional discussion
on broad C III] λ 1909˚
A and Hβ, we refer to
Korista et al.
(
1997
) where maps of emission line equivalent widths in the
density–ionising photon flux plane are shown. There one can
see that the gas that is responsible for C III] λ 1909˚
A
con-tributes to Hβ at a typical fraction of
≈ 20–40% of that
found in gas at densities > 10
11cm
−3, all else being equal
(see their Figs. 3e and 3g). Additionally, it is important to
consider that Hβ is emitted in most gas clouds that emit
C III] λ 1909˚
A, but the reverse is not true. So in this sense,
the present work is indicating that a majority fraction of the
optical and NIR H I emission lines are emitted in dense gas
(n >> 10
9.5cm
−3).
In the RPC models of
Baskin et al.
(
2014
), both Hβ and
C III] λ 1909˚
A are predominantly produced at radii close to
the dust sublimation radius, that is towards the outer part
of the BLR (see their Fig. 5). In their canonical model (for
which L
AGN= 10
45erg/s), C++ is found at column densities
through a cloud a little less than neutral hydrogen (see their
Fig. 3). For clouds in the outer part of the BLR, the range
of columns corresponds to a regime in which the volume
density drops rapidly from 10
11cm
−3(the density at which
the H I emission arises) to 10
9cm
−3(see their Fig. 2). Since
the critical density for C III] λ 1909˚
A is
≈ 10
9.5cm
−3, the line
emission is collisionally suppressed. Thus the H I lines and
the C III] λ 1909˚
A line can arise in the same part of the BLR,
from gas that is at different densities in the same clouds.
The RPC model predicts, without any free parameters,
not only that the density of the gas where H I lines are
pro-duced most strongly is
∼ 10
11cm
−3, but that the clouds
with suitable conditions are located predominantly halfway
to the dust sublimation radius.
We can test this prediction using the photon fluxes
listed in table
3
. These are relatively well constrained to lie
in the range 10
17.5-10
18.5cm
−2s
−1, comparable to the
val-ues found by
Ruff et al.
(
2012
) for their four QSOs. Since
we know the 14–195 keV luminosities for all our targets (list
in Table
1
) we can calculate the distance from the AGN
at which the ionising photon flux matches those derived
from the line ratios, for a given spectral energy
distribu-tion (SED). The adopted SED is important since it
deter-mines the extrapolation of the photon rate from 14 keV down
to 13.6 eV. When calculating the photoionisation models,
Korista & Goad
(
2004
) used an SED comprising a power
law with an additional UV bump as shown in Fig. 1 of
Korista et al.
(
1997
). We prefer to adopt the SED derived for
NGC 1068 by
Pier et al.
(
1994
), since this object is
compa-rable to the AGN we have analysed here. However, we note
that it leads to lower extrapolated photon fluxes, and hence
small radii, than the SED used by
Korista et al.
(
1997
).
Fi-nally, in order to scale the results to the dust sublimation
radius R
dust, we adopt R
dust∼ 0.2 pc for an AGN
bolo-metric luminosity of 10
45erg s
−1as given by
Netzer
(
2015
)
for graphite grains. However, as
Netzer
(
2015
) notes, this
distance depends on the size and type of grain as well as
the anisotropy of the central radiation source, and therefore
R
dustshould not be considered too strictly as being at a
fixed location.
The resulting distances are listed in Table
5
. With the
exception of MCG–05-23-16, for which the photon flux is
poorly constrained as it was estimated based on only three
line ratios, and NGC 4235, which have the lowest photon flux
in the sample, the H I emitting region is close to (or even at)
the dust sublimation. This matches the expectations of the
RPC model, and is also in agreement with other theoretical
studies which suggested broad Paschen and Balmer lines in
large part come from the outer BLR, near or at the dust
sublimation radius (
Zhu et al. 2009
;
Czerny & Hryniewicz
2011
;
Mor & Netzer 2012
).
4.2
Predicted Line Ratios
Here we compare the predicted broad line ratios for the
objects in our study with measured line ratios in Seyfert
1/QSO samples in previous studies.
Dong et al.
(
2008
) measured the broad Hα/Hβ line
ra-tio on a sample of 446 nearby Seyfert 1 and quasi-stellar
objects that have blue continua (in order to minimise the
effects of dust extinction). The measured broad Hα/Hβ line
ratios range from 2.3 to 4.2, skewed towards the large ratio
end. This distribution is well described by a log-Gaussian
with a peak of 3.06 and a standard deviation of 0.03 dex.
La Mura et al.
(
2007
) measured the Hα/Hβ in 90 nearby
(z
! 0.368) type 1 AGNs and they obtained a median of
3.45
± 0.65, while the measured ratios ranged from 1.56 to
4.87.
Zhou et al.
(
2006
) measured the broad Hα/Hβ line
ratio in a sample of 2000 narrow-line Seyfert 1s and they
obtained an average ratio of Hα/Hβ = 3.03 with a
disper-sion of
≈ 0.36. In a sample of broad line AGN with low
starlight contamination,
Greene & Ho
(
2005
) found a mean
total (narrow and broad) Hα/Hβ ratio of 3.5
The line ratios we observe for the unreddened Seyfert 1s
MGC-05–14–012, NGC 3783 and NGC 4593 are in good
agreement with these other observational studies; as is the
predicted line ratio for NGC 6814, MCG–06–30–015 and
MCG-05–23–16, the latter based on the best fit to the Hα
and Pa lines, and for which we derived a substantial
ex-tinction of A
V(BLR) = 7.7 mag. In contrast, the
dered-dened line ratios for NGC 1365, NGC 2992, NGC 4235 are
MNRAS 000, 000–000 (0000)
Hydrogen emitting
clouds are ~ at
sublimation radius
A near-IR
high-resolution atlas
of local AGNs
Bur
ts
cher+
2015
Dilution of stellar light
by the AGN continuum
Leonard Burtscher: What causes AGN activity?
Spectral decomposition
NGC 1386 (Sy 2)
9Burtscher+ 2015
2.05 2.10 2.15 2.20 2.25 2.30 2.35 rest wavelength µm 0.0 0.2 0.4 0.6 0.8 1.0 1.2 1.4 1.6 F lu x den si ty Br H2 (1-0) S(1) H2 (1-0) S(0) [CaVIII] NaI CaI 12 CO (2-0) 12 CO (3-1) H2 (2-1) S(1) H eI 2.155 2.160 2.165 2.170 2.175 2.180 0.98 1.00 1.02 1.04 1.06 1.08 1.10 FWHM 1 = 298 km/s FWHM 2 = 325 km/sStars
Hot dust
A robust way to estimate
the obscuration
4
6
8
10
400
600
800
1000
1200
1400
1600
4
6
8
10
K−N
400
600
800
1000
1200
1400
1600
K band color temperature
ESO548 M87 MCG523 NGC1365 NGC1566 NGC2110 NGC2992 NGC3227 NGC3783 NGC4051 NGC4593 NGC5506 NGC6814 NGC7469 NGC7582 Circinus IC5063 NGC1068 NGC1386 NGC3081 NGC3281 NGC4388 NGC5128 NGC5135 NGC6300 NGC7172 NGC1052 NGC4579 Seyfert 1 Seyfert 1i Seyfert 2 LINER
Burtscher+ 2015
A robust way to estimate
the obscuration
4
6
8
10
400
600
800
1000
1200
1400
1600
4
6
8
10
K−N
400
600
800
1000
1200
1400
1600
K band color temperature
ESO548 M87 MCG523 NGC1365 NGC1566 NGC2110 NGC2992 NGC3227 NGC3783 NGC4051 NGC4593 NGC5506 NGC6814 NGC7469 NGC7582 Circinus IC5063 NGC1068 NGC1386 NGC3081 NGC3281 NGC4388 NGC5128 NGC5135 NGC6300 NGC7172 NGC1052 NGC4579 Seyfert 1 Seyfert 1i Seyfert 2 LINER
5 mag
(A
V)
Burtscher+ 2015
•
color
temperature
consistent with
optical
appearance →
obscuration
A robust way to estimate
the obscuration
4
6
8
10
400
600
800
1000
1200
1400
1600
4
6
8
10
K−N
400
600
800
1000
1200
1400
1600
K band color temperature
ESO548 M87 MCG523 NGC1365 NGC1566 NGC2110 NGC2992 NGC3227 NGC3783 NGC4051 NGC4593 NGC5506 NGC6814 NGC7469 NGC7582 Circinus IC5063 NGC1068 NGC1386 NGC3081 NGC3281 NGC4388 NGC5128 NGC5135 NGC6300 NGC7172 NGC1052 NGC4579 Seyfert 1 Seyfert 1i Seyfert 2 LINER
5 mag
(A
V)
Burtscher+ 2015
✓ r1500K r300K ◆2•
color
temperature
consistent with
optical
appearance →
obscuration
•
normalization
consistent with
observed radii
of hot/warm
dust
Obscuration: Torus vs. BLR
Burtscher+ 2016
Torus obscuration A
V
[mag]
X
-ra
y
co
lum
n
[lo
g
N
_H
/
cm
^-2]
Obscuration: Torus vs. BLR
Burtscher+ 2016
Torus obscuration A
V
[mag]
X
-ra
y
co
lum
n
[lo
g
N
_H
/
cm
^-2]
Obscuration: Torus vs. BLR
Maiolino+2010
Burtscher+ 2016
Torus obscuration A
V
[mag]
X
-ra
y
co
lum
n
[lo
g
N
_H
/
cm
^-2]
Obscuration: Torus vs. BLR
Maiolino+2010
Burtscher+ 2016
Torus obscuration A
V
[mag]
X
-ra
y
co
lum
n
[lo
g
N
_H
/
cm
^-2]
Absorption in the dusty torus
Absorption in the dust-free BLR
Obscuration: Torus vs. BLR
Broad Line Region in local Seyferts
11
and so in this section we discuss whether that is necessarily
the case.
In Fig.
3
we compare the extinction to the NLR to the
extinction to the BLR. In three sources where the BLR is
un-obscured, there is also no obscuration to the NLR, which is
expected. Three sources have A
V(BLR)
≃ A
V(NLR) within
errors, which implies in these cases an obscuring structure
at larger scales than the NLR. In the Seyfert 1.8/1.9s in our
sample, the extinction to the NLR is substantially smaller:
1.9 mag in NGC 2992, 2.9 mag in NGC 1365 and 6.1 mag in
MGC –05-23-16. This implies that the extinction to the BLR
is due to dusty structures that are more compact than the
NLR. This could be the torus, and, in fact, previous
stud-ies of the spectral variation in the broad lines and
contin-uum of Seyfert 1.8/1.9s (
Goodrich 1989
;
Tran et al. 1992
;
Goodrich 1995
) showed that, in some of these objects, the
variations were consistent with changes in reddening, and
the time scales involved pointed to the obscuring source
be-ing close to the BLR, i.e., the torus. On the other hand,
dusty nuclear spirals and filaments are also a possibility: in
a recent study,
Prieto et al.
(
2014
) found that dusty nuclear
spirals and filaments on scales of tens of parsecs to a
hun-dred parsecs can cause moderate extinction to the nucleus,
in the range A
V= 3–6 mag.
Such structures can in principle account for the
extinc-tion to the BLR in NGC 1365 and NGC 2992, but they
can-not account for the extinction to the BLR in MCG–05-23-16.
This latter object was one of those observed by
Prieto et al.
(
2014
), who found the filament crossing the nucleus causes
only a small amount of extinction, A
V≈ 1 mag. This
im-plies the extinction to the BLR of MCG–05-23-16 occurs on
a much smaller scale.The mid-IR emission in AGNs tracing
the warm dust is typically located on scales < 50 pc for the
AGNs in our luminosity range, and specifically in the case of
MCG–05-23-016, the half-light radius of the mid-IR emission
is
≈2 pc as found by interferometry (
Burtscher et al. 2013
).
Thus, in the case of MCG–05-23-16, considering the large
difference between the extinction to the NLR and BLR, the
fact that high spatial resolution observations showed that
the dust filament crossing its nucleus causes only a small
amount of extinction (
Prieto et al. 2014
) and the size of the
half-light radius of the mid-IR emission (
Burtscher et al.
2013
), we argue the torus is the structure obscuring the
BLR.
4.5
X-ray absorption and optical extinction
A quantitative comparison between extinction and
X-ray absorbing column has recently been presented by
Burtscher et al.
(
2016
) – and we refer to these authors for
a discussion of other results in the literature on this topic.
They showed that when one takes into account the
variabil-ity in the X-ray absorbing column, its lower limit is
con-sistent with the measured optical extinction for the
Galac-tic gas-to-dust ratio; and they argued that deviations from
this can be explained as absorption by dust-free neutral gas
within the BLR. The extinction used by these authors was
derived using the ‘dust colour’ method of
Burtscher et al.
(
2015
), and is a measure of the extinction to the hot (
∼
1500 K) dust.
Because this probes nearly all the way to the BLR, it
can be used as a proxy for the extinction to the BLR. But
0 2 4 6 8 10 19 20 21 22 23 0 2 4 6 8 10 AV to the BLR (mag) 19 20 21 22 23 log(N H [cm − 2 ]) MCG−05−14−012 MCG−05−23−16 NGC1365 NGC2992 NGC3783 NGC4593 MCG−06−30−015 NGC4235 NGC6814
Figure 4. A
Vto the broad line region versus X-ray absorbing
column N
H, adapted from a similar figure by
Burtscher et al.
(
2016
). The vertical dashed lines denote the range of absorbing
columns in the literature, which indicates the minimum variability
for each object. The N
Hvalue for MCG –05-14-012 is an upper
limit. The thick grey line represents the Galactic standard
gas-to-dust ratio (
Predehl & Schmitt 1995
;
Nowak et al. 2012
).
also because of that, we re-visit this issue here and look at
whether their conclusion is upheld when using the extinction
derived directly from the broad lines themselves.
We plot A
V(BLR) versus the X-ray absorbing columns
in Fig.
4
. The thick grey curve gives the range of relations
us-ing the Galactic gas-to-dust ratio (N
H/A
V)
Galactic= (1.79–
2.69)
×10
21cm
−2(
Predehl & Schmitt 1995
;
Nowak et al.
2012
). The observed range of N
Hfor each object,
trac-ing variations in X-ray absorbtrac-ing column, are indicated by
dashed lines. When N
Hvariation is taken into account,
all objects in this study show that the lower end of their
range of N
H/A
Vratios is consistent with the Galactic
gas-to-dust ratio. In particular, we have 6 objects in common
with
Burtscher et al.
(
2016
), and the A
Vderived here from
the broad lines measurements is consistent with – and more
precise than – that derived with the dust colour method
presented by
Burtscher et al.
(
2016
). As such, our analysis
confirms their result.
4.6
Seyfert sub-type and Extinction to the Broad
Line Region
Finally, we also look at the relation between Seyfert
sub-type (as discussed in Section
3.4
) and the extinction to the
BLR, which are plotted in Fig.
5
. There is a clear separation
between Seyfert 1-1.2s and Seyfert 1.8-1.9s: Seyfert 1-1.2s
are either unabsorbed objects or mildly absorbed objects,
while Seyfert 1.8-1.9s are affected by substantial
obscura-tion to the BLR, in the range 4–8 mag. Our result is
con-sistent with earlier studies that suggested that these
inter-mediate AGN categories are comprised mostly of partially
obscured Seyfert 1s (
Goodrich 1989
,
1995
;
Dong et al. 2005
),
the remaining being objects with low AGN continuum flux
(
Rudy et al. 1988
;
Trippe et al. 2010
). And it supports the
MNRAS 000, 000–000 (0000)
Schno
rr
-M
ül
ler+
2016
(r
e-submi
tted
)
X
-ra
y
co
lum
n
[lo
g
N
_H
/
cm
^-2]
BLR obscuration A
V
[mag]
Obscuration: Torus vs. BLR
Bur
ts
cher+
2016
Schno
rr
-M
ül
ler+
2016
(r
e-submi
tted
)
H
ot
d
us
t
ob
sc
ura
tio
n
A
V
[mag]
BLR obscuration A
V
[mag]
Hot dust obscuration:
Uncertainties (<~ 5 mag)
due to intrinsic temperature
of hot dust
Resolving AGN tori
Outlook
Resolving AGN tori
Outlook
•
GRAVITY; MATISSE: 2
ndgeneration VLTI instrument offering phases
(imaging), higher resolution (L band, and N) and more efficiency (4 beams)
Resolving AGN tori
Outlook
•
GRAVITY; MATISSE: 2
ndgeneration VLTI instrument offering phases
(imaging), higher resolution (L band, and N) and more efficiency (4 beams)
•
E-ELT/METIS
Resolving AGN tori
Outlook
•
GRAVITY; MATISSE: 2
ndgeneration VLTI instrument offering phases
(imaging), higher resolution (L band, and N) and more efficiency (4 beams)
•
E-ELT/METIS
•
resolve large-scale „torus“ component found with MIDI: determine
the kinematics of the wind launching region
Resolving AGN tori
Outlook
•
GRAVITY; MATISSE: 2
ndgeneration VLTI instrument offering phases
(imaging), higher resolution (L band, and N) and more efficiency (4 beams)
•
E-ELT/METIS
•
resolve large-scale „torus“ component found with MIDI: determine
the kinematics of the wind launching region
•
resolve stellar populations very close to nearby AGNs
AGN NIR luminosity relations
Burtscher+ 2015
Leonard Burtscher: Where is the torus? Black hole and accretion disk
OB
late-type
stars
(1) inflow + starburst
(2) supernovae + turbulence
Leonard Burtscher: Where is the torus? Black hole and accretion disk
OB
late-type
stars
(1) inflow + starburst
(2) supernovae + turbulence
Leonard Burtscher: Where is the torus? Black hole and accretion disk
OB
late-type
stars
(1) inflow + starburst
(2) supernovae + turbulence
Leonard Burtscher: Where is the torus?
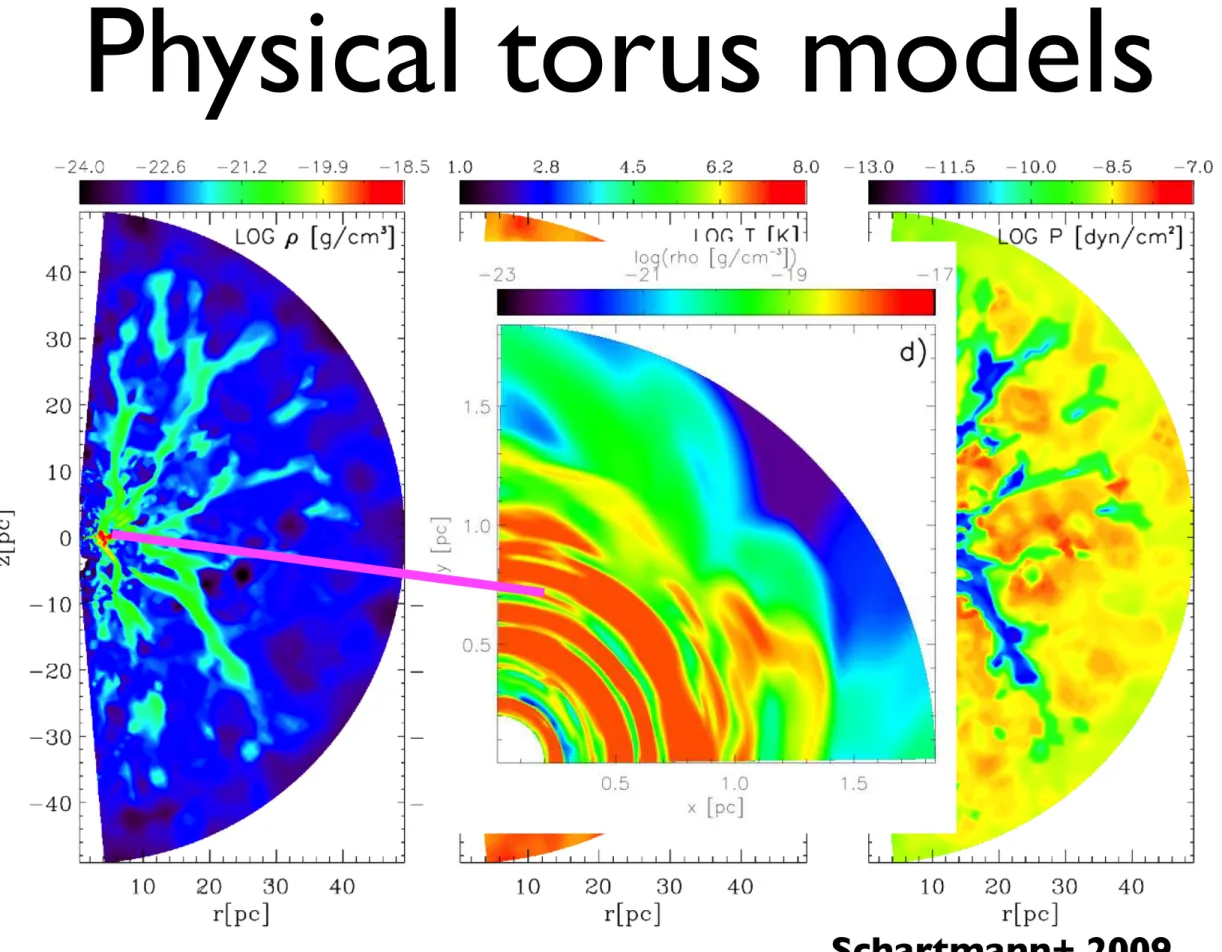
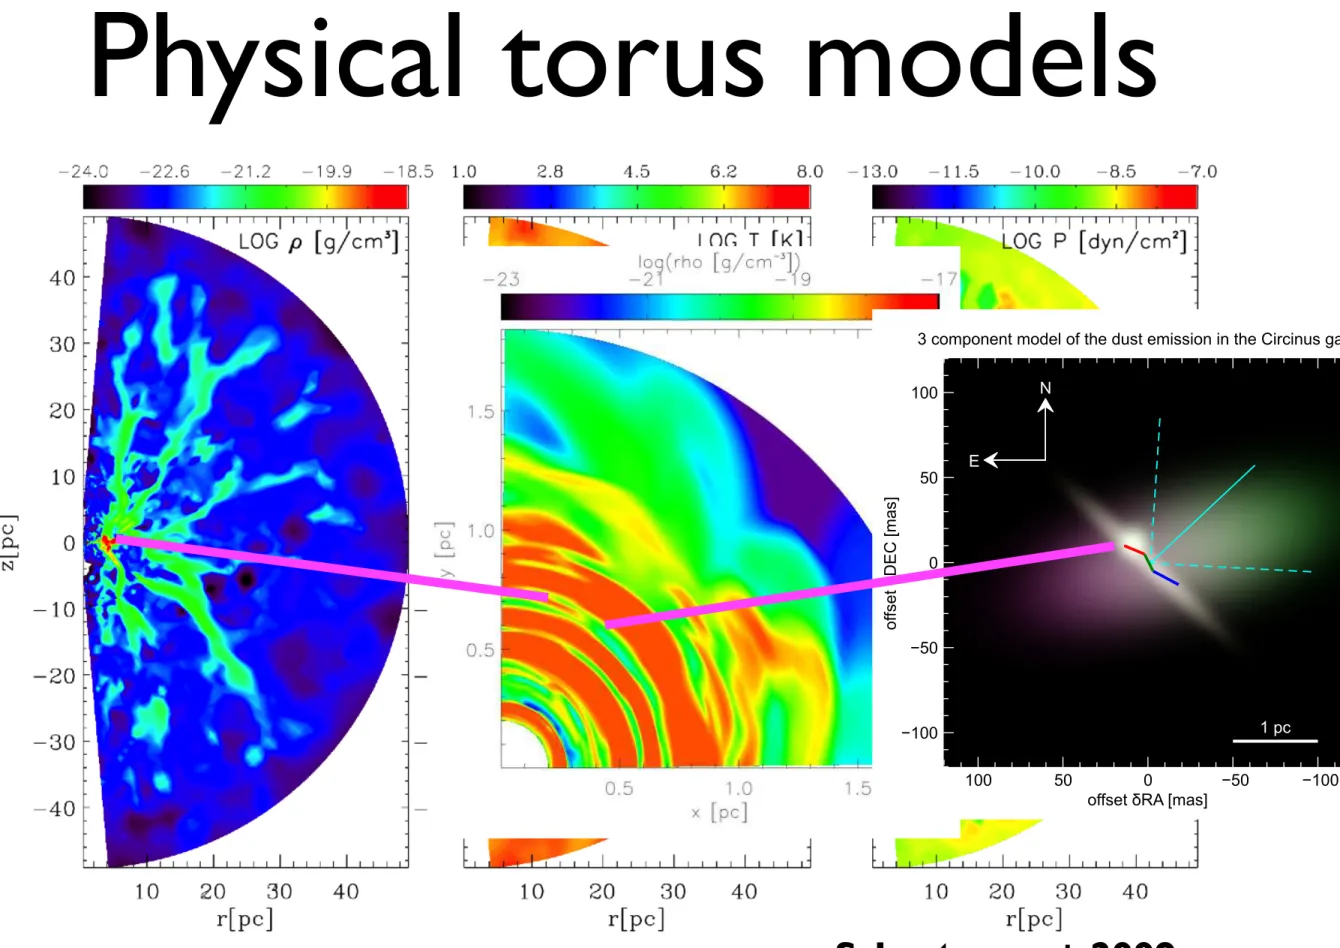
Physical torus models
Leonard Burtscher: Where is the torus?