HAL Id: hal-00318132
https://hal.archives-ouvertes.fr/hal-00318132
Submitted on 9 Aug 2006
HAL is a multi-disciplinary open access
archive for the deposit and dissemination of
sci-entific research documents, whether they are
pub-lished or not. The documents may come from
teaching and research institutions in France or
abroad, or from public or private research centers.
L’archive ouverte pluridisciplinaire HAL, est
destinée au dépôt et à la diffusion de documents
scientifiques de niveau recherche, publiés ou non,
émanant des établissements d’enseignement et de
recherche français ou étrangers, des laboratoires
publics ou privés.
Satellite observations of lightning-induced hard X-ray
flux enhancements in the conjugate region
R. Bu?ik, K. Kudela, S. N. Kuznetsov
To cite this version:
R. Bu?ik, K. Kudela, S. N. Kuznetsov. Satellite observations of lightning-induced hard X-ray flux
enhancements in the conjugate region. Annales Geophysicae, European Geosciences Union, 2006, 24
(7), pp.1969-1976. �hal-00318132�
www.ann-geophys.net/24/1969/2006/
© European Geosciences Union 2006
Geophysicae
Satellite observations of lightning-induced hard X-ray flux
enhancements in the conjugate region
R. Buˇc´ık1, K. Kudela1, and S. N. Kuznetsov2
1Institute of Experimental Physics, Slovak Academy of Sciences, Watsonova 47, 040 01 Koˇsice, Slovakia
2Institute of Nuclear Physics, Moscow State University, Vorob’evy Gory, 119899 Moscow, Russia
Received: 14 February 2006 – Revised: 10 May 2006 – Accepted: 24 May 2006 – Published: 9 August 2006
Abstract. Preliminary examination of October-December 2002 SONG (SOlar Neutron and Gamma rays) data aboard the Russian CORONAS-F (Complex Orbital Near-Earth Ob-servations of the Activity of the Sun) low-altitude satellite has revealed many X-ray enhanced emissions (30–500 keV) in the slot region (L∼2–3) between the Earth’s radiation belts. In one case, CORONAS-F data were analyzed when the intense hard X-ray emissions were seen westward of the South Atlantic Anomaly in a rather wide L shell range
from 1.7 to 2.6. Enhanced fluxes observed on day 316
(12 November) were most likely associated with a Major Se-vere Weather Outbreak in Eastern USA, producing extensive lightning flashes, as was documented by simultaneous opti-cal observations from space. We propose that whistler mode signals from these lightning discharges cause precipitation of energetic electrons from terrestrial trapped radiation belts, which, in turn, produce atmospheric X-rays in the Southern Hemisphere.
Keywords. Magnetospheric physics (Energetic particles, precipitating; Magnetosphere-ionosphere interactions)
1 Introduction
Hard X-rays from the bremsstrahlung emissions of ∼ MeV electrons precipitating into the atmosphere have been ob-served both over the auroral zones (Smith et al., 1995; Foat et al., 1998; Millan et al., 2002) during low geomagnetic ac-tivity and in the South Atlantic Anomaly (Martin et al., 1974) during a magnetic disturbance. Scattering by the substorm-excited electromagnetic ion cyclotron waves has been sug-gested as a mechanism for the auroral electron precipitation (e.g. Lorentzen et al., 2000).
Correspondence to: R. Buˇc´ık
Observations of hard X-rays associated with electron
pre-cipitation due to lightning flashes are rare. A
one-to-one correspondence between balloon X-ray (>30 keV) data and ground VLF emissions, triggered by whistlers from lightning, was for the first time, presented by Rosenberg et al. (1971) from an experiment conducted at Siple Station, Antarctica (L∼4.1). In a rocket experiment made at Wallops Island, Virginia (L∼2.6), Goldberg et al. (1987) observed (with X-ray detectors) electron bursts (>80 keV) that were coincident with lightning detected by nearby ground stations. Geographic intensity maps of hard X-rays (up to 750 keV)
from a low-Earth orbit over mid-latitudes within ±43.3◦and
their possible origin in lightning, due to electron precipita-tion and/or acceleraprecipita-tion, has been discussed by Feldman et al. (1996).
There is extensive experimental evidence on the associa-tion of individual lightning events with the precipitaassocia-tion of energetic electrons (e.g. Voss et al., 1998, and references therein). The electromagnetic energy originating in light-ning discharges escapes into the magnetosphere and prop-agates as a whistler mode wave, and pitch angle scatters (and thus precipitates) energetic electrons, thereby generat-ing bremsstrahlung hard X-rays.
In the present paper we report on new satellite obser-vations of hard X-rays from the CORONAS-F experiment, which, by association with simultaneous optical observations made on TRMM, may be related to lightning in the geomag-netically conjugate region.
2 Instrumentation
The CORONAS-F satellite was launched on 31 July 2001
into a Sun-synchronous polar orbit (inclination ∼83◦) with
a period of ∼95 min at 500 km nominal altitude. The
SONG experiment on CORONAS-F contained a large area CsI(Tl) scintillator (20 cm diameter × 10 cm length) for the
1970 R. Buˇc´ık et al.: Lightning induced hard X-rays 0 2 4 6 8 10 0 2 4 6 8 10 1 10 100 1 10 100 Counts / s.keV -180 -150 -120 -90 -60 -30 0 30 60 90 120 150 180 -90 -60 -30 0 30 60 90 1.4 1.4 1.4 1.4 1.6 1.6 1.6 1.6 1.8 1.8 1.8 1.8 2.0 2.0 2.0 2.0 2.2 2.2 2.2 2.2 2.4 2.4 2.4 2.4 2.6 2.6 2.6 2.6 3.0 3.0 3.0 3.0
Fig. 1. The colored geographical map of average counts for 60–150 keV X-rays measured by CORONAS-F throughout October–December,
2002 in the altitude range of 440–490 km. Note in the South Atlantic Anomaly the SONG instrument was saturated by high fluxes of energetic (>50 MeV) protons (purple and blue). The footprints of several L shells between 1.4 and 3.0 and the region of stable trapping (crosshatched) at 500 km are shown for reference. The location of the stable trapping area at an altitude of 500 km is adopted from Buˇc´ık et al. (2005). It consists of set of L, B values (determined by IGRF 1990), for which the minimum longitude traced altitude is above 100 km. Small white strips in the Eastern Europe mean no data available for these regions, due to operative controls when the satellite passed over Moscow. Note that the adjacent region is characterized by a reduction in the amount of data. There are less than 10 records per bin in the
area clustered at longitudes 20◦–30◦and latitudes 40◦–60◦.
measurement of energetic neutral radiation from the Sun
(Kuznetsov et al., 2002, 2004). The crystal scintillator
was viewed by three photomultipliers and was entirely surrounded by a 2-cm thick plastic anticoincidence shield against charged particles. It was viewed by three other pho-tomultiplier tubes.
During calibration the efficiency of the active anticoinci-dence shield was tested by using atmospheric muons as test particles. The measured rejection efficiency was about 95% at muons peak (∼55 MeV) (Ryumin et al., 1996). For low energies, the efficiency of the active veto is higher, since at these energies charged particles produce a smaller amount of light in the CsI(Tl) and the anticoincidence plastic scin-tillator makes a passive barrier for electrons with energies
<4 MeV and protons with energies <48 MeV.
The scintillation crystal had no collimator and its axis was parallel to the longitudinal axis of the satellite which was di-rected towards the Sun. Due to attenuation in the instrumen-tal and spacecraft matter around the main detector, the nom-inal omnidirectional response for incoming X-rays would be
reduced. According to the approach given in Buˇc´ık et al. (2002), an estimate of the detector field of view is 1.7π sr for 100 keV and 2.3π sr for 1000 keV X-ray energies. The calculation is based on a model of the distribution of mat-ter near the CsI crystal in a similar experimental setup as for the preceding CORONAS-I experiment (Buˇc´ık and Kudela, 2003).
Energy losses in the scintillation crystal were pulse-height-discriminated into twelve differential channels from 30 keV to 200 MeV, and one integral channel above 200 MeV. The SONG instrument provided high time res-olution measurements of 1 s in the burst mode and 4 s in monitoring mode. For the present analysis we selected the four lowest energy channels (30–60, 60–150, 150–500, and 500–1500 keV). The instrument’s maximum effective area
(at vertical incidence) for gamma-ray photons is 270 cm2; the
effective photopeak area at 100 keV is 200 cm2, and 140 cm2
at 1 MeV. More details of SONG aboard CORONAS-I are given in Bal´aˇz et al. (1994).
0 2 4 6 8 10
0
2
4
6
8
10
Nov-09-2002 45 30 15 0 -15 -30 -45 -60 -105 -90 -75 -601000
10000
1000
10000
Counts, s
12:39 12:45 12:52 12:59 14:19 14:26 14:32 NAA PA 1.4 1.4 1.4 1.4 1.6 1.6 1.6 1.6 1.8 1.8 1.8 1.8 2.0 2.0 2.0 2.0 2.2 2.2 2.2 2.2 2.4 2.4 2.4 2.4 2.6 2.6 2.6 2.6 3.0 3.0 3.0 3.0
0 2 4 6 8 10
0
2
4
6
8
10
Nov-10/11-2002 45 30 15 0 -15 -30 -45 -60 -105 -90 -75 -601000
10000
1000
10000
Counts, s
10/23:42 11/ 1:16 11/ 1:22 11/ 1:29 11/ 1:36 NAA PA 1.4 1.4 1.4 1.4 1.6 1.6 1.6 1.6 1.8 1.8 1.8 1.8 2.0 2.0 2.0 2.0 2.2 2.2 2.2 2.2 2.4 2.4 2.4 2.4 2.6 2.6 2.6 2.6 3.0 3.0 3.0 3.0
0 2 4 6 8 10
0
2
4
6
8
10
Nov-12-2002 45 30 15 0 -15 -30 -45 -60 -105 -90 -75 -601000
10000
1000
10000
Counts, s
12:29 12:33 12:40 12:47 12:53 14:21 14:28 NAA PA 1.4 1.4 1.4 1.4 1.6 1.6 1.6 1.6 1.8 1.8 1.8 1.8 2.0 2.0 2.0 2.0 2.2 2.2 2.2 2.2 2.4 2.4 2.4 2.4 2.6 2.6 2.6 2.6 3.0 3.0 3.0 3.0
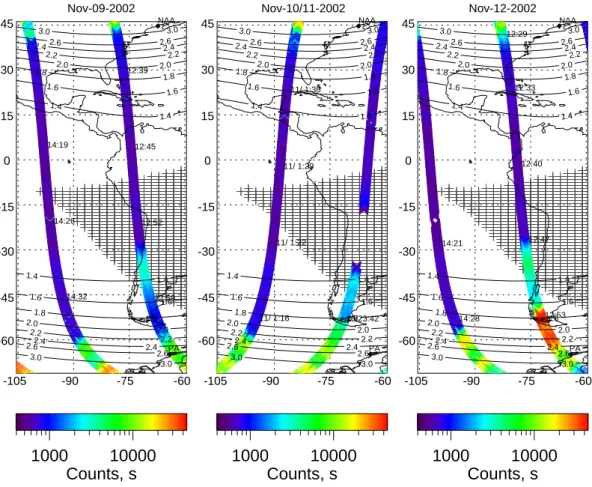
Fig. 2. Geographic locations of X-ray counts (60–150 keV) during two consecutive CORONAS-F orbits
dis-played in each panel, the times of which are shown in hours and minutes, UT. Footprints of several L shells and stable trapped region (crosshatched) at 500 km are shown for reference along with the location of the Palmer station (PA) and NAA VLF transmitter. Here we have data with the time resolution of 4 s.
14
Fig. 2. Geographic locations of X-ray counts (60–150 keV) during two consecutive CORONAS-F orbits displayed in each panel the times,
shown in hours and minutes, UT. Footprints of several L shells and stable trapped region (crosshatched) at 500 km are shown for reference, along with the location of the Palmer station (PA) and NAA VLF transmitter. Here we have data with the time resolution of 4 s.
The SONG device was mounted on the platform at a dis-tance of one meter from the satellite. Note that a fraction (as yet undetermined) of the detected hard X-rays was gener-ated by interactions between primary cosmic rays and radia-tion belt particles with the CORONAS-F spacecraft and the SONG device itself.
3 Observations
An overview of hard X-rays in the 60–150 keV energy chan-nel, measured by CORONAS-F during October–December, 2002, is given in the map presented in Fig. 1. The data have been divided into 180 × 180 longitude-latitude bins with a
width of 2◦in longitude and 1◦in latitude. The average
num-ber of measurements in one individual bin is 83±26 and the
total amount of the data is 2.5×10⁶. Inspection of the map
shows enhanced emissions in the slot region, L∼2–3, where, according to the predictions of Abel and Thorne (1998), scat-tering by lightning-generated whistlers dominates. One can see that in the closest vicinity of the South Atlantic Anomaly,
between the longitudes of −100◦ and −50◦, the
enhance-ments extend below L∼2.
One of the most intense enhancements, also seen in the inner zone, was found on 12 November 2002 (day 316) at around 12:55 UT (∼08:00 LT) on the west side of the South
Atlantic Anomaly in longitudes from −75◦to −65◦. It is
dis-played in Fig. 2 (rightmost panel), where intense X-ray emis-sions (about 50 times the background value) in the energy channel of 60–150 keV cover a rather wide L-shell range from 1.7 to 2.6. As shown in Fig. 3, the observed enhance-ment is characterized by a double-peak profile between 30 and 500 keV. The right panel of Fig. 2 shows that emissions at L∼2–2.6 gradually increase towards the South Atlantic Anomaly, and are similar to those in the atmospheric drift loss cone where the fluxes build up as electrons drift east-ward due to injections over a range of longitudes (see, for ex-ample, Blake et al., 2001). In contrast, enhancements below
L∼2 are probably localized in longitude; there we have no
enhanced flux westward of longitude −90◦, although these
were observed 1.5 h later, at 14:20 UT, on day 316 (see also Fig. 4, for other energy channels).
1972 R. Buˇc´ık et al.: Lightning induced hard X-rays 10-1 100 101 102 103 30- 60 keV 60- 150 keV 150-500 keV 500-1500 keV C o u n ts ( s .k e V ) -1 L shell 12.87 12.88 12.89 12.90 12.91 12.92 12.93 12.94 12.95 12.96 1.6 1.8 2.0 2.2 2.4 2.6 2.8 3.0 Time, UT
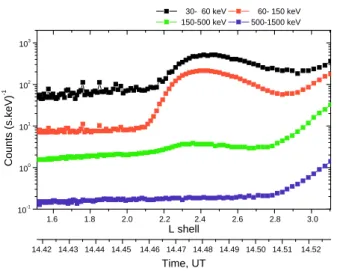
Fig. 3. X-ray counting rates versus L shell/time in four energy channels measured by SONG during one passage
(orbit on right, at longitudes between −75◦and −65◦, rightmost panel of Fig. 2) of the CORONAS-F satellite
on day 316 (November 12), the time being shown in hours, to two places of decimals.
15
Fig. 3. X-ray counting rates versus L shell/time in four energy
chan-nels measured by SONG during one passage (orbit on right, at
lon-gitudes between −75◦and −65◦, rightmost panel of Fig. 2) of the
CORONAS-F satellite on day 316 (12 November), the time being shown in hours, to two decimal places.
10-1 100 101 102 103 30- 60 keV 60- 150 keV 150-500 keV 500-1500 keV C o u n ts ( s .k e V ) -1 L shell 14.42 14.43 14.44 14.45 14.46 14.47 14.48 14.49 14.50 14.51 14.52 1.6 1.8 2.0 2.2 2.4 2.6 2.8 3.0 Time, UT
Fig. 4. Same as Fig. 3 for another passage (orbit on left, at longitudes between −100◦and −85◦, right-hand panel of Fig. 2) on day 316 (November 12).
16
Fig. 4. Same as Fig. 3 for another passage (orbit on left, at
lon-gitudes between −100◦and −85◦, right-hand panel of Fig. 2) on
day 316 (12 November).
The L-shell profile of X-ray counts in Fig. 3 shows a relatively narrow peak in the inner zone (during the ∼90-s satellite passage) centered on L ∼1.8, and a broad
max-imum in the inner part of the slot region. Similar
ob-servations with a double-peak feature in connection with lightning-induced electron precipitation have been reported by Blake et al. (2001). They proposed that the narrow, low
Lpeak is attributed to resonant scattering at the first
equa-torial crossing at low L shells, due to focusing of lightning-generated whistler waves by particular ionospheric electron density gradients; the high L-shell broad structure is caused
by whistlers undergoing multiple magnetospheric reflections (also see Bortnik et al., 2002).
During October–December 2002 there were few other similar intense emissions for L<2 in the vicinity of South At-lantic Anomaly. However, for this particular event, we have found good conjunctions with the Tropical Rainfall Measur-ing Mission (TRMM) satellite for performMeasur-ing a comparison with optical observations. The TRMM documents lightning activity by a Lightning Imaging Sensor (LIS), which locates lightning within its 600×600 km field of view, with a 2-ms timing resolution at an altitude of 350 km (Christian et al., 1999). TRMM data show that an extensive thunderstorm system on 12 November 2002 (Fig. 5, rightmost panel),
lo-cated in the longitude range of −90◦to −70◦in the
North-ern Hemisphere, within the L-shell range of 1.8–2.4, was ac-tive at least within the 11:00–12:45 UT interval. We note that lightning discharges were seen there during successive crossings of this area, up to the middle of the next day. The presence of the conjugate positions of the lightning flashes westward of the X-ray peak location suggests precipitation into the drift loss cone, although localized in longitude. An illustration of the atmospheric 100-km loss cones for L=1.8 drift shell (similar to Fig. 1 of Sheldon et al. (1987) for L=4) is shown in Fig. 6. Electrons precipitated from the drift loss
cone to the atmosphere, at a longitude of ∼−70◦, must be
scattered from stable trapping by discharges located some-where west of this longitude. In the northern lightning re-gion, the satellite was in the bounce loss cone, and no en-hancements of the X-ray count rate were noted below L∼3.
Figure 2 (leftmost panel) demonstrates that there is no (significant) enhancement at the same L shell and longitude range, three days before (on 9 November 2002, day 313,
∼13:00 UT), in the energy range of 60–150 keV, or for the
other energy channels (Fig. 7). On day 313, the TRMM satel-lite passed through the region of interest in the north around 12:15 UT without indicating any lightning activity (Fig. 5, left panel).
The SONG instrument also observed enhanced X-ray counts on 10 November 2002, at around 23:45 UT, as shown in the middle panel of Fig. 2. The closest time when TRMM passed through the area of interest was on 10 November (blue curve in middle panel of Fig. 5) at 16:10 UT, more than 7 h earlier, without observing any significant lightning ac-tivity. However, on 11 November 2002 a large thunderstorm area (red crosses) had already built up between 11:55 and
12:03 UT, covering the longitudes between −92◦and −73◦,
as was shown by the LIS instrument.
4 Internal detector background
In the regions of the high fluxes of charged particles which can lose their energy in the gamma-ray detector, the mea-surement of X/gamma-ray fluxes, several orders lower than the charged particle fluxes, becomes quite difficult. In this
0 2 4 6 8 10
0
2
4
6
8
10
Nov-09-2002 45 30 12:07 12:18 15 0 -15 -30 -45 -60 -105 -90 -75 -60 NAA PA 1.4 1.4 1.4 1.4 1.6 1.6 1.6 1.6 1.8 1.8 1.8 1.8 2.0 2.0 2.0 2.0 2.2 2.2 2.2 2.2 2.4 2.4 2.4 2.4 2.6 2.6 2.6 2.6 3.0 3.0 3.0 3.00 2 4 6 8 10
0
2
4
6
8
10
Nov-10/11-2002 45 30 11:54 12:04 16:05 16:17 15 0 -15 -30 -45 -60 -105 -90 -75 -60 NAA PA 1.4 1.4 1.4 1.4 1.6 1.6 1.6 1.6 1.8 1.8 1.8 1.8 2.0 2.0 2.0 2.0 2.2 2.2 2.2 2.2 2.4 2.4 2.4 2.4 2.6 2.6 2.6 2.6 3.0 3.0 3.0 3.00 2 4 6 8 10
0
2
4
6
8
10
Nov-12-2002 45 30 10:58 11:09 12:36 12:46 15 0 -15 -30 -45 -60 -105 -90 -75 -60 NAA PA 1.4 1.4 1.4 1.4 1.6 1.6 1.6 1.6 1.8 1.8 1.8 1.8 2.0 2.0 2.0 2.0 2.2 2.2 2.2 2.2 2.4 2.4 2.4 2.4 2.6 2.6 2.6 2.6 3.0 3.0 3.0 3.0Fig. 5. Lightning discharges detected by the LIS aboard TRMM are shown as a red/blue crosses, together with
respective TRMM trajectories indicated by solid red/blue curves. The crosses in the South indicate magnetically conjugate points (using IGRF 2000 geomagnetic field model) of the northern lightning flashes. Note that, for
L ∼ 1.8, the 150 keV electrons need ∼ 20 minutes to drift from a longitude of conjugate flashes at −100◦
to
their loss from radiation belts at −70◦.
17
Fig. 5. Lightning discharges detected by the LIS aboard TRMM are shown as a red/blue crosses, together with respective TRMM trajectories
indicated by solid red/blue curves. The crosses in the south indicate magnetically conjugate points (using IGRF 2000 geomagnetic field model) of the northern lightning flashes. Note that, for L∼1.8, the 150 keV electrons need ∼20 min to drift from a longitude of conjugate
flashes at −100◦to their loss from radiation belts at −70◦.
section we briefly discuss whether SONG observations in the X-ray energy channels between 30 and 500 keV are due to photons and/or false signals caused by unvetoed charged particles.
For production of the bremsstrahlung X-ray photons with energies between 30 keV and 500 keV, electrons with ener-gies between 60 keV and 1000 keV are needed (Schlickeiser, 1981). The maximal flux of the 60–1000 keV model AE-8 electrons, mirroring at an altitude of 500 km in the inner
belt, is about ∼ 106cm−2s−1(Vette, 1991). The flux of 30–
500 keV hard X-rays produced in the atmosphere by these
electrons is about 103times lower, as provided by EGS4
sim-ulations (Blake et al., 2002). Therefore, an efficient veto sys-tem for rejection of the high fluxes of charged particles is required.
The 2-cm thick plastic scintillator used in the SONG instrument would be opaque for the penetration of these
electrons into the CsI crystal. For example, an
aver-age path length (which is less than penetration depth) for 500 keV electrons in the plastic scintillator presents about 10% (Berger and Seltzer, 1982) of the SONG veto thickness. However, an electron having energy above 4 MeV, capable of penetrating the SONG plastic shield, could lose a frac-tion of its energy in the CsI and cause a false signal in the range of 30–500 keV. This contribution to the internal
back-ground can be considered negligible. According to AE-8,
the maximal integral flux of >4 MeV electrons at 90◦pitch
angles at an altitude of 500 km in the inner belt is less than
1 cm−2s−1. This value presents only a small fraction of the
bremsstrahlung photon flux produced by <1 MeV inner belt electrons.
Since, for lower electron energies, bremsstrahlung gener-ation of hard X-rays is a rather inefficient mechanism
(con-sidering the factor 10−3), the efficiency of the active veto
should be greater than 99.99%, in order to have an internal background which is quite insignificant (less than 10%). Not knowing the exact value of the SONG veto efficiency in the low energy domain, we must admit that, observed outside the stable trapping region, enhanced counting rates between 30– 500 keV may contain contributions from both electrons and hard X-rays. Further work is needed to specify the contri-bution of electrons to the internal background for the SONG detector.
5 Discussion
The lightning flashes on 11–12 November 2002, shown in Fig. 5, were most likely associated with the Major Severe Weather Outbreak in the Eastern USA, one of the largest severe weather events of the past 25 years. This occurred
1974 R. Buˇc´ık et al.: Lightning induced hard X-rays -180 -150 -120 -90 -60 -30 0 30 60 90 120 150 180 0.20 0.25 0.30 0.35 0.40 0.45 0.50 0.55 Stable Trapping Drift Loss Cone Bounce Loss Cone
B ( x 1 0 -4 ), T Longitude, deg.
Fig. 6. Illustration of the 100-km atmospheric loss cones for L = 1.8. Electrons scattered into the drift loss
cone are lost into the atmosphere in the southern hemisphere at longitudes between −135◦and −20◦(solid
red curve), and in northern hemisphere between 120◦and ∼ 180◦(dotted red curve). Approximate satellite
locations at 500 km in the south (north) are indicated solid (dotted) black curve. The schematic drawing shows that drift loss cone precipitation in the northern hemisphere requires a major change in magnetic field strength
(i.e. in pitch angle) to transport electrons from stably trapped orbits. Vertical arrow at longitude of −100◦, the
location of the conjugate flashes for the event on November 12, schematically represents scattering from the stable trapping to the drift loss cone. The direction of the electron drift is marked by horizontal arrow, and a
vertical line at −70◦indicates longitude of the observed hard X-ray enhancements.
18
Fig. 6. Illustration of the 100-km atmospheric loss cones for
L =1.8. Electrons scattered into the drift loss cone are lost into
the atmosphere in the Southern Hemisphere at longitudes between
−135◦ and −20◦ (solid red curve), and in Northern Hemisphere
between 120◦and ∼180◦(dotted red curve). Approximate satellite
locations at 500 km in the south (north) are indicated solid (dot-ted) black curve. The schematic drawing shows that drift loss cone precipitation in the Northern Hemisphere requires a major change in magnetic field strength (i.e. in pitch angle) to transport electrons
from stably trapped orbits. Vertical arrow at the longitude of −100◦,
the location of the conjugate flashes for the event on 12 November schematically represents scattering from the stable trapping to the drift loss cone. The direction of the electron drift is marked by a
horizontal arrow, and a vertical line at −70◦indicates the longitude
of the observed hard X-ray enhancements.
10-1 100 101 102 103 30- 60 keV 60- 150 keV 150-500 keV 500-1500 keV C o u n ts ( s .k e V ) -1 L shell 12.97 12.98 12.99 13.00 13.01 13.02 13.03 13.04 13.05 13.06 13.07 1.6 1.8 2.0 2.2 2.4 2.6 2.8 3.0 Time, UT
Fig. 7. Same as Fig. 3 for one passage on day 313 (November 9).
19
Fig. 7. Same as Fig. 3 for one passage on day 313 (9 November).
across much of the eastern United States on 10–11 November 2002, and was accompanied by many tornadoes and thun-derstorms, as well as damage, and resulted in 36 deaths in 13 states (http://lwf.ncdc.noaa.gov). Infrared GOES im-ages (http://cdo.ncdc.noaa.gov) on 12 November 2002 at
00:15 UT document the cloud covers over the location of the lightning strokes (not shown).
Before the start of the reported severe weather event, the X-ray flux enhancement was observed only in the outer part of the slot region (L∼2.5–3). After the appearance of thun-derstorm clouds and associated lightning, demonstrated by GOES and TRMM, new X-ray emissions arose close to the magnetic conjugates of lightning under the inner belt region and in the inner part of the slot zone. These X-ray enhanced emissions were detected in three energy channels over 30 and 500 keV. We suppose that whistler waves launched by localized lightning in the north propagate to the southern conjugate region and are in cyclotron resonance with ener-getic trapped electrons which are moving northward. Due to the north-south asymmetry in mirror heights, this inter-action lowers the mirror points into the Earth’s atmosphere in the Southern Hemisphere (directly or, more likely, via azimuthal drift), where X-rays are produced through the bremsstrahlung process, which can emerge from the atmo-sphere to a low altitude orbit. Since L-dependent counting rates of the energetic electrons precipitating from the radia-tion belts have been attributed to the wave-particle interac-tions, the observed multiple-peak (double) structure over the
Lshells may support our assumption.
From satellite observations, Datlowe and Imhof (1990) re-ported that most intense peaks of electron precipitation clus-ter at longitudes of major VLF transmitclus-ters. In the observed longitude range there is one high-power (>110 kW) commu-nications transmitter currently in operation, namely, NAA
(Maine, USA), located at a longitude of −67◦ and
radiat-ing at 24.0 kHz with a power ∼1000 kW. This transmitter signal could contribute, by resonance interactions with inner belt electrons, to the detected X-ray emissions. The calcula-tions of Abel and Thorne (1998) indicate that 22.3-kHz VLF transmitter signals can resonate with 100–1500 keV electrons below L=2.2. We note that VLF data from Palmer Station, Antarctica (L∼2.6) documented activity of the NAA
trans-mitter (http://www-star.stanford.edu/∼palmer/) during times
of the observed X-ray enhancements. A preliminary review of the data in October–December 2002, shows that in the ma-jority of the passes through the longitudes around the NAA transmitter, no enhancements were seen under the inner ra-diation belt. It suggests that the contribution of NAA to the observations presented in this paper may be less impor-tant. Moreover, Cummer et at. (1997) supposed that, due to monochromatic VLF transmitter signals, the enhancements would be in a very narrow energy range. This is not the case in our observations, we detect enhanced counts over two or-ders of magnitude (tens to hundreds keV).
Enhanced X-ray count rates, observed in the inner edge of the slot region may also suggest an injection of a new particle population. However, the mechanisms of the injection should be different from those operated during magnetic storms and substorms. No significant geomagnetic activity, as indicated by the Dst index, was observed during and several days
fore the event. The runaway avalanche acceleration (Gure-vich et al., 1992), producing energetic electron beams in in-tense electric fields above the thunderstorms and their sub-sequent trapping by the geomagnetic field, can lead to the precipitation in the hemisphere conjugate to lightning (Lehti-nen et al., 2001). Feldman et al. (1996) speculated that hard X-ray enhancements observed near the geomagnetic equator, where there is not a significant population of permanently trapped electrons, could be due to newly-injected electrons into the drift loss cone of the inner radiation belt by upward lightning.
The detected increases on 12 November 2002 at
∼13:00 UT, when CORONAS-F was near local dawn
(∼08:00 LT), are probably not associated with solar X-ray flares. GOES data do not report any class type of X-ray flare (Coffey, 2002) around the time of detection of the X-ray counts peaks.
6 Summary
In this paper, we studied one intense enhancement of count-ing rates in energy channels measurcount-ing X-rays from 30 to 500 keV for which observations of lightning flashes from space were available. We have found that:
• The spatial coincidence of the location of the lightning
flashes with conjugate X-ray enhancements, and their simultaneity, suggests that CORONAS-F observed X-ray counts are most likely connected to the underlying long-lived lightning documented by TRMM optical ob-servations.
• Both the location of conjugate lightning flashes at
longi-tudes west of the enhancements and the counts increas-ing toward the east are consistent with the expectations of the precipitation of electrons, which gradient drift eastward in longitude.
• The observed L-shell profile suggests that the
enhance-ments may result from wave scattered energetic elec-trons, precipitated into the Earth’s atmosphere, which, in turn, may generate bremsstrahlung X-rays.
Although we have observed an event which is definitely associated with lightning, further work is required to estab-lish its statistical significance. We are currently investigat-ing SONG/CORONAS-F data from the entire mission (Au-gust 2001–November 2005) and are looking for conjunc-tions with TRMM satellite during this period. Further work also requires us to discuss simultaneous measurements of the wave environment.
Acknowledgements. This work was supported by the Slovak Re-search and Development Agency under the contract No. APVV-51-053805. R. Buˇc´ık wishes to acknowledge VEGA grant 2/4064. We thank B. Yu. Yushkov and V. G. Kurt at INP MSU for the pro-cessing the SONG instrument data. The locations of the lightning flashes were obtained from the NASA Web site http://thunder.nsstc. nasa.gov/.
References
Abel B. and Thorne, R. M.: Electron scattering loss in Earth’s inner magnetosphere 1. Dominant physical processes, J. Geophys. Res, 103, 2385–2396, 1998.
Bal´aˇz, J., Dmitriev, A. V., Kovalevskaya, M. A., Kudela, K., Kuznetsov, S. N., Myagkova, I. N., Nagornikh, Yu. I., Rojko, J., and Ryumin, S. P.: Solar flare energetic neutral emission mea-surements in the project CORONAS-I, IAU Colloq. 144, Solar Coronal Structures, edited by V. Ruˇsin, P. Heinzel, and J.-C. Vial, VEDA, Bratislava, 635–639, 1994.
Berger, M. J. and Seltzer, S. M.: Stopping powers and ranges of electrons and positrons, National Bureau of Standards (2nd Ed.), Report NBSIR 82-2550-A, 1982.
Blake, J. B., Inan, U. S., Walt, M., Bell, T. F., Bortnik, J., Chenette, D. L., and Christian, H. J.: Lightning-induced energetic electron flux enhancements in the drift loss cone, J. Geophys. Res., 106, 29 733–29 744, 2001.
Blake, J. B., Looper, M. D., Lorentzen, K. R., Kudela, K., and Buˇc´ık, R.: Correlation of spacecraft observations of energetic gamma ray fluxes with those of relativistic electrons in the drift loss cone, Geophys. Res. Abs., 4, 2002.
Bortnik, J., Inan, U. S., and Bell, T. F.: L dependence
of energetic electron precipitation driven by magnetospheri-cally reflecting whistler waves, J. Geophys. Res., 107, 1150, doi:10.1029/2001JA000303, 2002.
Buˇc´ık, R., Kudela, K., Dmitriev, A. V., Kuznetsov, S. N., Myagkova, I. N., and Ryumin, S. P.: Spatial distribution of low energy gamma-rays associated with trapped particles, Adv. Space Res., 30, 2843–2848, 2002.
Buˇc´ık, R. and Kudela, K.: On mass in 4π solid angle around SONG CsI scintillator aboard CORONAS-I satellite, Acta Phys. Slov., 53, 329–345, 2003.
Buˇc´ık, R., Kudela, K., Kuznetsov, S. N., and Myagkova, I. N.: Gamma rays in L − B coordinates at CORONAS-I altitude, Ann. Geophys., 23, 2239–2247, 2005.
Christian H. J., Blakeslee, R. J., Goodman, S. J., et al.: The Light-ning Imaging Sensor, in: Proceedings of the 11th International Conference on Atmospheric Electricity, Guntersville, Alabama, June 7-11, 746–749, 1999.
Coffey, H. E. (Ed.): Solar-Geophysical Data, 200211, Part II, (http: //sgd.ngdc.noaa.gov/sgd/jsp/solarindex.jsp), 2002.
Cummer, S. A., Bell, T. F., Inan, U. S., and Chenette, D. L.: VLF remote sensing of high-energy auroral particle precipitation, J. Geophys. Res., 102, 7477–7484, 1997.
Datlowe, D. W., and Imhof, W. L.: Cyclotron resonance precip-itation of energetic electrons from the inner magnetosphere, J. Geophys. Res., 95, 6477–6491, 1990.
Feldman, W. C., Symbalisty, E. M. D., and Roussel-Dupr´e, R. A.: Hard X ray survey of energetic electrons from low-Earth orbit, J. Geophys. Res., 92, 2505–2513, 1996.
1976 R. Buˇc´ık et al.: Lightning induced hard X-rays
Foat, J. E., Lin, R. P, Smith, D. M., et al.: First detection of a ter-restrial MeV X-ray burst, Geophys. Res. Lett., 25, 4109–4112, 1998.
Goldberg, R. A., Curtis, S. A., and Barcus, J. R.: Detailed spec-tral structure of magnetospheric electron bursts precipitated by lightning, J. Geophys. Res., 92, 2505–2513, 1987.
Gurevich, A. V., Milikh, G. M., and Roussel-Dupr´e, R. A.: Run-away electron mechanism of air breakdown and preconditioning during a thunderstorm, Phys. Lett. A, 165, 463–468, 1992. Kuznetsov, S. N., Kudela, K., Ryumin, S. P., and Gotselyuk, Y. V.:
CORONAS-F satellite: tasks for study of particle acceleration, Adv. Space Res., 30, 1857–1863, 2002.
Kuznetsov, S. N., Kudela, K., Myagkova, I. N., Podorolsky, A. N., Ryumin, S. P., and Yushkov, B. Yu.: First experience with SONG-M measurements on board CORONAS-F satellite, Indian J. Radio Space Phys., 33, 353–357, 2004.
Lehtinen, N. G., Inan, U. S., and Bell, T. F.: Effects of
thunderstorm-driven runaway electrons in the conjugate hemi-sphere: Purple sprites, ionization enhancements, and gamma rays, J. Geophys. Res., 106, 28 841–28 856, 2001.
Lorentzen, K. R., McCarthy, M. P., Parks, G. K., et al.: Precipitation of relativistic electrons by interaction with electromagnetic ion cyclotron waves, J. Geophys. Res., 105, 5381–5389, 2000. Martin, I. M., Rai, D. B., Palmeira, R. A. R., Trivedi, N. B., Abdu,
M. A., and da Costa, J. M.: Enhanced low-energy gamma rays at balloon altitude in the Brazilian magnetic anomaly, Nature, 252, 25–27, 1974.
Millan, R. M., Lin, R. P., Smith, D. M., Lorentzen, K. R., and McCarthy, M. P.: X-ray observations of MeV electron precipi-tation with a balloon-borne germanium spectrometer, Geophys. Res. Lett., 29, 2194, doi:10.1029/2002GL015922, 2002. Rosenberg, T. J., Helliwell, R. A., and Katsufrakis, J. P.:
Elec-tron precipitation with discrete very-low-frequency emissions, J. Geophys. Res., 76, 8448–8451, 1971.
Ryumin, S. P., Bogomolov, A. V., Dmitriev A. V., and Myagkova, I. N.: Background conditions for recording γ radiation and en-ergetic neutrons on CORONAS satellites from SONG data, J. Moscow Phys. Soc., 6, 423–430, 1996.
Schlickeiser, R.: Gamma ray astronomy and the origin of cosmic rays, Fortschritte der Physik, 29, 95–134, 1981.
Sheldon, W. R., Benbrook, J. R., Bering, E. A., Leverenz, H., Roeder, J. L.: Electron precipitation near L=4 – Longitudinal variation, Adv. Space Res., 7, 49–52, 1987.
Smith, D. M., Lin, R. P., Anderson, K. A., Hurley, K., and Johns, C. M.: High-resolution spectra of 20–300 keV hard X-rays from electron precipitation over Antarctica, J. Geophys. Res., 100, 19 675–19 685, 1995.
Vette, J. I.: The AE-8 trapped electron model environment, NSSDC 91-24, NASA Goddard Space Flight Center, Greenbelt, Md., 1991.
Voss, H. D., Walt, M., Imhof, W. L., Mobilia, J., and Inan, U. S.: Satellite observations of lightning-induced electron precipitation, J. Geophys. Res., 103, 11 725–11 744, 1998.