O
pen
A
rchive
T
OULOUSE
A
rchive
O
uverte (
OATAO
)
OATAO is an open access repository that collects the work of Toulouse researchers and
makes it freely available over the web where possible.
This is an author-deposited version published in:
http://oatao.univ-toulouse.fr/
Eprints ID: 18092
To link to this article: DOI:
10.1021/acs.jpclett.6b01823
URL:
http://dx.doi.org/10.1021/acs.jpclett.6b01823
To cite this version:
Yin, Yinghui and Gaya, Caroline and Torayev,
Amangeldi and Thangavel, Vigneshwaran and Franco, Alejandro A.
Impact of Li2O2 particle size on Li−O2 battery gharge process:
insights from a multiscale modeling perspective. (2016) Journal of
Physical Chemistry Letters, vol. 7 (n° 19). pp. 3897-3902
Any correspondence concerning this service should be sent to the repository
administrator:
[email protected]
Impact of Li
2
O
2
Particle Size on Li−O
2
Battery Charge Process:
Insights from a Multiscale Modeling Perspective
Yinghui Yin,
†,‡Caroline Gaya,
†,§Amangeldi Torayev,
†,∥Vigneshwaran Thangavel,
†,‡and Alejandro A. Franco
*
,†,‡,∥†
Laboratoire de Réactivité et Chimie des Solides (LRCS), CNRS UMR 7314, Université de Picardie Jules Verne, 33 rue St. Leu, 80039 Amiens, France
‡
Réseau sur le Stockage Electrochimique de l’Energie (RS2E), Fédération de Recherche CNRS 3459, 33 rue St. Leu, 80039 Amiens, France
§
IRT Saint-Exupery, 118 route de Narbonne, 31432 Toulouse, France
∥
ALISTORE-European Research Institute, Fédération de Recherche CNRS 3104, 33 rue St. Leu, 80039 Amiens, France
ABSTRACT: We report a comprehensive multiscale model describing charge processes of Li−O2 batteries. On the basis of a continuum approach, the present model combines
mathematical descriptions of mass transport of soluble species (O2, Li+, LiO2) and
elementary reaction kinetics, which are assumed to be dependent on the morphology of the Li2O2 formed during discharge. The simulated charge curves are in agreement with
previously reported experimental studies. The model along with the assumed reaction mechanisms provides physical explanations for the two-step charge profiles. Furthermore, it suggests that these charge profiles depend on the size of the Li2O2 particles, which are
determined by the applied current density during discharge. Therefore, the model underlines the strong link between discharge and charge processes.
Li−O2batteries have attracted significant attention due to their
high theoretical capacity up to ∼3000 Wh/kg,1but they are still facing a large number of challenges which avoid their penetration in real applications. Their high charging voltage, which usually reaches 3.8 V and even more than 4 V, triggers problems such as poor round-trip efficiency and unfavorable parasitic reactions.2Unlike conventional lithium ion batteries (LIBs), the polarization of Li−O2 batteries is very high,
particularly during the charge process. This high polarization brings a potential gap as large as 1 V between charge and discharge, leading to an intrinsic loss of energy efficiency from source to end. Besides, it is reported that the commonly used carbon-based air electrodes are not stable above 3.5 V.3Carbon corrosion taking place at these high potentials not only deteriorates the coulombic efficiency but also releases CO2and
then forms Li2CO3during the subsequent discharge. Li2CO3is
an insulator, and it is stable within the potential window used for cycling; therefore, it is impossible to attain its complete removal, which leads to its accumulation and thus a gradual failure of the battery.4In short, lowering charging potential is preferential to ensure the durability of Li−O2 batteries and
therefore it is of high importance to develop a deeper understanding of the charging process. However, compared with discharge, the attention paid until now to understand the charge (or recharge) process of Li−O2batteries is very limited.
It is reported in literature that the charging of Li−O2
batteries is a stepwise process, although exact potentials for each phenomena differ from one case to another.5,6There are
few attempts based on experimental observations to explain the stepwise charge phenomenon in the literature. On the basis of in operando X-ray diffraction analysis, Ganapathy et al. suggested that the charge process starts with oxidation of amorphous Li2O2, followed by a layer-by-layer elimination of
Li2O2 toroidal particles via a Li-deficient solid-solution
reaction.7 Lu et al. proposed a charging mechanism that associates the initial stage of charge to the Li+ deintercalation
from Li2O2that results in the formation of LiO2-like species on
its surface, while the later stage is assigned to the oxidation of bulk Li2O2 particles to form Li+ and O2 via a two-phase
transition.8Most of these opinions are qualitative speculations and they lack a deeper examination to verify the consistencies of the assumptions behind. From the modeling side, Ceder et al. proposed an alternative reaction pathway of crystalline Li2O2
via the formation of off-stoichiometric Li2‑xO2compound rather
than direct decomposition,9while Dabrowski et al. related the two-step process to a mechanism with an initial peroxide-to-superoxide transition at lower potentials, followed by a later
release of O2 as well as Li+.10 The above theoretical
investigations are carried out on the atomic scale, where the impacts of mass transport and discharge product morphologies on the charge mechanism have been overlooked.
The initial conditions of the charge processes strongly depend on the discharge history, which determines the morphology and spatial distribution of the primary discharge product Li2O2. It is reported that the discharge of Li−O2
batteries can go through different pathways.11 The surface
mechanism gives a passivating thin layer with a thickness of 5− 10 nm, which is around the maximum electron tunneling distance according to DFT calculations,12 while the solution-phase mechanism forms large particles up to several microns in size and which usually adopt a toroidal morphology.13 These two mechanisms compete during the discharge and are highly dependent on the solvent properties as well as on the discharge rate.14 Bazant et al. have postulated the existence of a critical current density at which the transition from large particles to small particles takes place, implying that thin-film and large particles will not coexist in the system.13 However, Lau et al.
disagree with this view because the results of their discharge model, which is based on the nucleation and growth of Li2O2,
have shown the existence of a bimodal particle size distribution after full discharge with its peaks positioned at 47 and 170 nm.15The coexistence of the thin-film and large particles has also been experimentally confirmed indirectly by Zhai et al. because they found that the sizes of Li2O2 toroids did not
change during the first step of charge.5
We propose a mechanistic model to investigate the impact of the Li2O2 morphology on the charge process. As far as we
know, this is the first reported model providing a cohesive framework to explain the observed experimental features upon the Li−O2 battery charge. As shown in Figure 1, we assume
that the thin-film and the large particles coexist after discharge, which is the initial condition of our charge model. The thin film is assumed to be composed of small particles, and morphologies of both the thin-film and the large particles are assumed to be hemispherical. Moreover, different decom-position mechanisms are adopted for Li2O2 based on their
particle sizes due to the following reasons: First, although the bulk Li2O2 is considered as an insulator, its surface can be
metallic or semimetallic, as shown by theoretical calculations;16 therefore, the electronic conductivity of Li2O2particles can be a
function of its particle size. Moreover, large particles show higher crystallinity than the thin film, and higher oxidation kinetics is expected for the more amorphous form.17
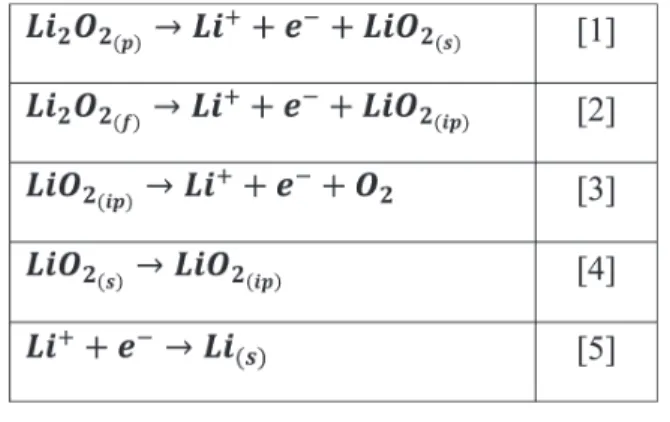
The elementary reactions involved in the modeled charge process are listed in Chart 1. Equation 5 holds for the Li+
reduction to form Li at the negative electrode. At the positive electrode, for the large Li2O2particles (Li2O2(p)), the oxidation
starts with the deintercalation of Li+ from its particle surface
(eq 1), forming LiO2-like species (LiO2(s)). Then, the LiO2(s)is
dissolved into the electrolyte in the form of ion pair (eq 4), noted as LiO2(ip), followed by a further oxidation on the
electrode surface to produce Li+and O
2(eq 3). For the
thin-film Li
2O2 particles (Li2O2(f)), a two-step decomposition
mechanism is adopted where LiO2(ip) is produced directly by
the oxidation of Li2O2(f)(eq 2), followed by the subsequent
oxidation of LiO2(ip). Because of the very fast decomposition of
Figure 1.Schematic illustration of the charge mechanisms adopted in our model for thin-film (small hemispheres) and large Li2O2large particles
LiO2(ip)during the third step of charge, the oxidation of Li2O2(f)
can be regarded as a one-step reaction involving two electrons. For the electrochemical reactions at the positive electrode (eqs 1−3), the reaction rate is characterized by the local faradaic current density ifar
∏
∏
α α = − Ψ − Φ − −− Ψ − Φ ⎪ ⎪ ⎪ ⎪ ⎧ ⎨ ⎩ ⎛ ⎝ ⎜ ⎞ ⎠ ⎟ ⎛ ⎝ ⎜ ⎞ ⎠ ⎟ ⎫ ⎬ ⎭ i n F k c n F RT k c n F RT exp (1 ) ( ) exp ( ) j fj i i s bj i i s far e e e i j i j , , (6)where ciis the dimensionless concentration (activity) of species
i, si,jis the stoichiometric coefficient of species i in reaction j, ne
is the number of electrons transferred in the reaction, kf jand kbj
are the heterogeneous rate constants, α is the charge-transfer coefficient, Ψ is the electrostatic potential in the electron-conductive phase (electrode), and Φ is the electrostatic potential in the electrolyte phase. Then, the cell potential is calculated with
= Ψ − Ψ
Ucell pos neg (7)
Under the galvanostatic condition, the total applied current (Iinput) given in amperes, is as follows
∫
∑
= I A V.i dv V j j j input 0 far (8)where Aj is the active surface area of the electrochemical
reaction j, ijfar is the Faradaic current density (A·m−2) of the
electrochemical reaction j, and V is the electrode volume. It is worth noting that Ψ as well as Φ are identical for all electrochemical reactions at the cathode. However, the value of Ajdiffers from one reaction to another due to the difference in
mobility of the electro-active species. For immobile Li2O2
solids, either in the form of large or thin-film particles, the active surface area for their oxidation refers to the surface area of the particle, as the reactions happen at the particle/ electrolyte interface. Thus for both morphologies the active surface areas are calculated with the following equations
π = Ap 2 r N Vp2 p (9) π = Af 2 r N Vf2 f (10)
where rpand rfare the radius of the large and thin-film particles,
respectively, and Npand Nfare the density (number per unit of
electrode volume) of large and thin-film particles, respectively. The LiO2(ip)oxidation takes place mainly on the uncovered part
of the electrode (e.g., carbon) by Li2O2; therefore, its
corresponding active surface area (ALiO2(ip)) for the reaction is
π π
= − −
ALiO (ip)2 AC r N Vf2 f r N Vp2 p (11)
where ACis the electrode (carbon) surface area.
For the chemical reaction, that is, LiO2(s)dissolution (eq 4),
the reaction rate is described by
= − v k A k C C 4 f,4 LiO b,4 LiO LiO 2(s) 2(ip) 2(ip),ref (12)
where kf,4and kb,4are the kinetic rate constants for the forward
and backward processes, respectively. LiO2(s), produced by the
oxidation of the large Li2O2particles (eq 1), forms a film over
the large Li2O2particles surface, and ALiO2(s)is the surface area
of LiO2(s), which is exposed to the electrolyte
θ
=
ALiO2(s) Ap (13)
where θ stands for the surface coverage of LiO2(s)on the Li2O2
large particles surface. The LiO2(s)film formed on the surface of
the large Li2O2particles may consist of multiple LiO2(s)layers.
When the LiO2(s)film is a monolayer, its surface coverage over
the large Li2O2particles is determined from the ratio between
the surface area of adsorbed LiO2(s)and the surface area of the
large Li2O2 particles (Figure 2). The surface coverage is
assumed to be 1 if the LiO2(s)consists of multiple layers.
The mathematical criterion for the surface coverage by LiO2(s)on the large Li2O2particles is then
θ δ π δ π δ π = < ≥ ⎧ ⎨ ⎪ ⎪ ⎩ ⎪ ⎪ V N V r V N V r V N V r 2 , 2 1, 2 LiO (s) p p2 LiO (s) p p2 LiO (s) p p2 2 2 2 (14)
where VLiO2(s) is the volume of the LiO2(s) calculated as a
function of time by usingeq 12andeq S5as follows
∫
ω ν ν = ′ − ′ ′ VLiO ( )t LiO t[ ( )t ( )] dt t 0 1 4 2(s) 2(s) (15)Besides, the dissolution kinetics of the LiO2(s)formed over the
large Li2O2 particles is assumed to be dependent on their
particle size according to18
σ ω = ∞ ⎛ ⎝ ⎜⎜ ⎞ ⎠ ⎟⎟ k k RTr exp 2 f,4 LiO LiO p 2(s) 2(s) (16)
Chart 1. Elementary Reactions Involving in the Charge Process in Our Model
Figure 2.Schematics of the LiO2(s)formed on the surface of a large
Li2O2 particle: To the left, a case is represented where the LiO2(s)
monolayer covers less than the large Li2O2particle surface (θ < 1), and
to the right, a case is represented where LiO2(s)completely covers the
where k∞
is a prefactor, σLiO2(s)is the LiO2(s)surface tension, and
ωLiO2(s)is the molar volume of LiO2(s).
For the electroactive species that are soluble in the electrolyte, namely, Li+, O
2, and LiO2(ip), we follow our
previous approach to solve their transport across the positive electrode as well as the separator.14,19,20It is assumed that the mass transport is governed by diffusion; therefore, transport of species i is described by the following equation
ε ε γ ∂ ∂ = ∂ ∂ ∂ ∂ + β ⎛ ⎝ ⎜ ⎞ ⎠ ⎟ c t x D c x ( )i i i 0 (17)
where ε is the porosity of the positive electrode or the separator, β is the Bruggeman coefficient, D0 is the bulk
diffusion coefficient, and γiis the source term, standing for the
consumption rate or generation rate of species. ε evolution during charge is calculated from the volume changes of large and thin-film Li2O2particles (cf.Supporting Information). γiis
obtained by summing up the consumption/formation rates of species i in each reaction
∑
γi= s v
j ij j
(18)
The evolution of the large Li2O2 particles volume during the
charge is given by
∫
ω γ = + V tp( ) Vp,0 Li O t ( ) dt V t 0 p 2 2 (19)where Vp,0 represents the initial volume of the large Li2O2
particles. Under the assumption of isotropic volume change, the evolution of the large particles size is obtained as it follows
π =⎛ ⎝ ⎜⎜ ⎞ ⎠ ⎟⎟ r t N VV t ( ) 3 2 ( ) p p p 1/3 (20)
The evolution of the thin-film particles volume and size are calculated through a similar approach. Because Li2O2 is
consumed during the charge, γp and γf are both negative;
therefore, these rates will cause their particle sizes and surface areas to decrease along the charge process. Under the galvanostatic condition where the imposed current remains constant and thus by combiningeqs 6−8, it is expected that the cell potential will increase during the charge processes due to the shrinking of the Li2O2 particles. Computational details of
the simulations are provided in theSupporting Information.
Figure 3a shows that according to the simulated charge
profile by using our model, the charge of a Li−O2battery is a
two-step process. All used cell parameters are from the experimental setup reported by Zhai et al.5 and are listed in
Table S1. The initial radius of the large particles is 75 nm,
which is adapted from Lau et al.,15while the radius of small particles is assumed to be 7 nm, which is close to the electron tunneling distance of Li2O2.12,21As shown inFigure 3b, during
the initial stage of the charge process, decomposition of small particles takes place, which continues until its complete removal, and then the decomposition of large particles starts. This successive decomposition is in agreement with the stepwise behavior of the charge profile, which implies that small particle oxidation accounts for the plateau at lower potential inFigure 3a, while large particle oxidation is related to the plateau at higher potential. This phenomenon is also consistent with the evolution of faradaic current densities due to the oxidation reactions of Li2O2(f), Li2O2(p), and LiO2(ip)
along the charge process (Figure 3c). Moreover,Figure 3c also shows that the current density due to the oxidation of LiO2(ip)
always accounts for half of the total applied current density;
Figure 3.Simulated results of (a) potential evolution as a function of charge capacity. (b) Size evolution of large particles (Li2O2(p)) and small
particles (Li2O2(f)) during the charge processes; the displayed sizes are normalized to the initial radius (75 and 7 nm for Li2O2(p)and Li2O2(f),
respectively). (c) Evolution of Faradaic current densities due to the oxidation of Li2O2(p)(red), Li2O2(f)(black), and LiO2(ip)(blue) as a function of
the charge capacity. (d) Concentration of LiO2(ip)as a function of the charge capacity. All cell parameters are adapted from Zhai et al.,5and the
therefore, the LiO2(ip) concentration remains low throughout
the charge process (Figure 3d). This steady oxidizing current density also causes the LiO2(ip)to decompose as soon as it is
produced, which is in agreement with the fact that the LiO2(ip)
has a short lifetime due to its fast kinetics.
Furthermore, the impacts of the discharge history, particularly the discharge rates on the charge processes, are investigated using our model. The first aspect of these history effects comes from the particle size distribution of Li2O2
produced after discharge. Usually, at higher discharge rates, it is expected to have larger proportion of the Li2O2in the form
of small particles (thin-film), whereas at lower rates Li2O2get
coalesced into large particles.17,22Therefore, the ratio between the total amount of large and small particles depends on the discharge rate. Figure 4a shows simulated charge curves with
different amount of small/large particles ratio, which illustrates that the capacity of the low potential plateau increases with the increase in the proportion of small particles. The simulation results are consistent with the experimental charge curves by Zhai et al., as shown inFigure 4b.
It is observed that the charge curves from experiments have smoother transition between the two charge plateaus, which may arise from the existence of a wider distribution of Li2O2
particle sizes, as suggested by Lau et al.15The oxidation kinetics during charge of Li−O2 batteries has been shown to be
dependent on the particle sizes of Li2O2 using our present
charge model. Therefore, in the future, we intend to implement a detailed particle size distribution, which may produce smoother charge curves with even sloppier plateaus, as obtained in some experiments.17Moreover, we are developing a full cycle model by combining discharge model with the present charge model. Therefore, the initial configuration including the particle size distribution and spatial distribution for charge, which are estimated here, can be obtained as outputs from the discharge part.
An innovative model has been developed that simulates the charge process of Li−O2batteries by combining mass transport
and elementary reaction kinetics. The model reproduces the stepwise charge profile of Li−O2cells, and it is shown to be a
particle size-dependent mechanism, which is in good agreement with the experimental observations. Furthermore, the analyses of our model results suggest that the particle size distribution of Li2O2, which depends on the discharge history, has strong
impacts on the charge processes. Therefore, controlling the discharge operation conditions can be an approach to improve
the round-trip efficiency and cycle life, as reported in literature.23 However, it is worth noting that the discharge
capacity of the cell usually decreases with the increase in discharge rate. Thus there is always a trade-off between different aspects of cell performances, and modeling can be an efficient tool to find the good compromise.
■
ASSOCIATED CONTENT*
S Supporting InformationThe Supporting Information is available free of charge on the
ACS Publications websiteat DOI:10.1021/acs.jpclett.6b01823.
Cell parameters implemented in the model, numerical method description, and model flowchart. (PDF)
■
AUTHOR INFORMATIONCorresponding Author
*E-mail:[email protected].
Notes
The authors declare no competing financial interest.
■
ACKNOWLEDGMENTSY.Y., V.T., and A.A.F. acknowledge Conseil Régional de Picardie and the European Regional Development Fund for the funding support through the project MASTERS. C.G. and A.A.F. are grateful to IRT Saint Exupéry for the financial support. A.T. and A.A.F. thank ALISTORE European Research Institute for A.T.’s Ph.D. grant. Dr. Charles Delacourt and Prof. Dominique Larcher at LRCS are acknowledged for helpful discussions.
■
REFERENCES(1) Larcher, D.; Tarascon, J.-M. Towards Greener and More Sustainable Batteries for Electrical Energy Storage. Nat. Chem. 2014, 7, 19−29.
(2) Girishkumar, G.; McCloskey, B.; Luntz, A. C.; Swanson, S.; Wilcke, W. Lithium−Air Battery: Promise and Challenges. J. Phys. Chem. Lett. 2010, 1, 2193−2203.
(3) Bruce, P. G.; Freunberger, S. A.; Hardwick, L. J.; Tarascon, J.-M. Li-O2and Li-S Batteries with High Energy Storage. Nat. Mater. 2011,
11, 19−29.
(4) Lu, Y.-C.; Gallant, B. M.; Kwabi, D. G.; Harding, J. R.; Mitchell, R. R.; Whittingham, M. S.; Shao-Horn, Y. Lithium−oxygen Batteries: Bridging Mechanistic Understanding and Battery Performance. Energy Environ. Sci. 2013, 6, 750−768.
(5) Zhai, D.; Wang, H.-H.; Yang, J.; Lau, K. C.; Li, K.; Amine, K.; Curtiss, L. A. Disproportionation in Li−O2Batteries Based on a Large
Surface Area Carbon Cathode. J. Am. Chem. Soc. 2013, 135, 15364− 15372.
(6) McCloskey, B. D.; Valery, A.; Luntz, A. C.; Gowda, S. R.; Wallraff, G. M.; Garcia, J. M.; Mori, T.; Krupp, L. E. Combining Accurate O2 and Li2O2 Assays to Separate Discharge and Charge
Stability Limitations in Nonaqueous Li−O2Batteries. J. Phys. Chem.
Lett. 2013, 4, 2989−2993.
(7) Ganapathy, S.; Adams, B. D.; Stenou, G.; Anastasaki, M. S.; Goubitz, K.; Miao, X.-F.; Nazar, L. F.; Wagemaker, M. Nature of Li2O2
Oxidation in a Li−O2 Battery Revealed by Operando X-Ray
Diffraction. J. Am. Chem. Soc. 2014, 136, 16335−16344.
(8) Lu, Y.-C.; Shao-Horn, Y. Probing the Reaction Kinetics of the Charge Reactions of Nonaqueous Li−O2Batteries. J. Phys. Chem. Lett.
2013, 4, 93−99.
(9) Kang, S.; Mo, Y.; Ong, S. P.; Ceder, G. A Facile Mechanism for Recharging Li2O2in Li−O2Batteries. Chem. Mater. 2013, 25, 3328−
3336. Figure 4.(a) Charge curves with different volume fraction of Li2O2(f):
30% (red), 50% (black), 70% green (green), which is in agreement with (b) charge curves corresponding to different discharge current densities: 0.05 mA/cm2(red), 0.1 mA/cm2(black), and 0.2 mA/cm2
(green). The charge current in all the cases is 0.1 mA/cm2and the
capacities are normalized to mass of carbon in g. Panel b is reprinted with permission from ref5.
(10) Dabrowski, T.; Ciacchi, L. C. Atomistic Modeling of the Charge Process in Lithium/Air Batteries. J. Phys. Chem. C 2015, 119, 25807− 25817.
(11) Johnson, L.; Li, C.; Liu, Z.; Chen, Y.; Freunberger, S. A.; Ashok, P. C.; Praveen, B. B.; Dholakia, K.; Tarascon, J.-M.; Bruce, P. G. The Role of LiO2Solubility in O2Reduction in Aprotic Solvents and Its
Consequences for Li−O2Batteries. Nat. Chem. 2014, 6, 1091−1099.
(12) Luntz, A. C.; Viswanathan, V.; Voss, J.; Varley, J. B.; Nørskov, J. K.; Scheffler, R.; Speidel, A. Tunneling and Polaron Charge Transport through Li2O2in Li−O2Batteries. J. Phys. Chem. Lett. 2013, 4, 3494−
3499.
(13) Horstmann, B.; Gallant, B.; Mitchell, R.; Bessler, W. G.; Shao-Horn, Y.; Bazant, M. Z. Rate-Dependent Morphology of Li2O2
Growth in Li-O2Batteries. J. Phys. Chem. Lett. 2013, 4, 4217−4222.
(14) Xue, K.-H.; McTurk, E.; Johnson, L.; Bruce, P. G.; Franco, A. A. A Comprehensive Model for Non-Aqueous Lithium Air Batteries Involving Different Reaction Mechanisms. J. Electrochem. Soc. 2015, 162, A614−A621.
(15) Lau, S.; Archer, L. A. Nucleation and Growth of Lithium Peroxide in the Li−O2Battery. Nano Lett. 2015, 15, 5995−6002.
(16) Radin, M. D.; Rodriguez, J. F.; Tian, F.; Siegel, D. J. Lithium Peroxide Surfaces Are Metallic, While Lithium Oxide Surfaces Are Not. J. Am. Chem. Soc. 2012, 134, 1093−1103.
(17) Adams, B. D.; Radtke, C.; Black, R.; Trudeau, M. L.; Zaghib, K.; Nazar, L. F. Current Density Dependence of Peroxide Formation in the Li−O2Battery and Its Effect on Charge. Energy Environ. Sci. 2013,
6, 1772−1778.
(18) Franco, A. A.; Tembely, M. Transient Multiscale Modeling of Aging Mechanisms in a PEFC Cathode. J. Electrochem. Soc. 2007, 154, B712−B723.
(19) Xue, K.-H.; Nguyen, T.-K.; Franco, A. A. Impact of the Cathode Microstructure on the Discharge Performance of Lithium Air Batteries: A Multiscale Model. J. Electrochem. Soc. 2014, 161, E3028−E3035.
(20) Franco, A. A.; Xue, K.-H. Carbon-Based Electrodes for Lithium Air Batteries: Scientific and Technological Challenges from a Modeling Perspective. ECS J. Solid State Sci. Technol. 2013, 2, M3084−M3100.
(21) Viswanathan, V.; Thygesen, K. S.; Hummelshøj, J. S.; Nørskov, J. K.; Girishkumar, G.; McCloskey, B. D.; Luntz, A. C. Electrical Conductivity in Li2O2 and Its Role in Determining Capacity
Limitations in Non-Aqueous Li-O2 Batteries. J. Chem. Phys. 2011,
135, 214704.
(22) Gallant, B. M.; Kwabi, D. G.; Mitchell, R. R.; Zhou, J.; Thompson, C. V.; Shao-Horn, Y. Influence of Li2O2Morphology on
Oxygen Reduction and Evolution Kinetics in Li−O2Batteries. Energy
Environ. Sci. 2013, 6, 2518−2528.
(23) Mirzaeian, M.; Hall, P. J.; Sillars, F. B.; Fletcher, I.; Goldin, M. M.; Shitta-bey, G. O.; Jirandehi, H. F. The Effect of Operation Conditions on the Performance of Lithium/Oxygen Batteries. J. Electrochem. Soc. 2013, 160, A25−A30.