OATAO is an open access repository that collects the work of Toulouse
researchers and makes it freely available over the web where possible
Any correspondence concerning this service should be sent
to the repository administrator:
[email protected]
This is an author’s version published in:
http://oatao.univ-toulouse.fr/23460
To cite this version:
Atasi, Omer and Haut, Benoit and Pedrono, Annaig and
Scheid, Benoit and Legendre, Dominique Influence of soluble
surfactants and deformation on the dynamics of centered
bubbles in cylindrical microchannels. (2018) Langmuir, 34
(34). 10048-10062. ISSN 0743-7463
Official URL:
https://doi.org/10.1021/acs.langmuir.8b01805
Influence of Soluble Surfactants and Deformation on the Dynamics
of Centered Bubbles in Cylindrical Microchannels
O. Atasi,
*
't,:t:
B. Haut
/
A Pedrono
,*
B. Scheid
/
and D. Legendre
*
'*
tTransfers, Interfaces and Processes (TIPs), Université libre de Bruxelles, 50 Avenue Franklin Roosevelt, 1050 Brussels, Belgium *Interface, Institut de Mécanique des Fluides de Toulouse (IMFf), Université de Toulouse, CNRS, 31400 Toulouse, France
10°
•
•
•
(al•
••
Bu bble burstD
D
{a) (b (c) �•
l':.Jo.bu.rst.•• •
.. ••
®•
•
(b)0
0
ro u•
•
•
•
•
•
•
•
(c)g)
<C:) D
� 10-1•
•
•
•
10-1 10° 101 102 LaABSTRACT: In this study, we investigate, using direct numerical simulation, the motion of a small bubble in a horizontal
microchannel filled with a liquid containing surfactants. In particular, we study the combined effect of surfactants and bubble deformability on the bubble shape, bubble-liquid relative velocity, velocity field in the liquid, liquid velocity on the gas-liquid interface, and surfactant distribution on the interface. The level set method is used to capture the gas-liquid interface. The surfactant transport equation on the gas-liquid interface is solved in an Eulerian framework and is coupled to an equation describing the transport of surfactants inside the liquid phase. The Marangoni stress, induced by surfactant concentration gradients, is computed using the continuum surface force mode!. The simulation results give insights into the complexity of the coupling of the different phenomena controlling the dynamics of the studied system. For instance, the results show that for values of the capillary number much smaller than unity, that is, for spherical bubbles, the bubble velocity decreases as the bubble
diameter increases. Moreover, surfactants tend to decrease significantly the bubble velocity, when compared with a bubble with a clean surface. Indeed, they accumulate at a convergent stagnation point/ circle on the bubble surface and deplete at a divergent stagnation point/ circle. As a consequence, the velocity of the liquid adjacent to the bubble is reduced in between the convergent and divergent stagnation points/circles because of Marangoni stresses. It is shown that regarding the bubble-liquid relative velocity, the bubble behaves as a rigid sphere when the Langmuir number is larger than unity, at least for the range of parameters explored in this study. For values of the capillary number of the order of unity, the bubble can take a "bullet shape".
In this case, the bubble velocity increases as the bubble diameter increases. This increase of the bubble-liquid relative velocity is linked to a drastic change in the liquid flow structure near the bubble. Surfactants are swept to the rear of the bubble and have Jess influence on the bubble dynamics than for spherical bubbles. Finally, it is shown that increasing the amount of surfactants
adsorbing to the surface eventually leads to the bursting of the bubble. • INTRODUCTION
Investigation of microscale flows is relevant for many microfluidic applications such as microheat exchangers, microabsorbers, and microextractors. 1
'2 In recent years, bubble microabsorbers were developed for industrial applications, and consequently, the motion of bubbles in microchannels was investigated thoroughly. In such a gas-liquid microscale flow, inertial effects are often negligible while surface tension and viscous forces dominate the system. The relative importance of inertial to viscous forces is assessed by the means of the Reynolds number: Re= p]id/µ, where p, µ, ]1, and d are the density and viscosity of the liquid, the mean flow velocity, and the bubble diameter, respectively. The Reynolds number
characterizing these microscale flows is often close or smaller than unity. The relative importance of viscous forces to surface tension forces is assessed by the me ans of the capillary number:
Ca =
J,µ/<J,
where<J
is the surface tension of the gas-liquid interface.Among the investigations regarding the motion of bubbles in microchannels, the dynamics of bubbles with a volume equivalent diameter, d, larger than the channel eiuivalent
bubble equivalent diameter is defined as d = (6V/π)1/3, where V is the bubble volume. For example, it was shown that the mass transfer in those systems is considerably enhanced due to recirculation of the liquid in between bubbles, promoting mixing.3 On the other hand, the motion and dissolution of small bubbles in microchannels, that is, bubbles with d/dh< 1, has received less attention. Cubaud et al. (2012) studied experimentally and globally the dissolution of spherical bubbles within microchannels.8 Feng (2010) studied the effect of Re and Ca on the dynamics of an isolated small bubble in a horizontal channel.9 Khodaparast et al. (2015) studied, with experiments and numerical simulations, the motion of bubbles inside horizontal channels.10 In their work, Re and Ca were varied (in the ranges 10−3< Re < 103and 10−4< Ca < 10−1) and the shape and the velocity of the bubble, Vb, was monitored. For d/dh< 1, they observed that Vb/Jldecreases as d/dh is increased. The same behavior was observed by Kurimoto et al. (2013) for buoyancy driven bubbles in vertical pipes.11Stan et al. (2011) studied the influence of Archimedes’ thrust on the vertical position of spherical bubbles within a horizontal and straight rectangular microchannel.12They also observed that, for neutrally buoyant bubbles characterized by small Re and moderate Ca, the equilibrium position of the bubble is near the symmetry axis of the channel. At larger Re, they observed that inertial migration forces shift this position off the horizontal symmetry plane of the channel.
When surfactants are introduced in the liquid, they may adsorb on the bubble surface and alter the surface tension of the gas−liquid interface. Consequently, an inhomogeneous distribution of the surfactants on the interface causes Marangoni stresses, influencing the dynamics of the bubble.13−17 This property of surfactants make them widely used in microfluidics to stabilize emulsions or to favor the formation of bubbles or droplets.18,19Regarding the dynamics of small bubbles translating along microchannels, Mikaelian et al. (2015) performed direct numerical simulations of spherical bubbles, that is, for Ca → 0, translating along a horizontal channel.20They investigated the effect of bubble confinement, through varying the parameter d/dh, on the bubble velocity. They considered two limiting situations to model the presence of surfactants. They imposed a zero shear stress on the gas− liquid interface to model the case of a clean interface. The presence of surfactants was accounted for by imposing a no slip condition on the gas−liquid interface (i.e., by imposing that the bubble behaves as a rigid sphere). They established correlations to calculate the ratio of the bubble velocity to the meanflow velocity, Vb/Jl, as a function of d/dh, for the case of a clean interface i k jjjjj jj ikjjjjj y{zzzzz y { zzzzz zz V J d d 1 exp 1.83 b l h 5 = + − (1)
and for a bubble behaving as a rigid sphere
i k jjjjj jj ikjjjjj y{zzzzz y { zzzzz zz V J d d 1 exp 1.92 b l h 9/4 = + − (2)
These correlations were established in the range 0.15≤ d/dh ≤ 0.75. Note that Rivero Rodriguez and Scheid (2018) extended the explored numerical range to 0 < d/dh ≤ 0.9 and used polynomialfittings to express Vb/Jlas a function of d/ dh.21
The effect of the surfactants on the velocity of the liquid adjacent to the bubble surface depends on their distribution on the gas−liquid interface. This distribution can be determined by solving the complete set of coupled partial differential equations governing the transport of surfactants on the bubble surface and in the liquid. In a microchannel bubbly flow, because of the bubble confinement created by the channel walls, the distribution of surfactants on the gas−liquid interface is expected to be fundamentally different from their distribution in the case of a bubble rising in an infinite liquid medium. To the best of our knowledge, the distribution of surfactants on the surface of a small bubble (i.e., d/dh < 1) translating in a horizontal microchannel has not been studied yet. Furthermore, the effect of the bubble deformability (i.e., the effect of Ca) on Vb/Jlin the presence of surfactants has not been studied in previous works.
Accordingly, in this study, we investigate, by direct numerical simulations, the combined effect of the bubble deformability, the presence of surfactants, and the bubble confinement on the dynamics of small bubbles (i.e., d/dh< 1) transported by a liquid in a horizontal microchannel. We consider the presence of surfactants by simulating their transport on the surface of the bubble and inside the liquid phase. We compute the Marangoni stress induced by their inhomogeneous distribution on the surface. The numerical code used for this study is the JADIM code, which has been developed to simulate dispersed two phaseflows.14,22−25Our analysis emphasizes on several parameters characterizing the system: the bubble shape, the ratio of the bubble velocity to the meanflow velocity, Vb/Jl, the drag coefficient of the bubble, Cd, thefluid velocity tangent to the bubble surface, Vs/Vb, and the surfactant distribution on the interface,Γ. Our goal is to highlight and quantify the key phenomena governing the studied system.
■
PROBLEM STATEMENTGeometry. We consider an axisymmetric bubble of diameter d moving in a horizontal and rectilinear microchannel with a circular cross section (referred to as a cylindrical microchannel in this work) of diameter dh, as sketched in
Figure 1. The channel has a length L and a pressure difference Δp > 0 is imposed between the left and the right boundaries of the domain. The bubble is centered in the channel. Rivero Rodriguez and Scheid (2018) have recently shown that centered bubbles are stable provided that d/dh is larger than 0.85 or that the Ohnesorge numberOh= Ca/Re is larger or
Figure 1. Axisymmetric bubble of density ρd and viscosity μd immersed in a viscous liquid of densityρcand viscosity μcinside a cylindrical microchannel of length L and diameter dh. The unit vector normal to the gas−liquid interface, n, and the unit vector tangent to the gas−liquid interface, t, are sketched in this figure.
equal to 0.2 for bubbles with d/dh < 0.85. In addition, they showed that regardless of the value of Oh, Vb/Jland the bubble shape are not affected by Re provided that Re ≲ 8. In this study, a particular attention is held to ensure that Oh≥ 0.2, so that the bubble can be considered as centered. The liquid and the bubble surface contain surfactants with initial concen trations C∞ andΓ0, respectively.
Equations and Modeling Assumptions. Under the assumptions that (i) thefluids are Newtonian and incompres sible, (ii) there is no gas−liquid mass transfer through the interface, and (iii) the flow is isothermal, the velocity field v and the pressure p satisfy the classical onefluid formulation of the Navier−Stokes equations:26
v 0 ∇· = (3) v v v T n n t p 1 1 ( ) I 1 I ρ ρ σ ρ δ ρ σδ ∂ ∂ + ·∇ = − ∇ + ∇· ̅ − ∇· − ∇ (4)
whereT = μ(∇v + (∇v)T) is the viscous stress tensor,ρ, μ, σ are the density, dynamic viscosity, and surface tension, respectively, n is a unit vector normal to the interface, arbitrarily chosen pointing toward the liquid phase (seeFigure 1), andδIis the Dirac distribution associated with the bubble− liquid interface.
The transport equations of the surfactants in the liquid phase and on the gas−liquid interface are given by14,27
v C t c C (D Cc ) ∂ ∂ + ·∇ = ∇· ∇ (5) v t s(s ) Ds s S 2 ∂Γ ∂ + ∇ · Γ = ∇ Γ + Γ (6)
where C is the surfactant concentration in the liquid phase,Γ is the surfactant concentration on the gas−liquid interface, Dc and Ds are the diffusion coefficients of the surfactants in the liquid phase and along the interface, respectively, vc is the velocityfield in the liquid phase, vs is the projection ofvcon the tangent to the interface,∇s = ((I − (n ⊗ n))·∇) is the surface gradient operator,28 and SΓ is the flux of surfactants from the liquid phase to the interface because of the adsorption/desorption of the surfactants, i.e., SΓ = (Dcn·∇C)|I, where the subscript I denotes the bubble−liquid interface. It is given by14,29
SΓ=k Ca I(Γ − Γ −∞ ) kdΓ (7)
where ka and kd are adsorption and desorption kinetic constants, respectively, and CI is the surfactant concentration in the liquid in contact with the interface.
It is assumed that the surface tension depends on the surfactant concentration on the interface according to an equation of state derived from the Langmuir adsorption isotherm30 i k jjjjj y{zzzzz RT ln 1 0 σ =σ + Γ − Γ Γ ∞ ∞ (8)
where R is the ideal gas constant, T is the absolute temperature,σ0 is the surface tension of the clean interface, andΓ∞is the maximum packing concentration of surfactants on the interface.
Considering the boundary conditions, periodicity is imposed between the inlet and the outlet of the domain, simulating therefore a train of bubbles, a no slip condition with zero
transfer rate is imposed on the wall and a symmetry condition is imposed on the symmetry axis:
l m ooooo o n ooooo o v v v v n 0 0 r z z d r /2 a 0 left right h | = | | = · | = = = (9) l m ooooo o n ooooo o n C C C C n 0 0 z z r d r w /2 a 0 left right h | = | ∇ · | = ∇ · | = = = (10) l m ooo n ooo n 0 z z r a 0 left right Γ| = Γ| ∇Γ· |= = (11) pz pz p left right { | = | + Δ (12)
wherenwis the unit vector normal to the channel wall,nais the unit vector normal to the symmetry axis, (z,r) are the axial and radial coordinates, respectively (see Figure 1), and zleft and zright are the axial coordinates localizing the left and right boundaries of the computational domain, respectively.
Dimensional Analysis. The governing equations are solved in their dimensional forms and the results are expressed in terms of relevant dimensionless parameters. Let3 and <
be appropriately defined length and velocity scales, respec tively. The number of dimensional parameters, 16, minus the number of dimensions, 4, results in 12 dimensionless numbers allowing the characterization of the problem. Two of them characterize the geometry of the system, whereas 10 others characterize its dynamics. These 10 dimensionless numbers are defined as follows Re c ,Ca ,m , c c 0 d c d c <3 < ρ μ μ σ ρ ρ λ μ μ = = = = E La Da Pe Pe , , , , , RT k C k C k C D s D 0 a d a c s 3 3 < <3 <3 α = = = = = = σ Γ∞ ∞ Γ∞ ∞ ∞ (13)
where Re, Ca, E, La, Da,α, Pe, Pes, m, andλ are the Reynolds number, capillary number, elasticity number, Langmuir number, Damkohler number, dimensionless adsorption rate, Peclet number based on the bulk surfactant diffusivity, Peclet number based on the interfacial surfactant diffusivity, ratio of the gas viscosity (μd) to the liquid viscosity (μc), and ratio of the gas density (ρd) to the liquid density (ρc), respectively.
The velocity scale< is set equal to the mean velocity of the monophasic liquid Poiseuille flow that would have been generated by the imposed pressure gradient, Δp/L:
Jlref pdh2/(32cL)
<= = Δ μ , and the length scale is set as
d
3 = . This length scale sets the two dimensionless numbers characterizing the geometry: d/dhand L/d. It has been verified that the difference between Jlref and the actual value of Jl obtained in the simulations varies between 0.8 and 2.8%, confirming that the chosen scale is appropriate for the setup considered in this work. The capillary number, Langmuir number, and ratio of the bubble equivalent diameter to the tube diameter are varied in the range 10−2< Ca < 1, 0 < La < 10, and 0.15 < d/dh< 0.75, respectively. The other parameters
are set to values usually encountered for surfactants in bubbly flows: Da = 0.1, E = 0.12, α = 0.1, Pes=∞.16,31Furthermore, the parameters m and λ are set to m = 10−3 and λ = 10−2, which are typical values encountered in bubbly flows. To satisfy the criterion Ca/Re ≥ 0.2, the value of Re is either set equal to 1 if Ca≥ 0.04 or to Ca/0.04 if Ca < 0.04. As discussed earlier, the bubble shape and Vb/Jldo not depend on Re for Re ≲ 8. The value of Pe sets the thickness of the surfactant diffusion boundary layer around the bubble. A particular attention has to be paid to capture the surfactant concentration gradients within this boundary layer. As a consequence, the value of Pe is set to a moderate value, Pe = 500, to avoid too large computational costs. The value of L/d is increased gradually, starting from 4, until Vb/Jlbecomes independent of L/d.
■
NUMERICAL PROCEDUREThe numerical code used for this study is the JADIM code developed to perform local analyses of dispersed two phase flows. To study the dynamics of a small bubble in a microchannel in the presence of surfactants, we have introduced the resolution of the surfactant transport equation on the gas−liquid interface and in the liquid in the level set (LS) modulus of JADIM.23,32The distribution on the interface of the Marangoni stress induced by the inhomogeneous distribution of the surfactants on the gas−liquid interface is computed using the continuum surface force (CSF) model. In JADIM, the implemented LS method consists in an Eulerian description of each phase on afixed grid, the interface between the two phases being calculated using the transport equation of the signed distance function to the interface,ϕ. The two fluids are assumed to be Newtonian and incompressible, with no phase change.
Level-Set Method. The location of each phase with respect to the interface is given by the signed distance function to the interface (or LS function),ϕ(x,t). This distance function obeys to the following transport equation33
v t 0 ϕ ϕ ∂ ∂ + ·∇ = (14)
ϕ is defined as being positive in the gas phase and negative in the liquid phase. A classical redistanciation equation is applied to the LS function at each time step
sign( )( 1) 0
ϕ
τ ϕ ϕ
∂
∂ + |∇ | − = (15)
whereτ is a fictitious time. The sign function is34
t x x sign( ( , )) 2 2 ϕ ϕ ϕ = + Δ (16)
whereΔx is the grid size.
The normal to the interface,n, and the interface curvature, κ, are computed with the LS function as follows:
n ϕ ϕ = − ∇ ∇ (17) and i k jjjj y{zzzz κ ϕ ϕ = −∇· ∇ ∇ (18)
The tangent to the interface,t (seeFigure 1), is calculated as
(
)
t ,
r z
1
= − ∇ϕ ∂∂ϕ −∂∂ϕ . The volume fraction of the gas phase in a given computational cell, F, is computed from the LS function using a smooth Heaviside function
l m ooooo oooo n ooooo oooo i k jjjj ikjjj y{zzzy { zzzz F H x x x ( ) 0 if ( ) 1 2 1 1 sin if ( ) 1 if ( ) ϕ ϕ ϕ π πϕ ϕ ϕ = = < −ϵ + ϵ + ϵ − ϵ < < ϵ > ϵ (19)
where ϵ = 2Δx is the half numerical thickness of the interface. The local viscosity and density, μ and ρ, are calculated using an arithmetic mean of the properties of each phase:μ = μc(1− F) + μdF,ρ = ρc(1− F) + ρdF.
Transport of the Surfactants in the Bulk of the Liquid and on the Gas−Liquid Interface. In an Eulerian description of each phase on a fixed grid and for incompressible fluids, the following equivalent form of eq 6
is used34−36 v n v n n n n t ( ) Ds D S 2 κ 2 ∂Γ̃ ∂ + ·∇Γ̃ − Γ̃ · ∇ · = [∇ Γ̃ − ∇Γ̃· − · Γ̃· ] + Γ̃ (20)
where D2Γ̃ is the Hessian matrix of Γ̃, SΓ= kaCI(Γ∞− Γ̃) − kdΓ̃ and Γ̃ is a scalar field defined on the whole computational domain; Γ̃ is the result of the extrapolation of Γ from the interface toward the liquid and gas phases. Accordingly, the following partial differential equation (PDE) is solved after each physical time step of the procedure, with the initial conditionΓ̃*(x,τ = 0) = Γ̃(x,t)34 sign( ) 0 τ ϕ ϕ ϕ ∂Γ̃* ∂ + ∇ ∇ ·∇Γ̃* = (21)
This method allows calculating the time evolution of Γ, a quantity associated with a moving and deforming surface, in a fixed coordinate system.34
As pointed out by Xu and Zhao (2003), it has been observed thatfive iterations are sufficient when solvingeq 21, forΓ̃* to reach its converged values with respect toτ. Indeed, we have checked that the relative variation of the values of Γ̃* is less than 0.5% when the number of fictitious time step is increased from 4 to 8.
Following Muradoglu and Trigvason (2008) and Hayashi and Tomiyama (2012), eq 5 is solved under a noflux boundary condition at the interface: (Dcn·∇C)|I = 0. Consequently, the boundary condition of eq 5, SΓ = (Dcn·∇C)|I, is included in the bulk transport equation as an interfacial source term SΓδI
v C t C (D Cc ) S δI ∂ ∂ + ·∇ = ∇· ∇ − Γ ∼ (22)
In this technique, an implicit assumption is made that all of the surfactant transfer from the liquid phase to the gas−liquid interface takes place in a thin layer adjacent to the interface. In other words, the total amount of surfactants adsorbed from the liquid to the interface is distributed along this thin layer and added as an interfacial source term in the transport equation. The noflux condition is enforced by extrapolating C from the interface to the gas phase, solving the following PDE at each physical time step, with the initial condition C*(x,τ = 0) = C(x,t)
C C sign( ) 0 τ ϕ ϕ ϕ ∂ * ∂ + ∇ ∇ ·∇ * = (23)
In this study,eq 23was solved performingfive fictitious time step. It has been verified that the computed values of C* are not modified by more than 0.5% if more iterations are performed. The time scheme used for solvingeqs 14,15, and
20−23 is a third order Runge−Kutta scheme. The spatial scheme used for the advective terms in the different equations is the conservative form of the fifth order WENO scheme, whereas a second order centered scheme is used for the other terms.
Equation 8 is slightly modified to avoid negative values of the surface tension15and is rewritten in terms ofΓ̃
l m ooo n ooo Ä Ç ÅÅÅÅÅ ÅÅÅÅÅ ikjjjjj y { zzzzzÉÖÑÑÑÑÑÑÑÑÑÑ|}ooo ~ ooo RT max , 1 ln 1 0 0 0 σ σ σ = ϵ + Γ − Γ̃ Γ ∞ ∞ (24)
whereϵ0= 0.05.Equation 24is representative of the variation of the surface tension of an interface with its surfactant concentration. For instance, in the case of stretching liquid bridges, it was shown that σ reaches a plateau when Γ approachesΓ∞.37
Navier−Stokes Equations Solver. The system of eqs 3
and4is discretized on a staggered grid using afinite volume method. All spatial derivatives are discretized using second order centered schemes. The time scheme used to compute the advective terms in the Navier−Stokes equations is a third order Runge−Kutta scheme, whereas the viscous stresses are computed using a semi implicit Crank−Nicolson method. The incompressibility is ensured using a projection method. Further details on the numerical algorithms concerning the spatial discretization, as well as the time advancement procedure, can be found in Magnaudet el al. (1995) or in Legendre and Magnaudet (1998).24,38
The CSF model is used to compute the capillary term ineq 339 n n n V F S ( ) d s I
∫
cell σ ρ δ σ ρ ϕ ϕ ∇· ≈ − ̅∇ ∇ ∇ · (25)where ncell is the unit vector normal to the faces of the cells centered on the velocity points,σ is the local value of σ at the center of these cells, dS is the area of the cell faces, and s denotes a surface integral. The Marangoni stress is also computed at the center of the cells centered on the velocity points Ä Ç ÅÅÅÅÅ ÅÅÅÅÅ ikjjjj y { zzzzÉ Ö ÑÑÑÑÑ ÑÑÑÑÑikjjjjj y { zzzzz 1 2 ( ) s I c d I ρ σδ σ ϕ ϕ ϕ ϕ σ ρ ρ ρ δ ϕ ∇ = ∇ − ∇ ∇ ∇ ∇ ·∇ + (26)
where δ(ϕ)I is a smoothed Dirac function, which allows spreading the effect of the Marangoni stress over the numerical thickness of the interface
l m oooooo n ooooo Ä Ç ÅÅÅÅÅ ÅÅÅÅ ikjjj y{zzz É Ö ÑÑÑÑÑ ÑÑÑÑ ( ) 1 2 1 cos , for ( ) 0 otherwise I I δ ϕ πϕ ϕ δ ϕ = ϵ + ϵ | | < ϵ = (27)
Grid. A uniform grid with square cells is used for the computations. At least four cells are placed inside the concentration boundary layers. The thickness of the boundary layers on the channel wall and on the gas−liquid interface (δw
andδb) are estimated asδ ≈b d/ Pe andδ ≈w dh/ Pe. The dimensions of the square cells are deduced such that at least four cells are placed in the concentration boundary layer around the bubble:Δ = Δ =z r d/(4 Pe).
■
VALIDATION OF THE NUMERICAL PROCEDUREThe LS modulus of JADIM has been validated previously.5,23 Specific validation tests regarding surfactant induced Mar angoni stress have been performed and are reported in the
Supporting Information. Those tests aim to validate the numerical implementation of (i) the different terms in the equation describing the surfactant transport on the gas−liquid interface, (ii) the source/sink term in the equation describing the exchanges of surfactants between the bulk and the interface, and (iii) the computation of the Marangoni stress. Namely those tests include
1 (i) A surface expansion test where the implementation of the termΓ̃n·∇v·v ineq 20is validated,
2 (i) A surface advection test where the implementation of the termv·∇Γ̃ ineq 20is validated,
3 (i) A surface adsorption test where the implementation of the term (kaCI(Γ∞ − Γ̃) − kdΓ̃)δI in eq 20 is validated,
4 (i) A diffusion test where the implementation of the term Ds[∇2Γ̃ − κ∇Γ̃·n − n·D2Γ̃·n] ineq 20is validated, 5 (ii) A bulk exchange test where the implementation of the term (kaCI(Γ∞− Γ̃) − kdΓ̃)δIineq 22is validated, 6 (iii) A test to validate the computation of the Marangoni
stress, that is,∇sσ in eq 3.
For each test case (i, ii, and iii), the convergence of the simulation is investigated. As a result, the overall convergence order of the solver is third order in time and near second order in space. All these tests are available in the Supporting Information. In this section, the validation of the whole numerical procedure is done using a rising bubble as a test case.
A bubble is initialized at the center of an axisymmetric domain. The domain and the boundary conditions are the same as those introduced inFigure 1, with L/d = 20, dh/d = 16, andΔp/L = ρcg, where g is the gravity acceleration (i.e., gravity acts along the negative z axis (see Figure 1) and, consequently, the bubble rises due to its density difference with the surrounding liquid). The bubble interface is initially clean, that is,Γ̃(x,t = 0) = 0. The surfactant concentration is initially uniform in the liquid C(x,t = 0) = C∞. The problem is governed by the following dimensionless numbers: E, La, Da, α, Pe, Pes, ρd/ρc, μd/μc, Eo, and Mo, where Eo = ((ρc − ρd) gd2)/σ is the Eotvos number and Mo = ((ρc − ρd)gμc4)/ (ρc2σ3) is the Morton number. The parameters arefixed to E = 0.5, Da = 10,α = 20, Pe = 10, Pes= 100, m = 0.1,λ = 0.025, Eo = 1, Mo = 0.1, and La is set to 0 or 1. The terminal bubble velocity computed with JADIM is compared with values computed by Tasoglu et al. (2008), who solved the same problem using afinite difference/front tracking method.15For the chosen parameters, a clean buoyant bubble is spherical.40 The terminal values of the bubble Reynolds number, Reb = ρcVbd/μc, obtained by Tasoglu et al. (2008) for a clean bubble (La = 0) and a contaminated one (La = 1) are summarized in
Table 1together with the values obtained using JADIM. As it can be seen inTable 1, the values computed with JADIM are in excellent agreement with those computed by Tasoglu et al.
(2008). The convergence rate of Rebwith respect to the mesh size for La = 1 was determined to be about 1.5.
Simulations were also performed varying Eo, Mo, and La. The drag force acting on the bubble, Fd, has been computed using the cylindrical coordinate system (r,z) as follows
F 2 ( ( , ( ))z r z ( p z r z( , ( )) ( , ( ))) ( )) ( ) dz r z r z r z z z z d nt I c I nn I I I r f
∫
π τ τ = − − + ′ (28)where zrand zfare the axial coordinates localizing the back and the front of the bubble, respectively, rI(z) is the radial coordinate localizing the gas−liquid interface,r r
z I d d I ′ = ,τnt= (T· n)·t is the tangent viscous stress, τnn= (T·n)·n is the normal viscous stress, and pcis the periodic component of the pressure inside the liquid (i.e., pc =p+ Δp Lz/ ). To evaluate Fd, the values of τnt and τnn are first calculated at the center of the computational cells and then interpolated on the gas−liquid interface.
The drag coefficient of the spherical bubble, based on the terminal bubble velocity and its diameter, is then computed for each simulation: Cd= Fd/(0.5ρcπ(d/2)2V
b2). InFigure 2, drag
coefficients computed with JADIM are compared with correlations predicting Cd as a function of Reb for a clean bubble41 i k jjjjj jjj ikjjjjjj i k jjjjj y { zzzzzy { zzzzz z y { zzzzz zzz C Re Re Re 24 2 3 12 0.75 1 3.315 d b b b 1/2 1 = + + + − (29)
and for a rigid sphere42
C Re Re 24 (1 0.15 ) d b b 0.687 = + (30)
It can be observed inFigure 2that varying La from 0 to 1 allows obtaining a bubble rising with a drag coefficient characterizing a bubble with a clean interface (for La = 0) or characterizing a rigid sphere (for La = 1).
■
RESULTSIn this section, the dynamics of a small bubble inside a horizontal microchannel is studied. Initially, that is, at t = 0 s, the bubble is at the center of the computational domain, as sketched in Figure 1. The liquid surrounding the bubble contains surfactants with an initially homogeneous concen tration, C∞. The independency of the bubble terminal velocity on the initial surfactant concentration on the bubble−liquid interface,Γ0, has been verified. To illustrate this statement, the instantaneous bubble velocity, Vb, is presented inFigure 3as a
function of the time t, for different values of Γ0, as compared to the equilibrium valueΓ = Γeq ∞La/(1+ La). ForΓ0= 0, it can
be observed that the bubble first accelerates. Then, as surfactants adsorb on the bubble−liquid interface, Vb begins to decrease until it reaches its terminal value. When Γ0 is increased, the bubble reaches its terminal velocity at an earlier time. It is observed that this terminal velocity is not affected by the value ofΓ0. Therefore, in all of the numerical simulations presented in this work, the initial concentration of surfactants on the bubble−liquid interface is set to the equilibrium value: Γ0=Γeq. In this way, the effective simulation time is reduced. The mass of surfactants is monitored on the bubble surface asM t( ) d ( )S t
S t( )
∫
= Γ̃ , following the method of Xu and Zhao (2002). The simulations are stopped when the relative variation of M(t) and of the bubble velocity, Vb, is less than 1%. Unless explicitly mentioned, all of the results presented in this section relate to a stationary state of the studied system.
In the first part of this section, the dynamics of a small spherical bubble, that is, Ca ≪ 1, inside a horizontal microchannel is studied. The second part deals with the shape and theflow field around a deformable bubble, in the absence of surfactants. Finally, the combined effect of surfactants and bubble deformability on the bubble dynamics is analyzed.
Spherical Bubbles. Figure 4 presents the steady state surface concentrationfield of the surfactants, Γ̃ (presented at the vicinity of the bubble surface only), bulk concentration field of the surfactants, C, and velocity streamlines in a reference frame attached to the bubble mass center, for Re = 0.25, Ca = 10−2, d/dh = 0.75, La = 0 (Figure 4a), La = 0.1 Table 1. Comparison between the Values of the bubble
Terminal Reynolds Number,Reb, Obtained in This Study and the Ones Obtained by Tasoglu et al. (2008)
La 0 1
Tasoglu et al. (2008) 0.241 0.164
present study 0.239 0.161
Figure 2.Drag coefficient, Cd, of a buoyant bubble as a function of its Reynolds number (terminal value). Squares, pentagons, and triangles are values of the drag coefficient of the bubble computed with JADIM for values of the Eotvos number and Morton number equal to (Eo = 1; Mo = 0.1), (Eo = 1; Mo = 10−5), and (Eo = 0.1; Mo = 10−9), respectively. Blue, black, and red symbols are values corresponding to La = 0, La = 0.1, and La = 1, respectively. The red and blue solid lines give values of the drag coefficient predicted by the correlations given ineqs 30and29, respectively.
Figure 3.Vbas a function of the time for different values of the initial concentration of surfactants on the gas−liquid interface: Γ0= 0,Γ0= 1/2Γeq, andΓ0=Γeq, for Ca = 0.01, d/dh= 0.75, and Re = 0.25.
(Figure 4b), La = 1 (Figure 4c), and La = 10 (Figure 4d). The bubble moves from the left to the right in a laboratory reference frame. As expected, for Ca = 10−2and for Re≈ 1, the bubble is spherical. As it can be observed in Figure 4, the structure of the liquid flow in the microchannel appears to differ significantly from the one observed when a bubble rise in a liquid of infinite extend. More specifically, it is observed that theflow structure generates a convergent stagnation point at the front of the bubble (point A inFigure 5) and a divergent
stagnation point at the rear of the bubble (point B inFigure 5). Moreover, theflow generates a convergent stagnation circle on the back half of the bubble side (C inFigure 5) and a divergent stagnation circle on the front half of the bubble side (D in
Figure 5). Consequently, on the surface, the surfactants accumulate near the convergent point/circle and are depleted near the divergent point/circle. This is clearly observed in
Figure 4.
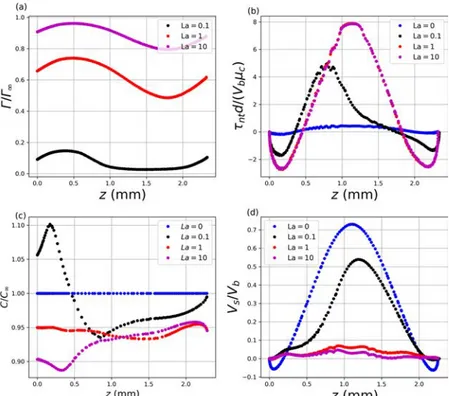
The surfactants reduce the surface tension and, conse quently, their inhomogeneous distribution on the bubble− liquid interface induces surface tension gradients that are expected to alter thefluid velocity along the interface. InFigure 6a−d, the dimensionless surfactant concentration on the bubble surface,Γ̃/Γ∞, the dimensionless tangent shear stress on the bubble surface, τntd/(Vbμc), the dimensionless surfactant concentration inside the liquid adjacent to the bubble surface, C/C∞, and the dimensionless gas−liquid relative velocity on the bubble surface, Vs/Vb, where Vs = (Vb− v·t) are plotted as functions of the axial coordinate, z, for
different values of La and with Re = 0.25, Ca = 0.01, and d/dh = 0.75. Note that the origin of the axial coordinate, z = 0, is at the back of the bubble. As described previously, the recirculating flow in between bubbles causes surfactants to accumulate near the convergent stagnation point/circle on the bubble surface and to deplete near the divergent stagnation point/circle. This is confirmed byFigure 6a. Notably, for La = 0.1, the adsorption flux of surfactants toward the bubble surface is not sufficient to maintain surfactants around the divergent stagnation circle on the front half of the bubble side (point D inFigure 5) and, consequently, the bubble surface is almost clean of surfactants near this divergent stagnation circle. The tangent shear stress distribution on the bubble surface is shown inFigure 6b. It can be observed that the shear stress increases as La is increased. The shear stress is positive on the side of the bubble and becomes negative at the back and at the front of the bubble. At the front of the bubble, near the convergent stagnation point on the bubble surface (point A in
Figure 5), surfactants accumulate. On the contrary, near the divergent stagnation circle on the front half of the bubble (point D inFigure 5), surfactants are depleted. This creates a Marangoni stress directed toward the back of the bubble, as sketched inFigure 5, leading to the negative values ofτntat the front of the bubble for La > 0 (seeFigure 6b). A Marangoni stress directed toward the back of the bubble is also generated between C and B, for La > 0 (seeFigure 6b). On the other hand, as shown inFigure 6b, on the side of the bubble, for La > 0, a Marangoni stress induced in between the divergent stagnation circle and the convergent one is directed toward the front of the bubble, as sketched inFigure 5. It is observed in
Figure 6b that the tangent shear stress reaches a maximum on the side of the bubble, where the gap between the bubble and the channel wall is the smallest. For La = 0.1, as discussed previously, the surfactant adsorption toward the interface is small when compared with the advectiveflux of the surfactant from the divergent stagnation circle to the convergent stagnation one. As a consequence, the shear stress on the bubble surface does not increase significantly on the front part of the bubble when La is increased from 0 to 0.1. It is observed in Figure 6b that the tangent shear stress, τnt, becomes independent of La when La > 1. It should be noted thatτntd/ (Vbμc) reaches its maximum value at locations on the bubble surface where∇Γ̃ is the highest. For instance, the shear stress profile on the bubble surface presented inFigure 6b, for La = 0.1, exhibits a maximum at z≈ 0.75 mm. At that location on the bubble surface,Γ̃/Γ∞ exhibits an important gradient, as it can be observed in Figure 6a, for La = 0.1. This can be
Figure 4.Contour plots of (top) the surfactant concentrationfield on the bubble surface, Γ̃, and (bottom) the bulk surfactant concentration field, C. Velocity streamlines are drawn in a reference frame translating with the bubble. The bubble moves from the left to the right. (a) La = 0, (b) La = 0.1, (c) La = 1, and (d) La = 10.
Figure 5.Spherical bubble inside a microchannel. The bubble goes from left to right. Red dots depict a divergent stagnation point/circle on the bubble surface, where consequently the surface tension is high. Green dots depict a convergent stagnation point/circle on the bubble surface where the surface tension is low. Velocity vectors, in black, are drawn in a reference frame attached to the bubble mass center. Red arrows depict the direction of the Marangoni stress.
rationalized by writing the tangent shear stress balance at the interface, neglecting the viscosity of the gas phase:τnt=∇sσ·t, where∇sσ can be linked to the gradient of Γ̃ througheq 24. It might be expected that the Marangoni stresses induced by the interaction between theflow structure and surfactants tend to immobilize (in a reference frame attached to the bubble) the bubble surface for large values of La. This is characterized in
Figure 6d, where Vs/Vbis plotted against the axial coordinate, z. When La = 0, the surface velocity is positive on the side of the bubble and changes sign near the front and the back of the bubble because of the recirculatingflow. When La is increased to 0.1, thefluid velocity is significantly reduced on the side of the bubble. Moreover, Vs is also significantly modified on the front/back of the bubble. For instance, Vs/Vbreaches almost the value of 0 in between the convergent stagnation point and the divergent stagnation circle on the front half of the bubble side (between A and D in Figure 5): the Marangoni stress induced in between the convergent stagnation point and the divergent stagnation circle tends to immobilize the interface, in this region, when La is increased from 0 to 0.1. As La is increased to 1, Vs approaches 0 everywhere on the bubble surface: the Marangoni stress created in between the convergent stagnation circle (C inFigure 5) and the divergent one (D in Figure 5) leads almost to the interface immobilization.
The surfactants induce an immobilization of the bubble surface (in a reference frame attached to the bubble) through the mechanisms discussed in the previous paragraph. Thus, it might be expected that the surfactants have a significant impact on the velocity of the spherical bubble. An important parameter in microfluidic bubbly flow is the ratio of the bubble velocity, Vb, to the mean flow velocity, Jl. Mikaelian et al. (2015) established correlations, valid for an isolated
spherical bubble (i.e., for Ca→ 0), to calculate this ratio as a function of d/dh, for two limiting situations:20 (i) They imposed a stress free condition on the bubble surface to model a situation without surfactants. They proposed eq 1 to calculate Vb/Jl in this limiting situation. (ii) They imposed a no slip condition at the bubble surface to model the influence of surfactants. They proposedeq 2 to calculate Vb/Jl in this situation. The ratio Vb/Jlis presented inFigure 7as a function of d/dh, for different values of La and for Ca = 0.01 and Re = 0.25.Equations 1 and2 are represented in this figure as the blue and red solid lines, respectively. Squares give values calculated with JADIM for La = 0, 0.1, 1, and 10. It is observed that the two limiting cases are well reproduced by our
Figure 6.(a) Dimensionless surfactant concentration on the bubble surface,Γ/Γ∞, (b) dimensionless shear stress tangent to the bubble surface, τntd/(Vbμc), (c) dimensionless surfactant concentration inside the liquid adjacent to the bubble surface, C/C∞, and (d) dimensionless liquid velocity tangent to the bubble surface, Vs/Vb, as functions of the axial coordinate, z, for different value of La; z = 0 is at the back of the bubble. The other dimensionless numbers arefixed to Re = 0.25, Ca = 0.01, and d/dh= 0.75.
Figure 7.Ratio of the bubble velocity to the meanflow velocity, Vb/Jl, as a function of the ratio of the bubble diameter to the channel diameter, d/dh. Blue and red solid lines are the correlations established numerically by Mikaelian et al. (2015) for a stress free and an immobile interface, respectively. Squares give values obtained with JADIM, for different values of La and for Re = 0.25 and Ca = 0.01.
simulations, for La = 0 and La = 1. An intermediate value of Vb/Jlis obtained for La = 0.1. In line with the observations in the previous paragraph, Vb/Jl becomes independent of La for La > 1: the value of Vb/Jlthat characterizes a bubble behaving as a rigid sphere is obtained for La > 1. It is worth pointing out that, as seen in the previous section, a spherical bubble rising in a stagnant liquid of infinite extent containing surfactants behaves also as a rigid sphere regarding its velocity when La≥ 1. The analysis of the velocityfield for the different cases shows that recirculations at the front and at the back of the bubble are present for all of the cases presented inFigure 7, except for the one with La = 0 and d/dh= 0.15. This is coherent with the results of Mikaelian et al. (2015).
Deformable Bubble without Surfactant. In this subsection, the bubble shape, the bubble drag coefficient, Cd, and the ratio of the bubble velocity to the meanflow velocity, Vb/Jl, are analyzed without surfactants. Accordingly, Ca is varied between 0.01 and 1, with La = 0. The bubble shape is characterized by plotting the (r,z) coordinates of the bubble interface as well as by computing the curvature of its interface: κ = −∇·(∇ϕ/∇ϕ). Results regarding the bubble shape are presented in Figure 8a−c, for d/dh = 0.45, 0.6, and 0.75, respectively. The red (Ca = 0.01 and Re = 0.25), blue (Ca = 0.1 and Re = 1), and green (Ca = 1 and Re = 1) symbols give values of the (r,z) coordinates of the bubble interface. It is observed that the shape of the bubble is nearly spherical for Ca
Figure 8.(first row) Radial position of the interface as a function of z. (second row) Normalized curvature, κd/2, as a function of z. (third row) Dimensionless normal viscous stress on the bubble surface,τnnd/(Vbμc), as a function of z. (fourth row) Dimensionless liquid pressure on the bubble surface, pcd/(Vbμc), as a function of z. The different columns correspond to (first column) d/dh= 0.45, (second column) d/dh= 0.6 and (third column) d/dh= 0.75, respectively. Red dots: Ca = 0.01, blue dots: Ca = 0.1, green dots: Ca = 1. These results have been obtained for a clean interface, that is, La = 0.
= 0.01 and Ca = 0.1, for all values of d/dh. However, when Ca = 1, the bubble is elongated and takes a “bullet shape”. This shape is further characterized in Figure 8d−f, where the curvature,κ, of the gas−liquid interface is plotted as a function of the axial coordinate, z. The curvatureκ is normalized by the curvature of a spherical bubble that has the same volume: 2/d. When Ca = 0.01, the curvature of the bubble is constant and equal to 2/d, regardless of the value of d/dh, as depicted by the red dots in Figure 8d−f. When Ca = 0.1, κ is not constant along the bubble interface. For example, the dimensionless curvature profile shown inFigure 8f for Ca = 0.1 (Re = 1, d/dh = 0.75) exhibits a value larger than one at z≈ 0.5 mm (κd/2 ≈ 1.5) and a value smaller than one at z ≈ 1.5 mm (κd/2 ≈ 0.75). At the front of the bubble,κd/2 is also larger than one and at the back, it is smaller than one. For Ca = 1 (Re = 1, d/dh = 0.75, Figure 8f), the normalized curvature is reduced all along the body of the bubble except near its front and its back. The dimensionless normal viscous stress on the interface, τnnd/(Vbμc), is plotted against the axial coordinate, z, inFigure 8g−i, for d/dh= 0.45, 0.6, and 0.75, respectively. Note that a negative value ofτnnd/(Vbμc) indicates a stress directed from the liquid toward the bubble interface (i.e., “pushing” the interface). On the contrary, a positive value of τnnd/(Vbμc) indicates a normal stress directed from the interface toward the liquid phase (i.e.,“pulling” the interface). It is observed that τnnd/(Vbμc) is below zero near the divergent stagnation circle on the bubble surface on the front half of the bubble. On the contrary,τnnd/(Vbμc) is higher than zero near the convergent stagnation circle on the bubble surface, on the back half of the bubble. Finally, inFigure 8j−l), the periodic component of the dimensionless pressure in the liquid on the interface, pcd/ (Vbμc), is plotted as a function of z. It is observed that−pcand τnn roughly follow the same trends, −pc being significantly smaller thanτnnfor the cases reported here. The normal stress balance at the bubble−liquid interface is written, for moderate values of Re, neglecting the viscosity of the gas phase, in dimensionless form, as p p Ca 1 d c nn b τ κ ̅ − ̅ + ̅ ≈ ̅ (31)
where pd = pdd/(Vbμc) is the periodic component of the dimensionless pressure in the gas on the interface, pc = pcd/ (Vbμc),τnn=τnnd/(Vbμc),κ = κd, and Cab=μcVb/σ0.Equation
31shows that as pdis almost constant, an increase of pcor a decrease ofτnnleads to a decrease ofκ. Reciprocally, a decrease of pcor an increase ofτnnleads to an increase ofκ. This can be observed by comparing Figure 8d,g, e,h, and f,i. The
recirculating flow in between bubbles generates points (or circles) on the bubble surface where the normal viscous stress is locally negative, near the divergent stagnation point (or circle), or positive, near the convergent stagnation point (or circle). Thus, eq 31 shows that as Cab (or similarly Ca) is increased, the inhomogeneous distribution of the normal viscous stress (and pressure) on the bubble surface, generated by the recirculatingflow, causes the curvature of the bubble surface to decrease near the divergent stagnation point (or circle) and to increase near the convergent stagnation point (or circle). This leads to the elongation of the bubble as Ca is increased.
Because of the recirculating flow in between bubbles, the bubble elongates as Ca is increased in contrast to the case of a bubble rising in a stagnant liquid of infinite extent where the bubble is flattened. Thus, the drag coefficient of the bubble based on its equivalent diameter and on the bubble liquid relative velocity, Cd= 4Fd/(1/2(Vb− Jl)2πd2) is expected to be affected by the deformability of the bubble in a particular way. The drag force acting on the bubble, Fd, is computed as presented in the validation section. Cdis plotted inFigure 9a as a function of Ca, for d/dh = 0.15, 0.45, 0.6, and 0.75, respectively. Note that the values of the drag coefficient computed with JADIM are in good agreement with the ones deduced from calculations obtained by Rivero Rodriguez and Scheid (2018). It is observed that, in general, the drag coefficient of the bubble decreases as d/dh decreases. It is observed that Cdis almost constant with respect to Ca when d/ dh< 0.45. However, for larger values of this ratio, Cddecreases when Ca gets larger than 0.1. To understand this effect, the radius of the projection of the bubble on a plane perpendicular to the z axis, rp, is plotted against Ca in a small inset inFigure
9a. As the capillary number is increased from 0.1 to 1, rp decreases from d/2 to less than 0.8d/2. As discussed in the previous paragraph, the recirculatingflow in between bubbles causes the bubble to elongate for Ca ≈ 1. As the bubble elongates, rp decreases leading to the reduction of the drag force acting on the bubble. This partly explains why Cd decreases when Ca is increased, as Cd is defined using the equivalent diameter, d. An alternative drag coefficient can be defined using πrp2as the reference surface: Cd* = Fd/(0.5(Vb− Jl)2πrp2). This alternative drag coefficient is plotted as a function of Ca in Figure 9b. It is observed that Cd and Cd* exhibits the same kind of evolution with respect to Ca, though Cd* is slightly less affected by Ca than Cd. This indicates that the change in the distribution of the pressure and of the normal viscous stress on the bubble surface induced when increasing Ca (seeFigure 8g−l)) is mainly responsible for the
Figure 9.(a) Drag coefficient, Cd= 4Fd/(0.5(Vb− Jl)2πd2), as a function of Ca, for La = 0 and for different values of d/dh. (b) Drag coefficient based on the effective projection area of the bubble on a plane perpendicular to the main flow direction, Cd* = Fd/(0.5(Vb− Jl)2πrp2), as a function of Ca, for La = 0 and for different values of d/dh.
reduction of Cd. Notably, it is shown in the next section that the convergent stagnation circle on the front half of the bubble disappears when Ca is increased beyond Ca≈ 0.5.
Cdis reduced as Ca is increased, especially for values of d/dh > 0.6. Thus, the effect of Ca on Vb/Jl is expected to be significant, especially for values of d/dh> 0.6. InFigure 10, Vb/
Jlis plotted as a function of d/dh, for Ca = 0.01, Ca = 0.1, Ca = 0.5, and Ca = 1. Vb/Jldecreases as d/dhincreases when Ca = 0.01 and Ca = 0.1. However, when Ca = 0.5 or Ca = 1, it is observed that Vb/Jlincreases and takes a value larger than 2 as d/dh is increased. Furthermore, at a constant value of d/dh, increasing Ca leads to an increase of Vb/Jl. For instance, when d/dh = 0.75, Vb/Jl increases from 1.6 to 2.2 when Ca is increased from 10−2to 1.
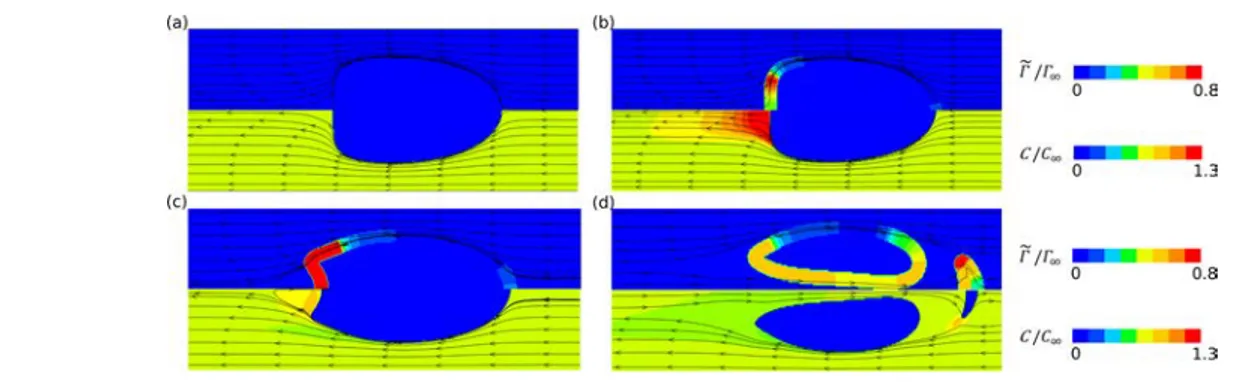
Deformable Bubble with Surfactants. In this sub section, the combined effect of La and Ca on the bubble dynamics is analyzed for d/dh = 0.75. The steady state surfactant concentration on the surface, Γ̃, (presented at the vicinity of the bubble surface only) and in the liquid, C, are presented inFigure 11, for d/dh= 0.75, Re = 1, Ca = 0.5, (a) La = 0, (b) La = 0.1, (c) La = 1, and (d) La = 10. It is observed that the bubble is elongated and that recirculations have disappeared when compared with the cases presented in
Figure 4. As a consequence, only two stagnation points remain on the bubble surface, one at the front of the bubble and one at the back. Surfactants are swept to the back of the bubble and accumulate there, leading to a clean interface on the front half of the bubble. Consequently, surfactants desorb from the
surface at the back of the bubble leading to their accumulation in the liquid adjacent to the back of the bubble. As La is increased from 0.1 to 1, more surfactants are adsorbed on the bubble surface and, consequently, more surfactants accumulate at the back of the bubble. This leads to a slight invagination of the back of the bubble. When La = 10, it appears that the invagination proceeds toward the front of the bubble and finally leads to the bursting of the bubble. Because of the change in theflow structure, the divergent stagnation circle on the bubble surface, where the liquid pressure, pc, and the normal viscous stresses,τnn, were contributing to increase the drag coefficient of the bubble (seeFigure 8), disappears. This might explain the diminution of the drag coefficient Cd* when Ca is increased (seeFigure 9) and the consequent increase in Vb/Jl.
The results presented in Figure 11 show that the deformation of the bubble, when Ca = 0.5, has a strong influence on the structure of the flow near the bubble, when compared with a spherical bubble. This, in turn, has a significant influence on the distribution of the surfactants on the surface of the bubble. To give more insights into this,Γ̃/ Γ∞is plotted as a function of the axial coordinate, z, with z = 0 at the back of the bubble, in thefirst column ofFigure 12, for Ca = 0.04 (first row), Ca = 0.1 (second row), and Ca = 0.5 (third row), for d/dh= 0.75 and for different values of La. For Ca = 0.04, the bubble is almost spherical, and as mentioned previously, it is observed that the surfactants accumulate near the convergent stagnation point/circle on the bubble surface and are depleted near the divergent stagnation point/circle. When Ca is equal to 0.1, a similar distribution of the surfactants on the surface of the bubble is observed, but with steeper gradients. Finally, when Ca is equal to 0.5, it is observed that the surfactants are totally swept to the back of the bubble.
Increasing Ca induces a change in theflow field around the bubble and a consequent change in the surfactant distribution on the bubble surface. Thus, it might be expected that the tangent shear stress distribution on the bubble surface, τntd/ (Vbμc), is also strongly affected by an increase of Ca. On the second column of Figure 12, τntd/(Vbμc) is presented as a function of the axial coordinate, z, for different values of Ca and La. As Ca increases from 0.04 to 0.1, the surfactant concentration decreases near the divergent stagnation circle on the front part of the bubble side, causing a decrease of the shear stress at that location, for La = 1 and La = 10. As Ca is increased further, all of the surfactants accumulate at the back
Figure 10.Vb/Jlas a function of d/dh, for Ca = 0.01, Ca = 0.1, Ca = 0.5, and Ca = 1 depicted by squares, triangles, stars, and circles, respectively. There is no surfactant in the system. The blue solid line is the correlation established numerically by Mikaelian et al. (2015), predicting the value of Vb/Jlfor a bubble having a clean surface.
Figure 11.Contour plots of the surfactant concentrationfield, Γ̃, (upper part) and the bulk surfactant concentration field, C (lower part), for Ca = 0.5, d/dh= 0.75 and (a) La = 0, (b) La = 0.1, (c) La = 1, and (d) La = 10. Velocity streamlines are drawn in a reference frame translating with the bubble velocity. The bubbles move from left to right. Note that the bubble sketched in (d) has burst and might not have reached its terminal shape.
of the bubble leading to a clean surface on the most part of the bubble, except at the back.
The tangent shear stress distribution on the bubble surface is expected to affect the interface velocity. On the third column ofFigure 12, Vs/Vbis presented as a function of z, for different values of Ca and La. It is observed that, in general, increasing La leads to the reduction of Vs/Vb. It is reduced at locations where the shear stress on the bubble surface is high. For example, the shear stress profile observed for Ca = 0.04 and La = 0.1 (black dots inFigure 12b) exhibits a peak at z≈ 0.5 mm, where the concentration profile of surfactants exhibits an important gradient (black dots inFigure 12a). The influence of La on Vs/Vb is reduced for Ca = 0.5 (see Figure 12i). As mentioned previously, as Ca is increased, surfactants are swept
to the back of the bubble and consequently have a smaller influence on Vs/Vb.
The drag coefficient of the bubble, Cd = 4Fd/(0.5ρc(Vb− Jl)2πd2), is also expected to be less influenced by the presence of surfactants when Ca is increased. The effect of Ca and La on the drag coefficient of the bubble is analyzed in Figure 13a, where Cdis plotted as a function of Ca for several values of La and for d/dh = 0.75. It is observed that, in general, the drag coefficient of the bubble increases with La. As it might have been expected, when Ca is larger than approximately 0.5, the drag coefficient of the bubble becomes almost independent of La. As for Cd, Vb/Jlbecomes also independent of La when Ca is larger than 0.5, as it can be observed inFigure 13b.
Figure 12.(first column) Surfactant concentration on the surface of the bubble, Γ̃/Γ∞, (second column) viscous shear stress along the tangent to the bubble surface,τntd/(Vbμc), and (third column) ratio of the liquid velocity tangent to the bubble surface to the bubble velocity, Vs/Vb. (first line) Ca = 0.04, (second line) Ca = 0.1 and (third line) Ca = 0.5.
Figure 13.(a) Drag coefficient as a function of Ca for d/dh= 0.75 and different values of La. (b) Vb/Jlas a function of Ca for d/dh= 0.75 and different values of La.
The bubble velocity and the drag coefficient becomes independent of La as Ca reaches values close to unity, for d/dh = 0.75. At this point, surfactants accumulate at the back of the bubble and reduce locally the surface tension of the gas−liquid interface. This causes the back of the bubble to deform, as illustrated inFigure 11b. Increasing La further causes the back of the bubble to invaginate. This can even cause the bubble to burst, as presented in Figure 14. This unsteady bursting
phenomenon reported in Figure 14 was also observed in previous experimental and numerical studies that considered the effect of viscosity ratio (λ) on the shape and bursting behavior of drops.43,44
In the previous section,eq 31was used to discuss the change in bubble shape with Ca. The same equation can be used to discuss the effect of La on the bubble shape. As seen in the previous paragraph, as Ca reaches values close to 0.5, surfactants are swept to the back of the bubble and consequently reduce locally the surface tension of the gas− liquid interface. Ifeq 31is evaluated at the back of a bubble (a bubble such as the one inFigure 11a,b or c), with κ ≈ 2/rc, where rcis the radius of curvature of the back of the bubble, an expression of rccan obtained
r d p p Ca 2 ( ) c d c nn b 0 τ = ̅ − ̅ + ̅ σσ (32)
In contrast to eq 31, the presence of the surfactant is considered, and consequently, the effective surface tension of the gas−liquid interface appears in eq 32. The periodic component of the pressure inside the gas can be estimated as pd= 4σ/d. In the dimensionless form, it gives pd= 4/(Cabσ0/ σ). Thus,eq 32yields r d p Ca 2 4 ( ) c c nn b 0 τ = + − ̅ + ̅ σσ (33)
It should be noted that when Cab → 0, the bubble is spherical and rc= d/2 is recovered fromeq 33. At the back of the bubble,−pc+τnnis negative (seeFigure 8). Thus, as Cab increases, the normal stresses at the back of the bubble cause rc to increase, and consequently the back of the bubbleflattens. As it is increased further, rcmight change sign if|(−pc+τnn) Cabσ0/σ| > 4. This causes the back of the bubble to invaginate. As it can be seen ineq 33, the same effect can be caused by surfactants accumulating at the back of the bubble because the presence of surfactants increasesσ0/σ.Equation 33also shows that the increase of Cab and/or σ0/σ can lead to the bubble bursting if rc approaches negative values close to zero. In
Figure 15, rcis plotted as a function of Ca, forσ/σ0= 0 and 0.5.
In this figure, −pc + τnn is imposed to −3. −pc + τnn = −3 characterizes the normal viscous stresses at the back of a bubble with d/dh = 0.75 and Ca = 0.01 and 0.1 (seeFigure
8i,l). The blue and red vertical lines depict the critical value of Ca from which the back of the bubble begins to invaginate. In
Figure 15, it is visible that increasing Ca causes the back of the bubble toflatten and to invaginate. If there are surfactants in the system, 0 <σ0/σ < 1. The case of σ/σ0= 0.5 is presented in
Figure 15. In this case, for Ca → 1, rc approaches 0 (being negative) indicating a bubble with a severe invagination on its back. In this case, the bubble probably bursts.
As an example, a diagram presenting the different regimes obtained in the simulations for d/dh = 0.75 is presented in
Figure 16. In this plot, three distinct regions can be identified,
corresponding to classical bubble motion with Vb/Jl < 2, bubble with velocity larger than the maximum velocity in the liquid, that is, Vb/Jl> 2, and unstable bubble, leading to burst. Thisfigure illustrates a transition between a bursting bubble and a stable bubble (red solid line inFigure 16). As it can be observed, this transition depends upon the bubble deform ability (i.e., upon Ca), and surfactants (i.e., upon La). This transition might also depend on other nondimensional numbers characterizing the surfactants. However a complete parametric study is beyond the scope of this paper.
■
CONCLUSIONWe performed a numerical study to investigate the effect of soluble surfactants and deformability on the dynamics of a small bubble translating in a horizontal microchannel of circular cross section. We use an LS method to capture the gas−liquid interface. The capillary pressure jump and the
Figure 14.Contours of the bubble at different time for La = 10, d/dh = 0.75, and Ca = 0.5.
Figure 15.rc as a function of Ca for different values of σ/σ0. The dashed vertical lines depict vertical asymptotes.
Figure 16.Bubble stability diagram for d/dh= 0.75. Black, blue, and red symbols represent a simulation where Vb/Jl< 2, Vb/Jl> 2, and the bubble bursts, respectively.
Marangoni stress are computed using the CSF mode!. The transport of surfactants on the bubble surface is dealt in an Eulerian framework and is coupled to its transport in the
liquid.
ln line with previous studies, we observed that when the bubble is spherical, the liquid recirculates in between bubbles. As a consequence, surfactants accumulate on convergent stagnation point/ circle on the bubble surface and deplete on divergent stagnation point/circle. For a Langmuir number larger than 1, this causes the bubble interface to get almost immobilized in between convergent and divergent stagnation points/circles (in a reference frame attached to the bubble) because of Marangoni stresses induced by surface tension gradients; regarding its velocity relative to the liquid, the
bubble behaves as a solid sphere when La > I. The ratio of the
bubble velocity to the mean flow velocity decreases as the ratio of the bubble diameter to the tube diameter increases. Furthermore, when the bubble is spherical, it is shown that surfactants can increase the drag coefficient of the bubble by a factor of 2.
When the bubble is allowed to deform, that is, when the capillary number is of order of unity, the curvature of its interface is reduced near the divergent stagnation circle on the front part of the bubble side, where the viscous stress normal to the bubble surface is high. This is due to the recirculating flow, which "hits" the bubble at this location, and locally increases this stress. Consequently, it reduces the curvature of the bubble interface. Therefore, the bubble elongates as Ca is increased. As the bubble elongates, it is shown that its drag coefficient decreases due to the modification of the flow structure around the bubble. Consequently, the ratio of its velocity to the mean liquid velocity, Vb/]1, increases and can be
larger than 2. For d/d
h = 0.75, if Ca becomes larger than approximately 0.5, recirculations in between bubbles disappear and surfactants are swept toward the back of the bubble. They have Jess influence on the drag coefficient of the bubble and on its velocity than for a spherical bubble. Increasing the amount of surfactant adsorbing to the bubble surface can eventually cause the back of the bubble to invaginate and possibly the bubble to burst
• AUTHOR IN FORMATION
Corresponding Authors
*Email: oatasi@)ulb.ac.be (O.A).
*Email: dominique.legendre@)imft.fr (D.L.).
ORCID�
O. Atasi: 0000 0003 4957 3996
• ACKNOWLEDGMENTS
Sorne of the computational time was provided by the Scientific Groupment CALMIP (project no. Pl7006), the contribution of which is greatly appreciated. We are grateful to Javier Rivero rodriguez for useful discussions. O.A and B.S. thank the F.R.S FNRS for the financial support. O.A thanks the "Jaumotte-Demoulin" and "David et Alice Van Buuren" funds for partly founding this project.
• REFERENCES
(1) Han, Y.; Liu, Y.; Li, M.; Huang,}. A review of development of micro channel heat exchanger applied in air conditioning system.
Energy Procedia 2012, 14, 148-153.
(2) Kashid, M . N.; Renk.en, A; Kiwi Minsker, L. Gas liquid and liquid liquid mass transfer in microstructured reactors. Chem. Eng. Sei.
2011, 66, 3876-3897.
(3) Hassanvand, A; Hashemabadi, S. H. Direct numerical simulation of mass transfer from Taylor bubble flow through a circular capillary.
Int.
J.
Heat Mass Transfer 2012, 55, 5959-5971.(4) Abiev, R S. Bubbles velocity, Taylor circulation rate and mass transfer mode! for slug flow in milli and microchannels. Chem. Eng.
J.
2013, 227, 66-79.
(5) Abadie, T.; Aubin,
J.;
Legendre, D.; Xuereb, C. Hydrodynamics of gas liquid Taylor flow in rectangular microchannels. Microfluid. Nanofluid. 2012, 12, 35 5-369.( 6) Gupta, R; Fletcher, D. F.; Haynes, B. S. CFD modelling of flow and heat transfer in the Taylor flow regïme. Chem. Eng. Sei. 2010, 65,
2094-2107.
(7) Yu, Z.; Hemminger, O.; Fan, L. S. Experiment and lattice Boltzmann simulation of two phase gas liquid flows in microchannels.
Chem. Eng, Sei. 2007, 62, 7172-7183.
(8) Cubaud, T.; Sauzade, M.; Sun, R CO2 dissolution in water using long serpentine microchannels. Biomicrofluidics 2012, 6, 022002.
(9) Feng, J. Q Steady axisymmetric motion of a small bubble in a tube with flowing liquid. Proc.: Math, Phys. Eng. Sei. 2010, 466, 549-562.
(10) Khodaparast, S.; Magnini, M.; Borhani, N.; Thome, J. R Dynamics of isolated confined air bubbles in liquid fiows through circular microchannels: an experimental and numerical study.
Microfluid. Nanojluid. 2015, 19, 209-234.
(ll) Kurimoto, R; Hayashi, K; Tomiyama, A Terminal velocities of clean and fully contaminated drops in vertical pipes. Int.
J.
MultiphaseFlow 2013, 49, 8-23.
( 12) Stan, C. A; G uglielmini, L.; Ellerbee, A K; Caviezel, D.; Stone, H. A; Whitesides, G. M. Sheathless hydrodynamic positioning of buoyant drops and bubbles inside microchannels. Phys. Rev. E: Stat, Nonli near, Soft Matter Phys. 2011, 84, 036302.
(13) Fdhila, RB.; Duineveld, P.C. The effect of surfactant on the rise of a spherical bubble at high Reynolds and Peclet numbers. Phys.
Fluids 1996, 8, 310-321.
(14) Cuenot, B.; Magnaudet,
J.;
Spennato, B. The effects of slightly soluble surfactants on the fiow around a spherical bubble.J.
Fluid Mech. 1997, 339, 25-53.(15) Tasoglu, S.; Demirci, U.; Muradoglu, M. The effect of soluble surfactant on the transient motion of a buoyancy driven bubble. Phys. Fluids 2008, 20, 040805.
(16) Takagi, S.; Ogasawara, T.; Fukuta, M.; Matsumoto, Y.
Surfactant effect on the bubble motions and bubbly flow structures in a vertical channel . Fluid Dyn. Res. 2009, 41, 065003.
(17) Fukuta, M.; Takagi, S.; Matsumoto, Y. Numerical study on the shear induced lift force acting on a spherical bubble in aqueous surfactant solutions. Phys. Fluids 2008, 20, 040704.
(18) Baret, J. C.; Kleinschmidt, F.; El Harrak, A; Griffiths, A D.
Kinetic Aspects of Emulsion Stabilization by Surfactants: A Micro Huidic Analysis. Langmuir 2009, 25, 6088-6093.
(19) Riaud, A; Zhang, H.; Wang, X; Wang, K.; Luo, G. Numerical Study of Surfactant Dynamics during Emulsification in a T Junction Microchannel. Langmuir 2018, 34, 4980-4990.