is an open access repository that collects the work of Arts et Métiers Institute of
Technology researchers and makes it freely available over the web where possible.
This is an author-deposited version published in: https://sam.ensam.eu
Handle ID: .http://hdl.handle.net/10985/17155
To cite this version :
Zixin YANG, Wafa SKALLI, Claudio VERGARI, Elsa ANGELINI, Laurent GAJNY - Automated Spinal Midline Delineation on Biplanar X-Rays Using Mask R-CNN - In: VipImage 2019, Portugal, 2019-10 - VipIMAGE 2019. Lecture Notes in Computational Vision and Biomechanics - 2019
Any correspondence concerning this service should be sent to the repository Administrator : [email protected]
This is a pre-copyedited version of a contribution published in: Tavares J., Natal Jorge R. (eds) VipIMAGE 2019. VipIMAGE 2019. Lecture Notes in Computational Vision and Biomechanics, vol 34. Springer, Cham. The definitive authentic version is available online via: https://doi.org/10.1007/978-3-030-32040-9_32
Automated spinal midline delineation on
biplanar X-rays using Mask R-CNN
Zixin Yang1, Wafa Skalli1, Claudio Vergari1, Elsa D. Angelini2,3, Laurent
Gajny1
1 Institut de Biomécanique Humaine Georges Charpak, Arts et Métiers, Institute of
Technology, 151 boulevard de l’Hôpital, 75013 Paris, France;
2 LTCI, Telecom ParisTech, Department Image-Data-Signal, Paris, France;
3 ITMAT Data Science Group, NIHR Imperial BRC, Imperial College London, London, UK
Abstract: Manually annotating medical images with few landmarks to initialize 3D
shape models is a common practice. For instance, when reconstructing the 3D spine from biplanar X-rays, the spinal midline, passing through vertebrae body centers (VBCs) and endplate midpoints, is required. This paper presents an automated spi-nal midline delineation method on frontal and sagittal views by using Mask R-CNN. The network detects all vertebrae from C7 to L5, followed by vertebrae segmenta-tion and classificasegmenta-tion at the same time. After postprocessing to discard outliers, the vertebrae mask centers were regarded as VBCs to get the spine midline by polyno-mial fitting. Evaluation of the spinal midline on 136 images used root mean square error (RMSE) with respect to manual ground-truth. The RMSE ± standard error values of predicted spinal midlines (C7-L5) were 1.11 mm ± 0.67 mm on frontal views and 1.92mm ± 1.38 mm on sagittal views. The proposed method is capable of delineating spinal midlines on patients with different spine deformity degrees.
Keyword biplanar x-rays, spine 3D reconstruction, Mask R-CNN, spinal
mid-line
Introduction
Scoliosis such as adolescent idiopathic scoliosis (AIS) is a three-dimensional (3D) local and global deformation of the spine. Clinical parameters, like the Cobb angle and vertebrae axial rotation, are essential both for diagnosis [1], treatment planning [2] and decision follow up [7].
The EOS system (EOS Imaging, Paris, France) allows diagnosing scoliosis, by taking radiographs in frontal and sagittal views in standing position in order to per-form 3D reconstruction. In comparison with computerized tomography (CT) and magnetic resonance imaging (MRI), it has advantages in terms of low radiation dose and accurate deformity assessment in standing position [3, 4, 5]. Semi-automatic
3D reconstruction methods have been introduced and, for instance, the method in [6] is used in daily routine to measure clinical parameters. However, it requires su-pervision and training to adjust anatomical features of a parametric statistical shape model. Vertebral occlusions, due to projections of soft tissues, organs, braces, air cavities and other bones, lead to additional manual adjustments (meantime over 12 mins [7]), which limits their use in the clinical workflow.
Recently, research works have aimed to automated 3D spine reconstruction [8, 9, 10, 11]. In general, the first step is to initialize a simplified statistical shape model [6] thanks to several landmarks such as the spinal midline, passing through end-plates or vertebral body centers. In [8], they use manual inputs while in [9] they rely on a fully convolutional neural network (CNN) combined with an additional differ-entiable spatial to numerical (DSNT) layer to predict the locations of landmarks. In [11], a coarse localization based on the image intensity distribution of columns and rows is used, followed by a detailed statistical shape model (SSM) for landmarks position prediction and CNN patch-based regression models to correct the land-marks.
In this work, contributing to automatic statistical shape model initialization, we present a method to delineate the spinal midline from vertebra C7 to vertebra L5 from both sagittal and frontal views. The method uses Mask R-CNN [14, 15] to segment and identify vertebrae. A post-processing method is introduced to remove outliers. Mask centers are regarded as vertebrae centers and polynomial fitting is applied to get the spinal midline.
Materials and Methods
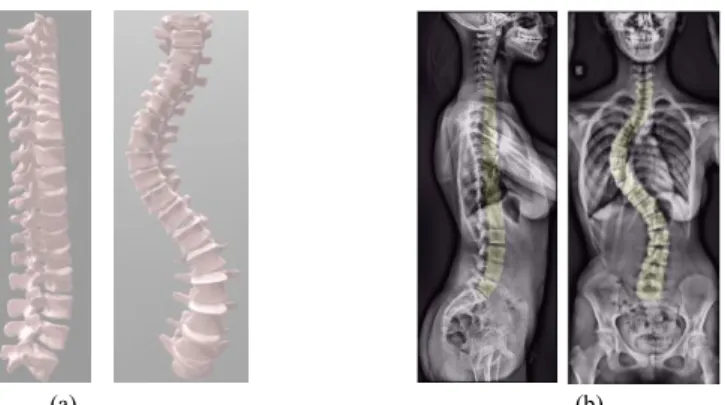
DatabaseA database of 136 biplanar X-rays of 92 asymptomatic subjects and 44 scoliotic patients (Cobb Angle = 34.7° ± 19.9°) has been collected retrospectively. Every subject underwent the EOS™ ultra-low dose system (EOS imaging, Paris, France) under a protocol validated by the Ethical Committee (C.P.P. Ile de France VI). 3D reconstructions were performed by trained experts using the method from [6] for T1-L5 and from [16] for cervical spine reconstruction (C3–C7). Vertebral bodies from digitally reconstructed spines were backprojected on frontal and sagittal views (Figure 1). Vertebrae masks from these projections were regarded as our manual ground-truth references.
Pre-processing
Images from sagittal and frontal views were automatically cropped based on the backprojected vertebral bodies to only contain vertebrae from C7 to L5, and resized
3
to 512×216 pixels. In the resizing process, original ratios were preserved. Both im-ages were preprocessed by adaptive noise-removal filtering, median filtering and contrast-limited adaptive histogram equalization to decrease noise and enhance con-trast [19]. Each pair of planar radiographs were combined into a single image with a fixed size of 512×512 pixels, in which the left half consisted of the sagittal pro-jection whereas the right half included the frontal propro-jection (Figure 2 a).
(a) (b)
Figure 1: Ground-truth generation: (a) A digitally reconstructed 3D spine; (b) Backprojections of
vertebrae bodies on sagittal and frontal view images.
Mask R-CNN
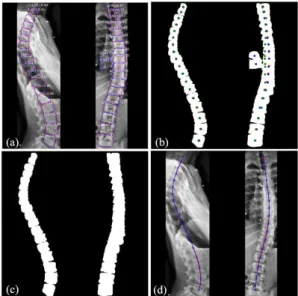
Figure 2: Inputs and outputs of Mask R-CNN: (a) Input image; (b) Input training labels with
ver-tebrae bounding boxes, masks and class labels. (c) Output predicted bounding boxes, masks, class labels and scores. On the sagittal view, vertebrae were divided into C7, T1-L4, and L5. On the frontal view, vertebrae were divided into C7, T1, T2-L4 and L5.
Mask R-CNN [13] was chosen in this work to perform the spinal midline delinea-tion. It is a two-stage detector that here localizes vertebrae firstly by predicting bounding boxes containing objects of interest, followed by joint segmentation and class labeling in the second stage. Mask R-CNN was proposed in 2017 as an exten-sion of Faster R-CNN [21] for semantic segmentation. This was achieved by adding
a branch to the network for predicting segmentation masks on region of interests. The loss function for training this network was :
𝐿 = 𝐿𝑐𝑙𝑠+ 𝐿𝑏𝑜𝑥+ 𝐿𝑚𝑎𝑠𝑘 (1)
This is a multi-task loss function combining the loss of classification (𝐿𝑐𝑙𝑠),
lo-calization (𝐿𝑏𝑜𝑥) and segmentation mask (𝐿𝑚𝑎𝑠𝑘). We have used Mask R-CNN
based on the implementation by Matterport Inc. [14] released under an MIT Li-cense.
Some classes needed to be defined. C7, L5 from sagittal view, and C7, T1, L5 from frontal view were assigned to individual classes. On the sagittal view, verte-brae in T1-L4 (16 verteverte-brae) were assigned to the same class. On the frontal view, T2-L4 (15 vertebrae) were assigned to the same class. In total, in both views, 18 vertebrae had to be detected, segmented and classified into 7 classes (Figure 2 b). The data was split for 5-fold cross-validation without overlap for training and test-ing with a ratio of 4:1. Augmentation techniques included randomized rotations ±3 degrees and contrast normalization [20] to generalize unseen data. Mask R-CNN predicted vertebrae bounding boxes and masks with their class names and class probability scores (Figure 2 c)
Post-processing and Evaluation
Figure 3: Post-processing workflow. (a) Select predicted masks with class scores above 0.65. Ground
truth contours (red) and predicted contours (blue) are shown. (b) Ground truth mask centers are in red and predicted mask centers are in blue. Each predicted mask center has a corresponding point (green) predicted by the polynomial fit of predicted masks. (c) After removal of predicted masks with a horizontal distance between its blue and green points above 15 pixels. (d) Final spinal midlines fitted by a 6th-order polynomial function. Ground truth in red and predicted in blue.
5
Firstly, we discarded sagittal masks and frontal masks whose class scores were below 0.65 (Figure 3a). Secondly, for each view, each mask center (𝑥𝑐, 𝑦𝑐) was
cal-culated. On each view, predicted masks were fitted by a sixth order polynomial function:
𝑋𝑚= 𝑓𝑚(𝑌𝑚),
where (𝑋𝑚, 𝑌𝑚) represents locations of all pixels within the 𝑚th predicted mask.
New horizontal locations of each mask centers 𝑥𝑐′ were calculated by 𝑥𝑐′= 𝑓𝑚(𝑦𝑐)
(green points in Figure 3b). Then, the horizontal distance 𝑑 was calculated as 𝑑 = |𝑥𝑐′− 𝑥𝑐|. Masks were discarded if 𝑑 > 15 𝑝𝑖𝑥𝑒𝑙𝑠 (Figure 3c). Finally, remaining
masks centers were fitted on each view by another sixth order polynomial function to obtain the final spinal midline on frontal and sagittal views from C7 to L5 (Figure 3d).
The segmentation performance was evaluated with the Dice similarity coeffi-cient [16]. To evaluate the identification task, we defined correct detection when a vertebra was assigned the right class name and when its Dice value was above 0.5. Based on this definition, the precision and accuracy for identification were calcu-lated. The first one calculated the percentage of correct predictions among all pre-dictions while the later one calculated the percentage of ground-truth vertebrae that were correctly detected.
We used root mean square error (RMSE) to evaluate the distance between the predicted and ground-truth spinal midlines:
𝑅𝑀𝑆𝐸(𝑝𝑖𝑥𝑒𝑙) = √1 𝑁∑(𝑅𝑒𝑓𝑖− 𝑃𝑟𝑒𝑑𝑖) 2 𝑁 𝑖=1 ∗ 𝑟𝑎𝑡𝑖𝑜𝑟𝑒𝑠𝑖𝑧𝑒∗ 𝑟𝑎𝑡𝑖𝑜𝑚𝑚 (2)
We sampled 𝑁 = 170 points from the ground-truth spinal midline between the C7 and the L5 body centers. 𝑅𝑒𝑓 stands for the horizontal locations of sampled ground-truth points. (𝑃𝑟𝑒𝑑) stands for the horizontal locations of the predicted points at the same vertical locations. RMSE values were transformed into millimeter by adjusting for the resize ratio 𝑟𝑎𝑡𝑖𝑜𝑟𝑒𝑠𝑖𝑧𝑒 and multiplying by the pixel to physical
size (mm) ratio 𝑟𝑎𝑡𝑖𝑜𝑚𝑚.
Similarly, we used Eq.2 to evaluate the spinal midline RMSE in sub-regions (e.g.T1-T4) after truncating all midline (C7-L5).
Experimental Results
The experiments were performed on a PC with Intel Core i7 2.8 GHz CPU, 16 GB memory, and NVIDIA GeForce GTX 1050 GPU, based on Python. We used Res-Net101 as the backbone architecture.
Segmentation and identification evaluation
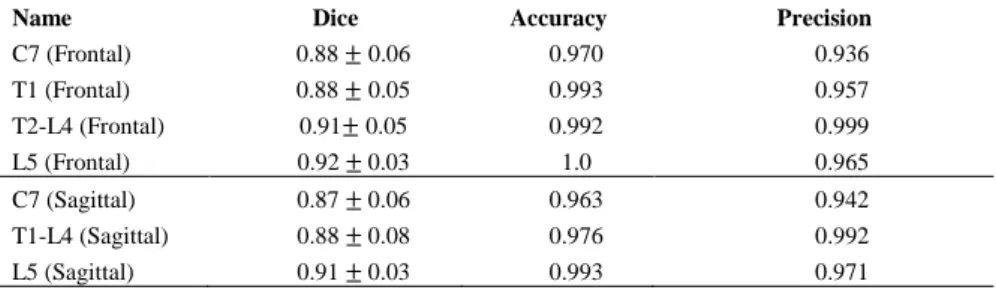
We report segmentation and identification performances in Table 1. Vertebrae L5 has the highest average Dice scores: 0.92 in frontal view and 0.91 in sagittal view. Accuracy (the percentage of detected vertebrae) and precision (the percentage of correct predictions among all predictions) of vertebrae C7 had lower value than other classes in both views.
Table 1: Dice similarity coefficient: mean ± SD. Identification: accuracy and precision.
Name Dice Accuracy Precision
C7 (Frontal) 0.88 ± 0.06 0.970 0.936 T1 (Frontal) 0.88 ± 0.05 0.993 0.957 T2-L4 (Frontal) 0.91± 0.05 0.992 0.999 L5 (Frontal) 0.92 ± 0.03 1.0 0.965 C7 (Sagittal) 0.87 ± 0.06 0.963 0.942 T1-L4 (Sagittal) 0.88 ± 0.08 0.976 0.992 L5 (Sagittal) 0.91 ± 0.03 0.993 0.971
Spinal midline evaluation
Table 2: RMSE (mm) on frontal views: mean ± SD (Max) for vertebrae body centers location
and spinal midline delineation from 136 subjects. Number (%) of subjects with RMSE>3mm.
Frontal RMSE (mm) >3 mm C7 1.55 ± 1.23 (6.52) 18 (13.2%) T1-T4 1.18 ± 1.31 (9.42) 10 (7.35%) T5-T8 0.87 ± 0.85 (4.27) 5 (3.68%) T9-T12 0.70 ± 0.78 (7.45) 2 (1.47%) L1-L4 0.90 ± 0.66 (4.23) 2 (1.47%) L5 1.41 ± 1.24 (8.84) 10 (7.35%) All 1.11 ± 0.67 (5.02) 3 (2.21%)
Table 3: RMSE (mm) on sagittal views: mean ± SD (Max) for vertebrae body centers location
and spinal mid-line delineation from 136 subjects. Number (%) of subjects with RMSE>3mm.
Sagittal RMSE (mm) >3 mm C7 1.91 ± 4.82 (36.05) 14 (10.29%) T1-T4 2.60 ± 2.36 (13.99) 39 (28.68%) T5-T8 1.58 ± 1.42 (13.90) 9 (6.62%) T9-T12 1.40 ± 1.79 (13.04) 14 (10.29%) L1-L4 1.02 ± 0.79(13.04) 5 (3.68%) L5 1.33 ± 1.94 (20) 9 (6.62%) All 1.92 ± 1.38(9.44) 16 (11.76%)
7
Table 2 reports RMSE (mm) values from the frontal views and Table 3 from the sagittal views. On the frontal views, we got an average RMSE of 1.11 mm and 0.67 mm standard error in the C7-L5 region. T5-T8, T9-T12 and L1-L5 on frontal views have lower RMSE than other regions. In comparison, spinal midline delineation of C7-L5 on sagittal views (Table 3) had larger errors than on frontal views, with an average RMSE of 1.92 mm and a standard error of 1.38 mm. In T1-T4 sagittal views, 39 subjects (28.68%) had RMSE values above 3 mm, which is almost four times the proportion seen in frontal views.
Discussion
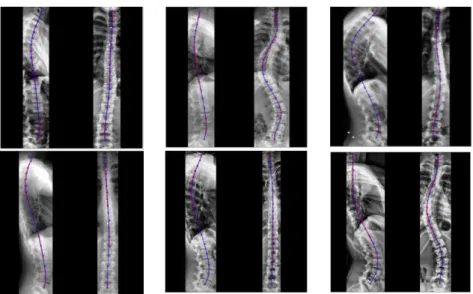
Figure 4: Spinal midline delineation examples. Ground-truth in red, prediction in blue.
Results showed that the proposed method was capable of automatically deline-ating spinal midline from vertebrae C7 to L5 on X-rays radiographs from frontal and sagittal views acquired on either asymptomatic or scoliosis subjects (Figure 4).
In the method, although reconstructions from C3 to L5 were available, we chose to detect vertebrae from C7-L5 within seven classes: C7, T1-L4 (16 vertebrae), L5 from sagittal view, and C7, T1, T2-L4 (15 vertebrae), L5 from frontal views. This decision was based on properties of the spine projections on biplanar X-rays and the mechanism of Mask R-CNN. On the frontal views, we chose C7 as the starting vertebra for the spinal midline because vertebrae C3-C6 are likely to be occluded by patients’ head. Our preliminary experiments confirmed that the network was un-able to combine correctly spatial location information from vertebrae in C3-C6. Due to similar appearances, vertebrae T2-L4 were likely to also be wrongly classified but ended up being correctly segmented. Quite distinct from T2-L4, vertebrae C7, vertebrae T1 and vertebrae L5 were correctly segmented and identified as individual
classes. In sagittal views, T1-T4 are commonly occluded, as confirmed by the high T1-T4 RMSE value in Table 3. For this reason, we did not separate T1 as an indi-vidual class on the sagittal view. C3-C6 are clearly visible on sagittal views, but we did not study them in this work, keeping the same field of view on the two views. In our experiments, increasing the field of view had negative impacts on the outputs. Mean Dice values of each class, all above 0.87, compare well with [18] where they studied only frontal views using a smaller dataset (35 images). Our mean RMSE (SD) 1.11 mm ± 0.67 mm on frontal views and 1.92mm ± 1.38 mm on sag-ittal views are also comparable with the reconstruction results in [11], with 1.6 (1.3) mm for mean 3D Euclidean distance (SD) errors of VBC landmark locations.
Performances of our method was inevitably influenced by vertebral occlusion, especially in the thoracic region on sagittal views. In our dataset, we had many im-ages with strong occlusions. Overlay projections of the shoulder, ribcim-ages and hands contributed to the high RMSE errors in T1-T4 (sagittal views), shown in Table 2. As the vertebra C7 was likely occluded by the patient’s head in frontal view and the shoulder in sagittal views, it has relative high errors in Table 2. Signals from organs, local tissues and air cavities were sometimes mistaken for vertebrae.
From visual examination, spinal midlines with RMSE< 3mm will not likely cause any problem for the statistical shape model initialization. Overall, on frontal views, only 2.21% of spinal midlines with RMSE> 3mm might need minor correc-tions. Influenced by vertebrae occlusion on the T1-T4 sagittal views, 11.76% of spinal midlines had RMSE values above 3mm. However, the errors obtained on T1-T4 spinal midline on sagittal view could be decreased by regressing a statistical shape model in which greater weights would be assigned to the most reliable spinal midline segments.
Recent papers exploiting convolutional networks can be divided in two catego-ries. The first category predicts spinal landmarks [9, 17] or segments vertebrae [18] to measure directly some clinical parameters, mainly the Cobb angle, on landmarks or masks. The second category predicts landmarks and uses them to initialize a sta-tistical shape model [11]. This enables full spine reconstruction, and the evaluation of more clinical parameters. In [18], vertebrae were localized using a series of tra-ditional imaging processing steps. However, the processing steps were tuned on a specific dataset, thus prone to failure on other cohorts. In comparison, the proposed method using Mask R-CNN has demonstrated great robustness and is one of the most popular architecture for segmentation in computer vision. We exploited its potential in vertebrae identification and segmentation on biplanar X-rays in frontal and sagittal views. The main difficulty of applying the network to biplanar X-rays was the presence of outliers which were successfully removed by the post-pro-cessing method.
9
Conclusion
We presented an automated spinal midline delineation method on biplanar X-rays images using a Mask R-CNN. The results suggested that we can obtain robust and accurate spinal midlines from C7 to L5, especially in frontal views. The spinal midlines in sagittal views were less accurate due to occlusions by the shoulder and ribcage. The method should contribute to the automated initialization of a statistical shape model, the first step in current spine reconstruction methods. Future works will focus on the detection of additional landmarks that are required for the accurate adjustment of a 3D spine model on biplanar X-rays images.
Acknowledgments
The authors thank the ParisTech BiomecAM chair program, on subject-specific musculoskeletal modelling and in particular Société Générale and COVEA. The authors would also like to thank François Girinon for having initiated this work.
References
[1] Skalli, W., Vergari, C., Ebermeyer, E., Courtois, I., Drevelle, X., Kohler, R., ... & Dubous-set, J. (2017). Early detection of progressive adolescent idiopathic scoliosis: a severity index. Spine, 42(11), 823-830.
[2] Vergari, C., Courtois, I., Ebermeyer, E., Bouloussa, H., Vialle, R., & Skalli, W. (2016). Experimental validation of a patient-specific model of orthotic action in adolescent idio-pathic scoliosis. European Spine Journal, 25(10), 3049-3055.
[3] Brenner, D. J., & Hall, E. J. (2007). Computed tomography—an increasing source of radia-tion exposure. New England Journal of Medicine, 357(22), 2277-2284.
[4] Yazici, M., Acaroglu, E. R., Alanay, A., Deviren, V., Cila, A., & Surat, A. (2001). Meas-urement of vertebral rotation in standing versus supine position in adolescent idiopathic sco-liosis. Journal of Pediatric Orthopaedics, 21(2), 252-256.
[5] Dubousset, J., Charpak, G., Dorion, I., Skalli, W., Lavaste, F., Deguise, J., ... & Ferey, S. (2005). A new 2D and 3D imaging approach to musculoskeletal physiology and pathology with low-dose radiation and the standing position: the EOS system. Bulletin de l'Academie nationale de medecine, 189(2), 287-297.
[6] Humbert, L., De Guise, J. A., Aubert, B., Godbout, B., & Skalli, W. (2009). 3D reconstruc-tion of the spine from biplanar X-rays using parametric models based on transversal and longitudinal inferences. Medical Engineering & Physics, 31(6), 681-687.
[7] Ilharreborde, B., Steffen, J. S., Nectoux, E., Vital, J. M., Mazda, K., Skalli, W., & Obeid, I. (2011). Angle measurement reproducibility using EOS three-dimensional reconstructions in adolescent idiopathic scoliosis treated by posterior instrumentation. Spine, 36(20), E1306-E1313.
[8] Gajny, L., Ebrahimi, S., Vergari, C., Angelini, E., & Skalli, W. (2019). Quasi-automatic 3D reconstruction of the full spine from low dose biplanar X-rays based on statistical inferences and image analysis. European Spine Journal, 28(4), 658-664.
[9] Galbusera, F., Niemeyer, F., Wilke, H. J., Bassani, T., Casaroli, G., Anania, C., ... & Sconfienza, L. M. (2019). Fully automated radiological analysis of spinal disorders and de-formities: a deep learning approach. European Spine Journal, 1-10.
[10] Vergari, C., Courtois, I., Ebermeyer, E., Bouloussa, H., Vialle, R., & Skalli, W. (2016). Experimental validation of a patient-specific model of orthotic action in adolescent idio-pathic scoliosis. European Spine Journal, 25(10), 3049-3055.
[11] Aubert, B., Vazquez, C., Cresson, T., Parent, S., & De, J. G. (2019). Towards automated 3D spine reconstruction from biplanar radiographs using CNN for statistical spine model fitting. IEEE Transactions on Medical Imaging.
[12] Nibali, A., He, Z., Morgan, S., & Prendergast, L. (2018). Numerical coordinate regression with convolutional neural networks. arXiv preprint arXiv:1801.07372.
[13] He, K., Gkioxari, G., Dollár, P., & Girshick, R. (2017). Mask R-CNN. In Proceedings of the IEEE International Conference on Computer Vision (pp. 2961-2969).
[14] W. Abdulla, “Mask r-cnn for object detection and instance segmentation on keras and ten-sorflow,” https://github.com/matterport/Mask RCNN, 2017.
[15] Dice, L. R. (1945). Measures of the amount of ecologic association between species. Ecol-ogy, 26(3), 297-302.
[16] Rousseau, M. A., Laporte, S., Chavary-Bernier, E., Lazennec, J. Y., & Skalli, W. (2007). Reproducibility of measuring the shape and three-dimensional position of cervical vertebrae in upright position using the EOS stereoradiography system. Spine, 32(23), 2569-2572. [17] Wu, H., Bailey, C., Rasoulinejad, P., & Li, S. (2018). Automated comprehensive Adolescent
Idiopathic Scoliosis assessment using MVC-Net. Medical Image Analysis, 48, 1-11. [18] Horng, M. H., Kuok, C. P., Fu, M. J., Lin, C. J., & Sun, Y. N. (2019). Cobb Angle
Meas-urement of Spine from X-Ray Images Using Convolutional Neural Network. Computational and Mathematical Methods in Medicine, 2019.
[19] Ebrahimi, S., Gajny, L., Skalli, W., & Angelini, E. (2019). Vertebral corners detection on sagittal X-rays based on shape modelling, random forest classifiers and dedicated visual features. Computer Methods in Biomechanics and Biomedical Engineering: Imaging & Vis-ualization, 7(2), 132-144.
[20] Jung, A. imgaug. 2017. URL: https://github. com/aleju/imgaug.
[21] Ren, S., He, K., Girshick, R., & Sun, J. (2015). Faster r-cnn: Towards real-time object de-tection with region proposal networks. In Advances in neural information processing sys-tems (pp. 91-99).
[22] Kim, K. C., Cho, H. C., Jang, T. J., Choi, J. M., & Seo, J. K. (2019). Automatic detection and segmentation of lumbar vertebra from X-ray images for compression fracture evalua-tion. arXiv preprint arXiv:1904.07624.
[23] Al Arif, S. M. R., Knapp, K., & Slabaugh, G. (2018). Fully automatic cervical vertebrae segmentation framework for X-ray images. Computer methods and programs in biomedi-cine, 157, 95-111.