HAL Id: hal-00077564
https://hal.archives-ouvertes.fr/hal-00077564
Submitted on 31 May 2006
HAL is a multi-disciplinary open access
archive for the deposit and dissemination of
sci-entific research documents, whether they are
pub-lished or not. The documents may come from
teaching and research institutions in France or
abroad, or from public or private research centers.
L’archive ouverte pluridisciplinaire HAL, est
destinée au dépôt et à la diffusion de documents
scientifiques de niveau recherche, publiés ou non,
émanant des établissements d’enseignement et de
recherche français ou étrangers, des laboratoires
publics ou privés.
To cite this version:
Johann Laurent, Nathalie Julien, Eric Senn, Eric Martin. High Level Power Estimation based on a
functional analysis for Embedded DSP Software. 2001, pp 168-172. �hal-00077564�
High Level Power Estimation based on a functional analysis for Embedded DSP
Software
Johann LAURENT Nathalie JULIEN
Eric SENN
Eric MARTIN
LESTER South Brittany University E-mail:
[email protected]
Centre de recherche rue Saint Maudé 56325 LORIENT cedex France
Abstract
We introduce here a high level power estimation method based on an original functional analysis; the power consumption of a whole algorithm is evaluated at a behavioral level instead of the classical study conducted at the instruction level. We also present the energy models elaborated for the last generation complex DSP: the TI C6201. This energy estimation method has been applied to a classical signal processing algorithm (FIR) and validated by measurements; with an error of less than 1% .
1.
Introduction
Today, more and more complex applications are implemented on embedded systems. The complexity of these applications lead to the computing resource increasing. One of the major problem due to this increase is the system power consumption. Indeed, the power consumption has a lot of repercussions on the system, this increases its size, its weight and the size of the cooling system and batteries.
The power optimization can act on these different parameters and these reductions are essential for all portable applications (GSM, UMTS) or spatial telecommunications. It is well-known that algorithm transformations are more efficient than technologic optimizations [1]; furthermore, such modifications are less expensive and allow to restrict the time to market. So it is very important to evaluate the application consumption at the early stage of the system design.
The new information and communications technologies, like real time image coding, need more processing and therefore require more computation capacities. In such complex applications, the new generation of Digital Signal Processor (DSP) are usually used. They are characterized by elaborate architectures: a deep pipeline, VLIW instructions, memory caches and possibly superscalar architecture.
All recent works on power estimation for DSP operate at the instruction level [2], [6],[7].
Until now, the estimation of an algorithm consumption was conducted using an instruction level model[3]. In the
first time, measures of all instruction set and all interactions between these instructions had to be realized. This step is very time expensive and must be restarted even when the DSP architecture is slightly modified. With new DSP generations, the instructions set increases significantly and the parallelism possibilities have to be taken into account. For the memory aspects, it’s well-known that the power consumption due to external memory access is more and more important in latest applications [1-4]. We have chosen to conduct our study at behavioral level. This can take into account the other architectural components (i.e. memories).
Section 2 will present the framework of the methodology proposed and its implementation to a specific DSP. Section 3 develops some examples of the power characterization for functional blocks such as fetch and execution stages. Finally, a whole signal processing application is provided as example of the method, and the estimates are compared to the measures.
2.
Methodology and functional analysis
2.A Framework of the methodology
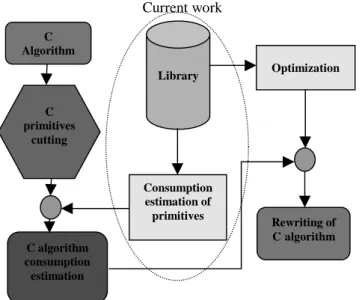
The final purpose is in fact to develop a power estimation method together with power optimization strategies on DSP programming for an algorithm in C language. The complete methodology proposed is presented in Figure 1.
First the C algorithm is divided in different C primitives (i.e. if, do, while…). Then we use a toolbox called Consumption estimation to estimate the consumption of all the different primitives. By combining these estimates, we can evaluate the power consumption of the entire algorithm. The toolbox Optimization is used for rewriting the C algorithm.
Current work
Figure 1: Methodology of power estimation and optimization
Both the toolboxes Consumption estimation and
Optimization require the construction of a complete
library, enclosing accurate power estimates validated by precise measurements. It is this part of the work on which we are focused here.
2.B General functional analysis
A functional analysis is used for realizing the libraries, based on a power consumption study of the architecture and the pipeline of recent DSP.
In a first time, we cluster the architectural components according to their impact on energy dissipation and their interactions. The general representation is presented in figure 2. This representation can be modified for particular DSP, by adding some sub-blocks and removing some others. In our model we have 4 blocks: the CU (Control Unit), the PU (Processing Unit), the MMU (Memory Management Unit) and the IMU (Instructions Management Unit). This 4 blocks can be composed of several sub-blocks.
In a second time, we determine the interactions inter and intra blocks and we qualify them in terms of power consumption. Generally, there are interaction between the CU and all other blocks because it integrates all the control registers. The DMA (Direct Memory Access) can generate an interaction between the MMU and the PU if data are loaded from external memory and between MMU and IMU if instructions are loaded from external memory. An interaction exists between the IMU and the PU because the instructions are first fetched in the IMU and then executed in the PU.
Figure 2: General functional analysis
2.C Specific functional analysis
We develop in this paragraph an example of the functional analysis applied to the TMS320C6201, one of the last generation of TEXAS INSTRUMENTS DSP. This processor uses a complex architecture since it has a deep pipeline (11 stages), VLIW instructions, parallelism possibilities (up to 8 parallel instructions) and its internal program memory can be used as cache memory.
We expose in Figure 3 the application of our functional analysis to this particular DSP; for more cleanness, only the interactions between blocks are represented.
An important interaction for all the sub-blocks has come out that is the Clock Tree which in effect acts upon the power consumption especially at the nominal frequency (F = 200 MHz) of this circuit.
We have separated the DECODE stage of the pipeline in two steps: the dispatching part (DP) is now included in the IMU whereas the instruction decoding (DC) is remaining in the PU. Indeed, the decoding is really done in the processing units whereas the dispatching is done at the fetch stages.
This DSP contains a specific block, the External Memory InterFace (EMIF), used for all the external access of both the program memory (in the IMU) and the data memory (in the PU). This device is represented as a new block with its interactions.
We will not represent the interactions between the CU and the other blocks because these do not be strong interactions in consumption point of view.
The different interactions can be define by either algorithm and configuration parameters.
C Algorithm C primitives cutting C algorithm consumption estimation Consumption estimation of primitives Library Optimization Rewriting of Calgorithm DMA MMU CTRL registers Peripheral bus PLL Interruptions CU FETCH stages CTRL/MEM PRG IMU REGISTERS ALU / MPY DECODE stages CTRL/MEM DATA PU
Figure 3: Interactions for the TMS320C6201
The configuration parameters are the frequency F and the localization. The algorithm parameters are the number of processing units used by cycle β, the cache miss rate γ, the external program reads rate ε and the external data accesses rate τ.
Then, we characterize all interactions by consumption laws. These laws allow us to estimate the power consumption for each part of a program and subsequently, for a whole algorithm.
3.
Power characterization of functional
blocks
To determine all the different laws, needed for the estimating of the algorithm consumption, we first have to make measures.
Two parameters must be measured, the average current of the DSP core Icore and the execution time of the
program Texe. Knowing these two parameters and the core supply voltage Vdd (2.5V) allow us to determine the average energy E thanks to the following expression (1):
E = Icore * Texe * Vdd (1)
We have defined scenarios to qualify the interactions and the sub-blocks. These scenarios are program set that stimulate one or one part of a block for measuring the absolute or relative part of this element in the total power consumption. These programs are written in assembler to be sure that we stimulate only the part that we want to qualify.
We construct these scenarios by using an unbounded loop that allows us to perform the measures and we calculate the energy (E) for one iteration of this program. The effect of the branch which is done at the end of the loop is negligible when the loop size is at least 500.
We present in the next section some typical examples of the achieved work on the TMS320C6201, especially on the fetch stage and on the processing unit.
3.A Memory modes
Here, we will present some results for the IMU with the different memory modes. The considered DSP, has 4 use modes for its internal program memory. The first one is the mapped mode where all instructions are in the internal memory. The second is the cache mode, where external access are done when the instructions are not in the cache (case of a cache miss). The third is the freeze mode, similar to the cache except that the cache is only read and never written. The last one is the bypass, where all the instructions are read in external memory.
In Figure 4, we show the average current used by the DSP core and also the average energy for one iteration of the scenario. As the scenario generates no cache miss thus, in this case the results for the cache are identical to the freeze.
First, we can confirm that the current is not a sufficient parameter to make a choice between the different memory mode. Indeed, the bypass absorbs less current than the mapped mode (about –39%) but it use more energy (at least +390%). The most efficient mode is, of course, the mapped.
MEMORY MODE CURRENT (mA) ENERGY (µjoule) F = 133MHz MAPPED 1300 24.44 CACHE 1342 25.22 BYPASS 795 120 F = 160MHz MAPPED 1554 24.3 CACHE 1595 24.9 BYPASS 948 237 F = 200MHz MAPPED 1840 23 CACHE 1904 23.8 BYPASS 1175 235
Figure 4: Characteristics of memory modes
3.B Memory cache
As the complexity of embedded applications increases regularly, more and more memory space is needed but the DMA FETCH/DP CTRL/MEM PRG EMIF REGISTERS MULTIPLEXER DC/UAL/MPY CTRL/MEM MMU Clock tree (F) γ, ε β
τ
PU IMU Localization EXTERNAL MEMORY DSPinternal memory size is limited so, to execute the recent applications, external memory accesses are unavoidable. The evolution of the consumption in the cache mode depends on several parameters like the parallelism rate (α), the frequency (F) and the cache miss rate (γ).
The parallelism rate can vary from 1/8 to 1. When
α=1/8, all the instructions are executed sequentially and when α=1, all the instructions are executed in parallel. The cache miss rate can vary from 0% to 100%.
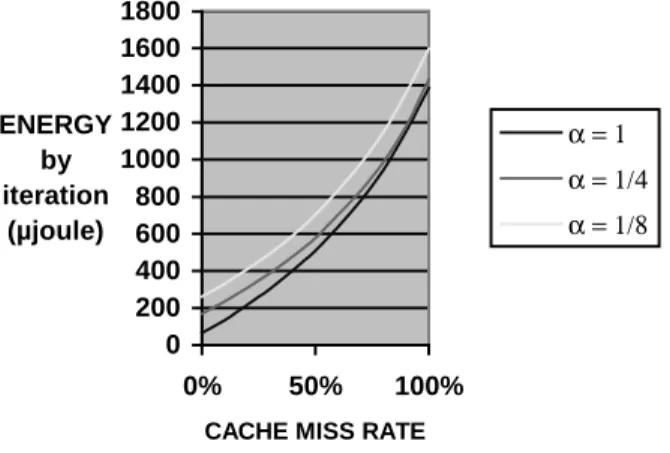
In Figure 5, we present the evolution of the average energy in function of both the cache miss rate and the parallelism rate for F=160MHz.
Figure 5: Cache miss energy
We can see that there is an over-consumption of more than 2000% between a program which generates 0% of cache miss and a program which generates 100% of cache miss. Moreover, the energy variations with the parallelism rate are less predominant; at 0% of cache miss rate, the energy dissipated for α= 1 is 300% lower than for α = 1/8. This gap shrinks when the cache miss rate increases (about –15% at 100% of cache miss rate). In conclusion, α is optimized by the compiler although γ is not taken into account it is crucial to first avoid the cache miss before using the parallelism possibilities.
3.C Consumption laws
We have obtained consumption laws by generating different scenarios. These laws will be able to estimate the consumption of a complete applications. We will present here some laws for example.
The first one is the consumption law of the mapped mode and it is given by the expression (2).
ICLK+FETCH+PRG = (aα + b) F + cα + d (2)
ICLK+FETCH+PRG: average current (in mA)
F: frequency (in MHz)
a = 5.21 mA/MHz; b = 4.19 mA/MHz c = 42.4 mA; d = 7.6 mA
The bF parameter represents the clock tree consumption, this parameter is validated by the TI value (4.21*F) [5].
The second is the consumption law of bypass and it is given by the expression (3).
IBYPASS = 5.68*F + 38.4 + 4.19*F (3)
The third is the law to estimate the consumption of the processing unit and it is given by the expression (4).
IPU = a*β*F (4)
IPU : average current of the processing unit (in mA). a = 0.64 (mA/MHz).
In this law, the data variation is not taken into account because the consumption variation due to this parameter is negligible [5].
4.
Algorithm estimation
In this section, we present our estimation method to estimate a whole algorithm (for the moment at the assembler level). We will estimate the consumption of a FIR filter implemented on a TMS320C6201. These results will be compared to the measurements, this can allow us to validate our model.
4.A Estimation method
The estimation method is based on the specific functional analysis presented above and uses the laws obtained through the experiments. Figure 6 synthesizes the different parameters to take into account for each functional block of our target architecture.
0 200 400 600 800 1000 1200 1400 1600 1800 0% 50% 100% CACHE MISS RATE ENERGY by iteration (µjoule) α = 1 α = 1/4 α = 1/8 DMA MMU ALU/MPY/DC/ REGISTER
-
β
DATA MEMORY -τ
,
η
MEMORY MODE-
γ
,
ε
PARALLELISM RATE-
α
IMU PUFigure 6: Estimation functional parameters
For the IMU, we have to consider the memory mode operating. According to this mode, we will use the appropriate parameter (γ, ε) to determine the consumption of this block. In this block, we study also the parallelism rate α that determines the FETCH stages cost. It could be reminded that the cost of both the clock tree and the program memory are also included in the FETCH stages cost.
For the PU, the processing unit cost is determined with the law that we have shown before by calculating the
β parameter. We also study where the data are stored to take into account the locality of data (τ, η, use of DMA and external memories).
The global cost of the application can now be evaluated by addition of all the different costs we have determined.
A.
Estimation example
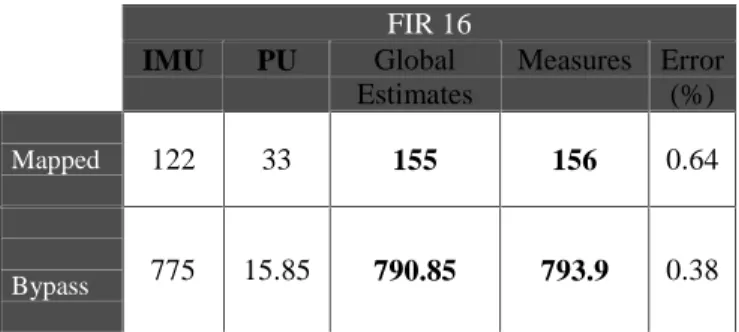
The considered application is a FIR filter that uses 16 coefficients and for which all the samples and coefficients are in internal data memory. Energy results are presented in Figure 7 for two cases. In the first one, we use internal program memory in mapped mode and in the second one in bypass mode. For these examples, the clock frequency is equal to 200MHz (maximum frequency for this DSP).
FIR 16 IMU PU Global Estimates Measures Error (%) Mapped 122 33 155 156 0.64 Bypass 775 15.85 790.85 793.9 0.38
Figure 7: FIR16 energy estimations and measures (in µJoule per iteration)
We first remark that we underestimate the power consumption with an error of less than 1%. Further results for the cache mode will also be presented in the last version of this paper.
In mapped mode, the clock consumption represents 54% of the total consumption, the fetch consumption 24.7% and the PU consumption 21.3%. In bypass mode, the clock consumption represents 41% of the total consumption, the fetch consumption 57% and the PU consumption 2%.
We can see that the clock consumption is not negligible but particularly that the fetch stages used more energy than the PU. Therefor, it is very important to take
into account the memories and to try to optimize as better as possible the memory accesses.
5.
Conclusion
We have introduced a high level power estimation method providing the energy estimates of an entire algorithm through a behavioral analysis of the DSP architecture instead of the usual approach conducted at the instruction level. This method has been implemented on one of the last generation of Texas Instruments DSP (TMS320C6201), built around a complex architecture. The results obtained for a FIR algorithm, at the assembler level, are validated by measurements with an error of less than 1%. In future works, after having improved this promising method for other applications, the final purpose of the project will be to extend it to the estimation of C language algorithms and to find some parameters to optimize the consumption of embedded applications.
References
[1] J.M. Rabaey, M. Pedram "Low power design methodologies" Kluwer Academic Publishers 1996.
[2] Vivek Tiwari, Sharad Malik, Andrew Wolfe "Power analysis of embedded software: a first step towards software power minimisation." IEEE Transactions on VLSI Systems, December 1994.
[3] Mike Tien-Chien-Lee, Vivek Tiwari, Sharad Malik and Masahiro Fujita "Power Analysis and Minimisation Techniques for Embedded DSP Software." IEEE Transactions on VLSI Systems Vol5 N°1 March 1997.
[4] P. Vanoostende et al. "Issues in low power design for telecom" IEEE 1995 p 591-593.
[5] J.Laurent, N. Julien, E. Martin " High Level power
Estimation for DSP" SAME 2000 conference proceeding
p112-118.
[6] P.Laramie "Instruction level power analysis and low
power design methodology of a microprocessor" in Master
Thesis, U.C. Berkeley.
[7] C. Brandolese, W. Fornaciari, F. Salice, D. Scuito “ An
Instruction-Level Functionnality-Based Energy Estimation Model for 32 bits Microprocesseur” DAC 2000 conference