University of Echahid Hamma Lakhdar El-Oeud Faculty of Natural Sciences and Life
Department of Cellular and Molecular Biology
Master Memory
In order to obtain a diploma of an Academic Master in biological sciences Specialty : Applied Biochemistry
Theme
Presented by : CHERADID Taissir GUESSOUM Messaouda
Thesis Approved : 23th June 2019
Examining Committee:
President : Dr. TOUMI Ikram (MCB) El-Oued University Examiner : Dr. LAICHE AmmarTouhami (MCB) El-Oued University Supervisor: Dr. DEROUICHE Samir (MCA) El-Oued University
2018-2019
Study of risk factors and predictive markers of Chronic
kidney disease (CKD) in Djamaa Hemodialysis Patients, and
assessment of water quality effect (major risk factor) on
kidney function in rats Wistar.
ءادهإ
ل" :ىْدشنا ٍحمشنا للها ىسث م خثٌزنا( "ٌٌنيؤلماً ونٌسسً ىكهًع للها ٍيرسف اٌهًعا -501 -ىْظعنا للها قذص ) ،بنْهع للها مضف لاٌن وْنإ مصنن ٍكَ لمً ازله بنّمفً ُزنا لله ذًلحا لىإ بيَ لىإ خيلأا خصًَ خَبيلأا ٍداً خنبسشنا غهث ٍي خحمشنا بنجْجد ذًمح مص ا لله وْهع ولاسً . ،بيْيذل ذتح تينج ٍي لىإ ِداشج ىسهث بنهبندً ِدبنج شس بيئبعد ٌبك ٍي لىإ ذهمثأ ٍي لىا ابرص وبّلأا دذىبج ً اشيس ٌٌفلجا لىإ، ٍي نيرشًغ بيزّبعشث بيفطعً " ِيأ خجْجلحا " لبطأ للها في بىشًع . لىإ سٌَ نيْع حضعً ِسفٌَ فيششً ضيسً ،تيياشك لىإ ٍي محمأ وسما مكث ،سبخزفا ءبطعنا نيًهع ٍي لىا سبظزَا ًٌذث , لىإ ىظعأ لبجشنا ابرص اضيس تذهن ٌبك ٍي .خذصنا وْهع وادأً هشًع في للها لبطأ ِثا لىا، لىا أ َِبث ِث , حبْلحا لملاس ذمهسر ٍي لىا هذّ َهع , ِيلادا كْمتح في ودبنج ٍأس ٍي لىا , ُذنس لىا حبنج حسٌص ِطٌمسن ىسس ٍي لىا لىا َهعلأا ِهثيً شلح خأ نيْع " ِ ُيرصٌث " ِراٌخأً ِرٌخئْهيأهمدٌجٌّهظْفشْعْنًىنإ،بلهدًذدلاحٌمجسزكأهمدٌجٌجنًىنإذًزعأًيْهعًبركأًيجنًىنإ : خْهْيبك , خهْيس , ىعنلما ذجع , ٍشسّ ذجعر ٍي لىا بنزداشن , بنزكذضن ذكث ٍلم , بنرذعبسن بيعٌيد ذفج , بندبجنن دشيس , حبفكنا نيزًهع ٍي لىا ِرذج خَْبث ِيأ خعبجشنا نيزثسًأً " ْلس " خ لىإ ٍي ًٌَِعد ىيئبعذث ىيجدً يرجكنا " ٌُذج ينسد ", ٌِرذج " خْكص لبطأ " للها في هشًع " ُذج ً ذحمأ " ّ وزحمشث للها هذًغ خعساٌنا . ِيبًعأ لىا قسبط , شىصلأا ذًمح بىدلاًأً وزجًصً , ىْكلحا ذجع وزنثاً وزجًصً . خئْضي خعشم لىا , تيًع حشىضي حدسً لىا " ءاشىضنا خًطبف " لياٌخأ لىا , ىىدلاًاً ىتهبجًص , ىىدلاًاً ِرلابخ لىا , " تينبخ تهمنا َهع حضّضع لىا حيرصَ " َهعلاا ليبثيً ِرًذل لىا , وجدا ٍي لىا ليبخ ةاشر ذتح ضّضع لىا للها " شكثٌث للها هذًغّ " ث حمش خعساٌنا وز معيجً نلجا هاٌثي خحبْلحا في ُذنسً ُشًع دبمْفس , ليبخ دبنث بيهل دبجْجد يرجع , خْسم , ٍذلها سشم ًا بيزنث , حضنك بىدلاًأً .. ىدّشنا خهص ِعي ىيزعجم ٍي لىإ خهئبع مك ٗنا , "وٌسل" ٍي لىإ دبْنبغنا ِربمّذص بىشيً بىٌهبح خْعيبلجا حبْلحا ةًسد في ىيزمفشث دذعسً ءبطعناً ءبفٌنبث اًضّْتمً ءبخلإبث ا ٌّهتح : شثٌك , خنّذي , حضّشث , خْفص , ٍّشسَ , حبْد , ٍّشثبص , خكسبجي , ءبفً بفشد نيًهع ٍي لىا ف اذجع ون دشص , ىهع خًهك َِاذىأً خعشم لي سبَأ ٍي لىا ًِهعي ُربزسأً سٌزكذنا" "شًّسد يرسم ِرشكزي ىيعسر لمً ِرشكار ىيزعس ٍي مك لىإ ًِهل ىيْسًَ بيهل ىىشكر ٍي لىإ
حدٌعسي
ءادها
حشفنا ٔ ٌضذنبث حءٕهًي شجد داشطل ٗهع أكزٚ ناشذنا ٗهع ٖٕمٚ لا ٔ قسلأا ٔ تعزنا ِبٛعأ ىهمث ظٛذر ميبَأث .ذدأ ٌآ ٙف ٕشٚ ٌضد ث .عًجزنا ذعث قاشفنا ّ ... .)ٙجشخر وٕٚ ( ٙربٛد ٍي ذٚذج شجف غٔضجن حشف ٔ . الله ذعث دٕجٕنا ٙف ٍي مك ٙنإ الله ذعث ٘رلاي ٔ ٙرٕل ٔ ٘ذُس ٙنإ . ٗهع َٗٔشثا ٍي ٙنإ أ ىٓسفَ حبٛذنا ُٗعي ًَٕٙهع ٔ ةادٜا مك َٙبًهع ٔ ةبسد ٌٔد َٙبٛطعأ ٍي ٗنإ. ٔ ةإثلأا ٙن خزفر لاضر لا ٔ ذَبك بًٓرإعد . ًهع ٍي بٚ ىكٛنإ ز ....ولاظنا ٍعن ٍي سذجأ خعًشنا حءبضإ ةٕجٔ ُٙ ٙجهل ٌبطهس . ’ ٙرٔذل ’ ًٙهعي .٘ذُسٔ . يلاغلا يبأ . ث بئفد ٔ بَٕع ٙزُك ٍي ىكٛنإ ٛ ٖشخأ ٔ حشزف ٍٛث َٙاضدأ ىهًن ٍي ٔ .ٙعهضأ ٍ .. ... ٙجهل حشْص ’ ٔ ٌُٕذنا ٙدٔس سَٕ ُٙٛع .. تبيبحلا يمأ . .ّٛهئبس حشٛد خٛذصنا ةإجنبث ٖذْأ ٔ...ِشٛغ ممع ًّهعث ءبضأ ٍي ٗنإ .ٍٛفسبعنا خدبًس ّزثبدشث ٔ...ءبًهعنا عضإر ّزدبًسث شٓظأ ٙنإ ًُهع ٍي ٙ ؤبفزنا ُٗعي ٔ ل ٙضًنا ٗنإ وبيلأا ... ٗنإ خٛهمعنا ٔ خًٛهعنا ٙكساذي عٛسٕر ٙف كًع ٍي . ىكٛنإ ...ىزَا شًُٛنا ٙجاشس ’ ٙجُٓي ’ ٔ ٘ربزسأ يناثلا يبأ مضبفنا بَسٕزكد . ريمس شيورد . ىكٛنإ ىزَا ٍي ىزُك ٙئجهي ٔ ٘رلاي َٙضذن ٌَٕضذر ٙدشفن ٌٕدشفر ٍي بٚ , ٙنإ كٚشط بُن أذٓي ٍٚزنا ىهعنا .ٔ خفشعًنا يتوخإ ىٛنٔ. ىٛسٔ ( ىٛهسر. تٛلشنا ذجع . ٍٚذنا ٙنٔ. ىَٛص. ) يبابحأ ( ٙيبًعأ ٔ ٙربًع , ىٓربجٔص ’ ىٓئبُثأ ( تميركلا يتلئاع. ) ٔ ٙنإخأ ىٓربجٔص ’ ٙرلابخ ’ ىٓئبُثأ و ) يبراقأ . ... خنبصلأا ضيس ٔ خًكذنا عجُي ىكٛنإ … ... ىن ٍي ٗنإ ٚ شعش َٔ حذٛدٔ َُٙأث ُٙ فهزخي عًزجي ٙف .. حدٔدٕنا ٙزخأ. ٔ بْءبُثأ بنيز يلابج , ةداتق , مينست و دايإ هعج ٍي ىكٛنإ ك الله ى أ خ ٘بز َٙضد ٔ ٙردبعس ٍٛث عًجٚ ٍي ٔ خفذصنبث ٘بزهٛيص ٍٛزٛنبغنا لاون يسوتع .تشئاع يشاوك , .َٙٔشكر ثٛد ىْشكر ًُٗرأ ٔ ٙجهل ىٓعسٚ ٍي مك ٗنإ .. َٕٙفشعٚ ىن ٔ ىٓفشعا ىن ٔ ٙرشكزي ٙئسبل مك ٗنإ
Modest Work.
We would like to take this opportunity and extend our deep and sincere thanks and deep appreciation to:
first, our supervisor Dr: DEROUICHE Samir for orientation, confidence, patience, his precious advice and help throughout the work period., has always been attentive and very available throughout the realization of this memory, so for the inspiration, the help and the time he has been kind enough to devote to us.
Secondly, Our heartfelt thanks also go to the members of the juryDr. LAICHE AMMAR
Touhami and Dr. TOUMI Ikram for their interest in our research by agreeing to examine
our work and to enrich it with their proposals.
To the managers and staffs and patients of SaadDahleb Hospital and Hemodialysis Service Djamaa, Algerian Water Station and Laboratory (ADE), Bachir Ben Naser Hospital-El-Oued and the Laboratory of Natural Sciences and life faculty of Echahid Hamma Lakhdar University where we were able to carry out our research work by their understanding and their assisting for us.
our dear parents for their contribution, their support and their patience.
our families and our friends who by their prayers , their encouragements and their volunteering and helping us.
we would like to specifically mention and thank our faithful colleagues ATOUSSI Naouel
and KAOUACHI Aicha and my dear uncle BENCHAOUI Hassan who thanks to their
interventions we have overcome all obstacles and accomplished our research work.
problems, this study aims to identify some predictive and risk factors of CKD and to evaluate some biological and oxidative stress markers in HD patients of Djamaa (El-Oued) region, on the other hand in this work we are evaluated the water quality of the Djamaa region and study its effect on some markers of renal function in rats .
Our socioeconomic and clinic risk factors study was conducted on 77 voluntary individual divided into 41 persons reserved as a control and 36 HD patients are recruited from HD service of Hospital Saad Dahleb Djamaa .They are represented by the mean age 46,32 years and their origin cover all Djamaa region. For biological markers study of HD patients , We are selected 21 control with mean age 39.00 ± 3.41years and 20 patients with mean 51.40 ± 3.64 years on which some biochemical, Hematological and oxidative stress markers were estimated. To test the effect of Tap water on renal function we used 3 groups of rats.
Also We are relied the analysis of Odds ratio, student analysis, correlation ratio analysis, and Rook analysis for the statistical study of this work.
Our results of Socioeconomic and clinical factors study illustrate the high relationship of CKD and Diabetes, urinary problem and arterial hyper pressure as a frequently risk factors also renal herbal medicine, drugs nephrotoxic and Disease before CKD are the very important risk factors OR(62.00 - 25.45) while that additive soft drink, spices and amount of water are significant (P<0.05) protective factors against CKD when OR ( 0.232 - 0.352).
Our biological study demonstrate a significant variations (P<0.05) in biochemical parameters , Hematological markers , electrolytes levels and oxidative stress markers which represented an important significant(P<0.05) specificity of GSH(32%,AUC=31%), ORAC and FRAP activities(87%,AUC=77% and 73%,AUC=85%) respectively. also we notice a significant correlation between oxidative stress markers and some biochemical parameters of kidney function.
In addition, we found a significant deference in some minerals and electrolytes levels between some spring ,tap and filtered water of deferent areas of Djamaa region which represented a significant effects on renal function shown in a remarkable changes of biological markers of rats drink water during 60 days of the experiment where the TW represented a high risk for kidney dysfunction while it contributes to significant variation on oxidant stress markers as MDA level and antioxidant enzymes as GSH, CAT, GST and SOD
with TW results.
Finally, we conclude that there are a most socioeconomic and clinical risk factors for CKD also tap water and filtered water are an important risk factor for renal function while there may contribute to renal dysfunction and CKD in Djamaa population. In addition, GSH, ORAC and FRAP activities represent very important predictive factors for the disease studied where its can suggested in prognostic parameters of CKD.
طؼث وٍا٘ػ شطخىا ٗ وٍا٘ػ ؤجْزىا ضشَى ٛ٘ينىا س٘صقىا ٌٞٞقرٗ طؼث ٛذسمبزىا دبٖجلإا شٞٝبؼٍٗ خٞج٘ى٘ٞجىا شٞٝبؼَىا ِٞؼظبخىا ٚظشَيى ى ًذىا خٞفصز ٜف خقطٍْ ؼٍبج خ ( دا٘ىا ٛ ) , ٍِ خٞحبّ ٙشخأ بَْق ٜف ازٕ وَؼىا ٌٞٞقزث حد٘ج ٓبَٞىا ٜف خقطٍْ ؼٍبج خ خساسدٗ بٕشٞثأر ٚيػ طؼث ٚينىا خفٞظ٘ى خٞج٘ى٘ٞجىا شٞٝبؼَىا ٙذى ُاشئفىا . ٌر ءاشجإ خساسد وٍا٘ػ شطخىا خٞػبَزجلاا ٗ خٝشٝشسىا ٚيػ 77 بًػ٘طزٍ ٚيػ ِٞػصٍ٘ َِٞسق 14 بًصخش ٌٞيس ٗ 63 ٍِ ٚظشٍ ٚينىا وٞسغ ٌٕسبٞزخا ٌر ٍِ ًذىا خٞفصر خحيصٍ ى ٚفشزسَ خؼٍبج تيحد ذؼس ثٞح ػس٘زٍ ٌٕشَػ 0..2 ± 13 , 60 خْس ُ٘يثَٝ ٗ غَٞج قغبٍْ ؼٍبج خ , ٛ٘ينىا س٘صقىا ضشَى خٞج٘ى٘ٞجىا خساسذىا وجا ٍِ ٗ ٌر سبٞزخا 04 صخش ٌٞيس ٌٕشَػ ػس٘زٍ 6.14 ± 6..22 خْس ٗ 02 ٌٕشَػ ػس٘زٍ ٍِضَىا ٛ٘ينىا س٘صقىبث طٝشٍ صخش 6.31 ± 04.12 ثٞح ٌر شٝذقر طؼث شٞٝبؼَىا خٞئبَٞٞم٘ٞجىا وثٍ ( بٝس٘ٞىا , ٞربٝشنىا ْٞ ِ ) ٗ طؼث ٙ٘زسٍ دسا٘شىا ( ً٘ٝد٘صىا , ً٘ٞسبر٘جىا ذٝس٘ينىاٗ ) ٗ شصبْػ دبّ٘نٍ ًذىا شٞٝبؼٍ ازم ٗ دبٖجلإا ٛذسمأزىأ غَٞج ٙذى وَؼىا ازٕ ٜف خسٗسذَىا دبئفىا . وٞيحر ٗ غبجرسلاا خجسّ وٞيحر ٗ تىبطىا وٞيحر ٗ حٞجشزىا خجسّ وٞيحر ٚيػ بّذَزػا بَم كٗٗس خساسذىا وجا ٍِ خٞئبصحلإا .وَؼىا ازٖى حظ٘ر خساسذىا ٓزٕ ٜف بٖٞيػ وصحزَىا جئبزْىا ُأ ضشٍ ٛشنسىا ,ٍِضَىا شَىاٗ ومب خٞى٘جىا عبفرساٗ ػغظ ًذىا ّٜبٝششىا حشٞجم شطخ وٍا٘ػ ٜٕ ٛ٘ينىا س٘صقىا ضشَى حظ٘ر بَم بعٝأ ُأ هبَؼزسا خٞجطىا ةبشػلأا خٝٗدلأاٗ خصبخىا ضاشٍأث ٚينىا خثبصلإاٗ ث لأب ضاشٍ شطخ وٍا٘ػ ٜٕ خٍْضَىا بعٝأ خثبصلإى ضشَث وشفىا ٍِضَىا ٛ٘ينىا ٌٞقث OR خرٗبفزٍ ( (P<0.05 OR(62.00 - 25.45) بَم ذحظٗأ خساسذىا ُأ ٗ خٝصبغىا دبثٗششَىا هبَؼزسا ةشش ٗ وثا٘زىا ٌٞقث ضشَىا ذظ خٝبقٗ ٗ خٝبَح وٍا٘ػ شجزؼر ٓبَٞىا ٍِ حشٞجم دبَٞم OR <1 (0.232 - 0.352) . خٞج٘ى٘ٞجىا خساسذيى خجسْىبث دشٖظأ ٗ ًذىا دبّ٘نٍ ٜف ٗ خٞئبَٞٞم٘ٞجىا شٞٝبؼَىا ٙ٘زسٍ ٜف حشٞجم دبْٝبجر جئبزْىا ٍ ٙ٘زس ذؼث ٗ وجق وصَىا ٜف دسا٘شىا شٞٝبؼٍ ف لىزم ٗ ٚينىا وٞسغ خٞيَػ دبٖجلإا شٖظٝ بٍَ ٛذسمبزىا شٞثأر خىبحىا ٚيػ ضشَىا خٞج٘ى٘ٝضٞفىا ٚينيى بَم. ذْٞث ضشَىا ؤجْزى خصبخ شٞٝبؼٍ سٖ٘ظ جئبزْىا ( P<0.05 ) GSH (32%, AUC = 31 %) ( 87%, AUC = 77% ٗ ٪ 50 , AUC = % 76 ) ORAC ٗ FRAP ٚيػ ٜىا٘زىا لىر ذمأٗ ىا خقلاؼ ىا خْٝ٘ؼَ ِٞث ىا ٓزٕ دبٍلاؼ طؼثٗ شٞٝبؼَىا ا ٘ٞجى خٞئبَٞٞم ث خصبخىا ٚينىا خفٞظ٘ غبجرسلاا خجسّ وٞيحر جئبزّ ٜف دشٖظ ٜزىا ٜئبصحلإا . بٍأ خساسذىا صخٝ بَٞف خٞيٞيحزىا ءبَيى دشٖظأ جئبزْىا لازخا لا اشٞجم ٜف دبٝ٘زسٍ ُدبؼَىا ٗ دسا٘شىا ٜف ٓبٍٞ ْصىا شٞثب فيزخَى ءبحّأ ٜف بٞيج شٖظ هلازخلاا ازٕ .خٞؼٞجطىا خّٞذؼَىا ٓبَٞىبث خّسبقٍ خقطَْىا سفْى حبفصَىا ٓبَٞىا ٗ خؼٍبج خقطٍْ خساسد جئبزّ شٞثأر ثٞح ُاشئفىا ٙذى ٚينىا خفٞظٗ ٚيػ ٓبَٞىا لير دشٖظأ ٚينيى بٞفٞظٗ لالازخا ٔرذمأ شٞٝبؼَىا داشٞغر ٍ ٗ خٞئبَٞٞم٘ٞجىا حظ٘ٝ بٍَ ٛذسمبزىا دبٖجلإا شٞٝبؼٍ ٗ ًذىا دبّ٘ن شٞثأزىا ا ٓبَٞىا ٗ شٞثبْصىا ٓبٍٞ هبَؼزسلا ٜجيسىا حبفصَى ٚيػ . ةششيى بٖىبَؼزسا ٙذى ٚينىا خفٞظٗ ٜف شٞخلأا وَؼىا ازٕ ٍِ جزْزسّ طؼث ُأ خٍَٖ وٍا٘ػ ٜٕ خٝشٝشسىا ٗ خٞػبَزجلاا دبم٘يسىا خثبصلإى ٗأ وشفىا ٍِ خٝبق٘ىا ٗ ٛ٘ينىا ُأ ٜٕ ةششىا ٓبٍٞ ٜسٞئس وٍبػ خؼٍبج خقطٍْ ٜف ضشَىبث خثبصلإى خفبظلإبث ٚىإ لىر شٞٝبؼٍ وثَر GSH ORAC, FRAP ٍِضَىا ٛ٘ينىا س٘صقىا ضشَث خثبصلإبث ؤجْزىا ٜف ٌٖسر حذٝذج خٞج٘ى٘ٞث وٍا٘ػ بٖحاشزقا ِنَٝ ثٞح صٞخشر شٞٝبؼٍ َِظ ازٕ .ضشَىا تاملك ةيحاتفم : ٛ٘ينىا س٘صقىا ٍِضَىا , ٚينىا وٞسغ , ٛذسمبزىا دبٖجلإا , س٘جْصىا ٓبٍٞ .
ACR: Albumin-Creatinine Rate. ADE: Algerie d'eau (Algeria water). AER: Albumin-Excretion Rate.
AGEs: Advanced Glycation End-products
Ang II: Angeotensine II. APC: Antigen presentin cells. AV: Arteriovenouse.
BHT: Butylate dhydroxytoluene. CAT: Catalase
Cd: Cadmium.
CDNB:1-chloro-2-4-dinitrobenzene. CKD: Chronic Kidney Disease.
CKDu: Chronic Kidney Disease unkonow. Cl: Chlorine.
Co: Cobalt Cr: Chromium
CRF: Chronic Renal Failure. CRP: C-reactive protein
CTI: chronic tubule-interstitial injury. CVD: Cardiovascular Disease.
CVM: cardiovascular morbidity. DNA: Deoxyribonucleic acid.
DTNB:5,5' Dithiobis(2-nitrobenzoic acid) EPO: Erythropoietin.
EDTA: Ethylenediaminetetraacetic acid. ESA: erythropoiesis-stimulating agent.
Fe: iron.
FRAP: Ferric Reducing Antioxidant Power GFR: Glomerular Filtration Rate.
GSHas: Reduced Glutathion oxidase. GST: Glutathion S Transferase. HB: Hemoglobine.
HCT: Hematocrit. HD: Hemodialysis. Hg: Mercury
HLA.DR: Human Leukocyte Antigen – antigen D Related HPS 700-11: Hyperspers 700-11. HTA: Hypertension. IL1: interleukin-1. IL6: interleukin-6 ILa:interleukin a K: potassium.
KDOQI: kidney Disease Outcome Quality Initiative LDL: Low Density Lipoprotein.
MDA: Malondialdehyde. Na: sodium..
NADPH: Nicotinamide Adenine Dinucleoide Phosphate. NBT: Nitro-Blue Tetrazolium.
NF-KB: Nuclear Factor-Kappa B. Ni: Nickel
O2: Oxygen.
OS: Oxidative stress.
PAD: Patients After Dialysis. Pb: Lead.
PBD: Patients Before Dialysis.
PIH: Pregency Induced Hypertension. Pmp: Per million population.
RA: Rheumatoid Arthritis. RBC: Red Blood Cells.
ROS: Reactive Oxygen species. SOD: Superoxide Dismutase. TBS: Tris Buffer Saline. TCA: Trichloroacetic acid. TNF-a: tumor necrosis factor-a WBC: White Blood Cells.
WHO: World Health Organization. UTI: Urinary tract infection. UV: Ultraviolet.
Table Title Page
Table 01 Albuminuria categories in CKD 25
Table 02 Description of study population. 05
Table 03 Socioeconomic factors of Chronic Kidney Disease. 0. Table 04 Clinic-pathological factors of Chronic Kidney Disease. 64 Table 05 Mea Biochemical markers in control and patients groups. 60 Table 06 Serum electrolytes and calcium levels in control and patients groups. 66 Table 07 Hematological parameters in control and patients groups. 66 Table 08 Reduce glutathione ( GSH) concentration ,Malondialdehyde (MDA)
level and catalase activity in leukocyte and Erythrocyte of control and patients groups.
61
Table 09 Serum ORAC and FRAP activities in control and patients groups. 60
Table10 Area Under Curve 60
Table 11 Correlation between oxidative stress markers and biochemical parameters.
Number Title Page
Figure 01 Kidney structure 20
Figure 02 Nephron anatomy 07
Figure 03 kidney transplant anatomy 42
Figure 04 Peritoneal dialysis options 10
Figure 05 Hemodialysis operation 44
Figure 06 Arteriovenous fistula 11
Figure 07 Arteriovenous graft 40
Figure 08 Vascular access catheter option 42
Figure 09 Maps of Oued Righ and Djamaa region 47
Figure 10 ROC Curve of serum ORAC, serum FRAP, RBC MDA (A), RBC GSH level and leucocyte CAT activity (B) in HD patients .
63
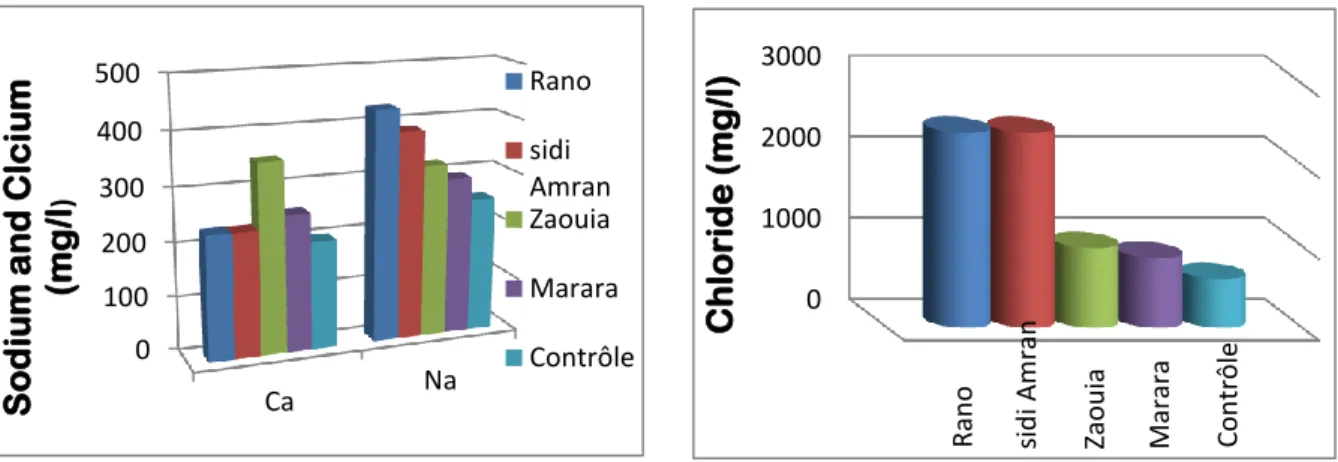
Figure11 Sodium and calcium levels in spring water 38
Figure12 Chloride level in spring water 65
Figure13 potassium level in spring water 65
Figure14 Conductivity values of spring water 65
Figure15 Iron level in spring water 39
Figure16 Electrical conductivity of Tap water and Filtered water. 6. Figure17 Chloride level of Tap water and Filtered water. 6. Figure18 Potassium level in Tap water and Filtered water. 12 Figure19 Sodium and calcium levels in Tap water and Filtered water. 12 Figure20 Iron concentration in Tap water and Filtered water. 12 Figure21 Urea and creatinine concentration in serum rats of control and
experimental groups.
11 Figure22 Electrolytes levels in serum rats of control and experimental groups 41 Figure23 Hematological markers Numbers in rats of control and experimental
groups.
42
Figure24 MDA and GSH concentration inkidney of control and experimental rats groups.
43 Figure25 GST activity in kidney inkidney of control and experimental rats
groups.
43 Figure26 Catalase and SOD activities in kidney of control and experiment rats
groups. .
Acknowledgements Abstract Abbreviation list Figures List Tables List Introduction
Bibliographic part
I. Generality………..………..………….……04I.1. Anatomy of kidney………..…………...……….04
I.1.1 Nephron ………..…………..…….……05
I.1.1.1. Definition of nephron……….………..………..…..05
I.1.1.2. Nephron structure and function……….………..….05
I.1.2. vessels blood………...……….…………06
II. Chronic kidney disease………..…..……….………….07
II.1. Definition………..………..………...07
II.2. Classification of CKD………...……….………08
II.3. Risk factors and progression………..……..….……….08
II.4. Symptoms of chronic kidney disease………..…...………09
II.5. Diagnosis of chronic kidney disease………..….……...09
II.6. Management modality of chronic kidney disease………..…10
II.6.1. Medical treatment………...…….…….…….…10
II.6.2.Supplementing treatment………..…………..….……..12
II.7. Prevention of chronic kidney disease………..………..12
Experimental part
I. Materials and Methods………...……….…17
Part 1: Patients study……….……...…...…..……….…17
I.1.1. Risk factors study………....17
I.1.1.1.The study duration……….……...17
I.1.1.2..Region of the study……….………....…17
I.1.1.3. Epidemiological study and questionnaire………...…..18
I.1.2. Biological study………..….……...18
I.1.2.1. Reagents………..…..……….…18
I.1.2.2. Methods………..………..………..18
I.1.2.2.1. Data collection………..………...………...18
I.1.2.2.2. Sample collection………..………...…………..19
Part 2: Qualitative study of water in different area of Djamaa region………….……...19
I.2.1. Samples collection………...…...…19
I.2.2. Methods of testing………...…19
I.2.2.1. Conductivity measurement………..19
I.2.2.2. Sodium ( Na) And Potassium (K) assay……….…………19
I.2.2.3. Chloride (Cl) and Calcium (Ca) assay……….…...……20
I.2.2.4. Iron (Fe) assay………..………...……….…….………..20
Part.3: effect of water on renal function in rats………..…….20
I.3.1. Animals and treatment………..………...20
I.3.4.1. Biochimical parameter assay……….……….…21
I.3.4.2. Method of Hematological analysis………..……21
I.3.4.3. Method of electrolytes analysis……….………..…….21
I.3.4.4. Method of estimating oxidative stress parameter………..………..22
I.3.4.4.1. Preparation of erythrocyte homogenate………..…..….22
I.3.4.4.2. Leukocyte separation……….……....22
I.3.4.4.3. Determination of protein concentration……….…………....22
I.3.4.4.4. Malondialdehyde level determination………...22
I.3.4.4.5. Reduced glutathione (GSH) level assay……….………..….23
I.3.4.4.6. Glutathione-S-transferase (GST) activity assay……….………...….23
I.3.4.4.7. Determination of superoxide dismutase(SOD) activity assay…………..…24
I.3.4.4.8. Determination of enzymatic activity of catalase……….…………...…24
I.3.4.4.9. Determination of antioxidant power ORAC………..…25
I.3.4.4.10. Determination of ferric reducing antioxidant power (FRAP) method…..26
II. Results………..28
II.1. Patients study……….28
II.1.1. Description of study population………..…..…………..28
II.1.2. Study of socioeconomic and clinic factors………..……...………….29
II.1.3. Biological Study ………...…………..……….32
II.1.3.1. Biochemical markers………...………...32
II.1.3.2. electrolytes levels………32
II.1.3.6. correlation between oxidative stress markers and biochemical parameters……..36
II.2. Qualitative study of water in different area of Djamaa region………….………….37
II.2.1. Spring water analysis………..……….…………38
II.2.2. Tap and Filterd water analysis………...………..…..…..39
II.3. Effect of water on renal function in rats………...………..…….….41
II.3.1. Biochemical markers………...……….…………41
II.3.2. Hematological markers………..………..…………42
II.3.3. Oxidative stress markers ………..………...………43
III. Discussion………..45
III.1. Patients study……….………45
III.2.Qualitative study of water in different area of Djamaa region………...….54
III.3. Effect of water on renal function in rats……….56
Conclusion………..………..…61
Bibliographical references………..………...64
Chronic kidney disease (CKD) is increasingly recognized as a global public health problem (Levey et al, 2007). During the past three decades, the incidence and prevalence of end stage renal disease (ESRD) have risen progressively. For example, annual new cases of ESRD increased from approximately 14,500 in 1978 to 100,359 in 2002; during the same period, the number of individuals on dialysis and with kidney transplants increased from 42,000 to 431,000(Anton et al, 2006). There is a wide spectrum of kidney disease, which can be rapid onset (acute) or longer term (chronic) (Public Health England , 2014).
The global CKD prevalence was reported to be 13.4% , in USA the prevalence was 13.6% , in Europe is lower than USA and more homogeneous and in some asian countries higher than USA but the Africa ,the lowest prevalence was 4% in northern Africa macro area, the highest 16.5% in west and central west Africa and the average prevalence in the entire Africa continent was 10.1% (AbdElhafeez et al,2018), also the burden of CKD prevalence in North Africa shown 650 pmp in Egypt,323 pmp in libya,734 pmp in Tunisia,300 in morocco and 475 in Algeria (Rashad , 2013). In addition, the total number of ESRD patients receiving renal replacement therapy in Algeria with population of 37 100 000 in 2001 reached 17000 in 2011 the prevalence and incidence of ESRD is 100 pmp and 109 pmp respectively (Lydia, 2014). Chronic kidney disease (CKD) has emerged as a global public health burden for its increasing number of patients, high risk of progression to end-stage renal disease (ESRD), and poor prognosis of morbidity and mortality (Shang-Jyh et al, 2010 ).
It attracts worldwide attention to its epidemiology, risk factors, treatment plans and preventive.
In order to identify the risk factors of renal disease, An individual's genetic and phenotypic make up puts him/her at risk for kidney disease .factors such as smoking, exposure to heavy metals, excessive alcohol consumptionand the use of analgesic medication (Rumeyza , 2013). Moreover, CVD , hypertension, diabetes and obesity are traditional risk factors (Ibrahim et al, 2014). In addition, environmental pollution including air and water contamination causer or aggravates many acute and chronic human disease (Sunil et al, 2016). Indeed Drinking water pollution is a relatively new problem and increases the stress arising as a result of unprecedented population growth, urbanization, and industrialization since 1990s (Chen, 2002; Velea et al.,2009).
oxidative stress has been implicated in the progression of major health problems by inactivating the metabolic enzymes and damaging important cellular components (Rahman et al, 2012), it is as a consequence of increase a reactive oxygen species and decrease in antioxidant defenses in prevalent in many health problems like CKD (Atieh et al, 2015). So the oxidative stress to have a central role in the pathophysiological process of uremia and its complications. However ,there is little evidence to suggest how early oxidative stress in a starts developing during the progression of CKD (Evangelia et al, 2006).
Faced with these problems, this study aims to identify some predictive and risk factors of CKD and to evaluate some biological and oxidative stress markers in HD patients of Djamaa (El-Oued) region, on the other hand in this work we are evaluated the water quality of the Djamaa region and study its effect on some markers of renal function in rats.
BiBliographic
part
3
I. Generality
I.1. Kidney anatomy:
The kidney is a pair of bean shaped , reddish brown organs about the size of your fist . It measures 10 – 12 cm the length(Studymode,2011) .5,5 cm the width and 3 cm thickness. Each kidney in an adult weighs about 150 g(Course Hero,2018).If the kidney is sectioned , tow regions are seen (figure 01):
I.1.1. Renal cortex: an outer part of the kidneys where most enthrones is located.(Ebneshahidi , 2006)
I.1.2. Renal medulla: an inner part of the kidneys where some anthrones is located, also where urine is collected to be excreted outward.(Ebneshahidi , 2006)
I.1.2.1. Renal pyramids: The medulla has many basically triangular regions with a striped appearance, the renal, or medullary pyramids; the broader base of each pyramid faces toward the cortex while its tip, the apex, points toward the inner region of the kidney. (Marianne , 2017)
I.1.2.2. Renal columns: The pyramids are separated by extensions of cortex-like tissue, the renal columns.(Marianne, 2017)
I.1.2.3. Renal pelvis: Medial to the hilum is a flat, basinlike cavity, the renal pelvis, which is continuous with the ureter leaving the hilum. .( Marianne, 2017)
I.1.2.4. Renal artery: which branches off the descending aorta.(Marieb et al.,1994)
I.1.2.5. Renal vein: drains blood from each kidney, entering into the inferior vena cava. These vessels enter / exit the kidney in the indented medial region of the kidney called the renal hilum .(Marieb et al.,1994)
4
Figure 01: Kidney structure. (Kim et al, 2011) I.1.1. Nephron
I.1.1.1. Definition of nephron:
The kidney's basic work units are the nephron ,apprpximately 1.2 million nephrons are contained in each kidney and form the urine (Miriama, 1998). It represents two types of nephron which are distinguished by the location of their glomeruli:( Sands and Verlander, 2010)
The cortical nephron; has a short loop of henle descending partially into the medulla and the majority type. .(Lawrence et al, 2018).
The juxtamedullary nephron 15%; has a very long loop of henle and has a higher glomerular filtration rate, as its associated glomerulus is pro-portionally larger than that of the cortical nephron .(Lawrence et al, 2018).
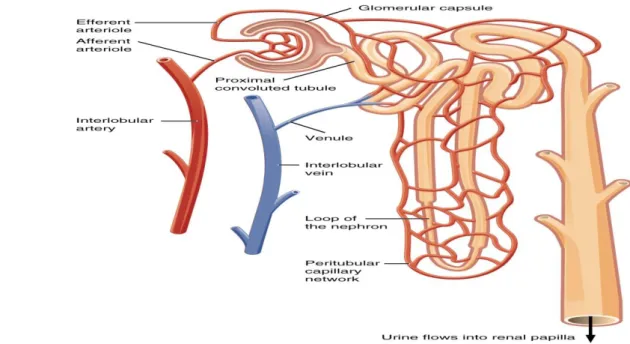
I.1.1.2. Nephron structure and function
This functional unit of kidney is consist by two parts :renal corpuscle and renal tubules(figure 02).(Lawrence et al, 2018).
5
I.1.1.2.1. Renal corpuscle:
I.1.1.2.1.1. Glomerulus; connected to a complicated and twisted tubule that finally drains into a collecting duct. (Kriz and Elger, 2010).
I.1.1.2.1.2. Bowman’s capsule; Double membrane cup-shaped structure that surrounds the glomerulus.(Lockwood et al, 2018)
I.1.1.2.2.Renal tubular :Consists of
I.1.1.2.2.1. proximales convoluted tubules; The proximal tubule reabsorbs 50– 60% of the total filtered load of inorganic solutes and water, whereas organic solutes.(Pablo et al, 2002) I.1.1.2.2.2. Distal Convoluted Tubule; The tight junctions of the cells lining the distal tubule are “tight,” so water and electrolytes cannot diffuse across the tubule and the filtrate remains hypotonic. In the early portion of the distal tubule, an apical Na+/Cl− transporter causes further reabsorption of ions. Thiazide diuretics block this reabsorption.(Seely and Blankenship, 2018)
I.1.1.2.2.3. Loop of Henle; It is U shaped middle portion of renal tubules. It is composed of ascending and descending loop. Ascending loop is thick walled and impermeable to water while descending loop is thin walled and permeable to water.(karki, 2017)
I.1.1.2.2.4. Collecting Duct; Determines final concentration of urine also Normally impermeable to water reabsorption (Hackenmueller , 2013)
I.1.2. vessels blood
I.1.2.1. Afferent Arteriole; The afferent arteriole receives blood rich in oxygen from the renal artery. This blood is transported to theglomerulus of the nephron where it is pressure filtered .(Tapan , 2017)
I.1.2.2. Efferent arteriole; is smaller in diameter than the afferent arteriole.(Tapan , 2017) so pressure difference occurs between the two ends of the glomerulus. This causes the filtration of blood plasma into the space of the Bowman’s capsule. Since the blood plasma filtration occurs under high pressure, it is called ultra-filtration or the high pressure-filtration.(Lakna, 2017)
6
Figure 02: Nephron anatomy (Kim et al, 2011). II. Chronic kidney disease
II.1. Definition
CKD is defined as the presence of kidney damage manifested by abnormal albumin excretion(Robert et al, 2008) or decreased kidney function(Angela et al, 2016)( shown by glomelural filtration rate GFR<60 ml/min/1.73m2 for 3 months or more(Robert et al, 2005) which is less than half of normal value in young adult men and women of approximately 125 ml/min/1.73m2(Kidney Disease: Improving Global Outcomes KDIGO.,2013) and the ACR >30 mg/g (Ki-Chul et al, 2019).
The glomerular filtration rate (GFR) is the best overall index of kidney filtration in healthy and disease(Claudio and Lakhmir , 2019) when the volume of plasma that is filtred by the glomeruli per unit of time,it is measured by the clearance of inulin or creatinine (Kent et al., 2015)also the age and gender are used to estimate the GFR. It become normal when it's number is more 90 ml/min (National kidney foundation[NKF],2013) but in kidney damage it divided depending the CKD stage whereas it become less than 15 ml/min in ESRD.(Douglass, 2008) a consequently the acute renal failure or acute kidney injury (AKI) is associated with acute decline of GFR (Matthieu and Didier, 2011).
a
7
II.2. Classification of CKD
Nearly ten years ago nephrologists began using a system of classification for CKD which was established in 2002 by the kidney Disease Outcome Quality Initiative (KDOQI) (Syed and Gerard ,2012) where the determination of CKD stages should be based on the combination between the kidney function indices (estimated GFR) and kidney damage (albuminuria-proteinuria)whatever the underling diagnosis.(David ,2012)
We can identify any stage of CKD by their estimated GFR as (David et al ,2017) study which shown :
Stage 1; is a kidney damage with normal or increased GFR >90 ml/min/1.73m2 .
Stage 2; is a kidney damage with mildly decreased GFR 60 to 89 ml/min/1.73m2
Stage 3; is divided into 3a and 3b which are distinguished by the mildly to moderately decreased GFR 45 to 59 ml/min/1.73m2 and moderately to severely decreased GFR 30 to 44 ml/min/1.73m2 respectively, and the severely stages as study of (Kidney Disease: Improving Global Outcomes[KD:IGO],2005)
Stage 4; there is a severe decreased GFR 15 to 29 ml/min/1.73m2
Stage 5; a kidney failure so GFR <15 ml/min/1.73m2 or dialysis .
Each stage be to linked to a specific action plans and have a related terms us (albuminuria stage, early or late or end stage renal disease ) also this classification based on a specific treatment as dialysis and transplantation.
There is the albuminuria categories in CKD represented in table 01 according the (Allan et al, 2016) study the nephrotoxic syndrome AER>2200 mg/24h and ACR>220 mg/mmol.
Table 01: Albuminuria categories in CKD .(Allan et al, 2016)
II.3. Risk factors and progression
The determination of factors predisposing an individual to CKD is essential in terms of personal and community health as some risk factors which can be non modifiable including; age ,gender ,ethnicity and family history.(Rumeyza,2013) In addition, a number of independent risk factors have been identified that may be modified by pharmacotherapy or
Category AER(mg/24h) or (mg/g) terms
A1 <30 Normal to mildly increased
A2 30-300 Moderately increased
8
lifestyle changes to reduce the rate of CKD progression such as Diabetes ,hypertension , inflammation ,anemia (Rainer,2006) and smoking ,obesity , physical activity.(Sadia et al,2012), also metabolic syndromes , dislipidemia, agricultural occupation and contact with agrochemicals can lead to kidney disease.(Carlos et al, 2011).
Feurthmore, The contamination of water resources has important repercussions for the environment and human health (Emmanuel et al, 2009; Muhammad et al, 2011). While that Drinking water contamination with different chemicals and heavy metals, released from different anthropogenic sources has become a global concern. (Rapant and Krcmova, 2007) Generally, drinking water containing different anions and heavy metals including Cd, Cr, Co, Hg, Ni, Pb, Zn etc, has significant adverse effects on human health either through deficiency or toxicity due to excessive intake .also the water which is showed in study of(Helmut, 2007) who's only confirmed that of the potential adverse effects of chronic low fluoride supplementation of drinking water on normal or decreased kidneys is insufficiency. while. the kidneys are the target organs for fluoride toxicity.(Djouadi and Derouiche, 2017) .
II.4. Symptoms of chronic kidney disease
The symptoms that one can experience during kidney failure change according to several factors. Any person with kidney failure will display a few symptoms as Reduction in the amount of urine passage(Pramod et al, 2018), fatigue, dry skin, frequent urination, loss of appetite, nausea, swelling of the hands or feet, numbness in the hands or feet, trouble concentration and darkening of the skin or muscle cramps.(Kidney Function Guide, 2018). II.5. Diagnosis of chronic kidney disease
Kidney damage is usually identified by abnormality in the blood , urine, imaging tests and if needed by kidney biopsy (Amy and Craig, 2011) so the following diagnosis evaluation tests for CKD are always indicated repeating serum, urea, creatinine electrolytes, eGFR and albumin within 1 week and fasting lipids and glucose , urine microscopy and culture and renal ultrasound scan(David, 2013), also we selected diagnostic testing including hematology , body condition score and blood pressure.(Andrew et al, 2016).
01
II.6. Management Modality of chronic kidney disease II.6.1. Medical treatment;
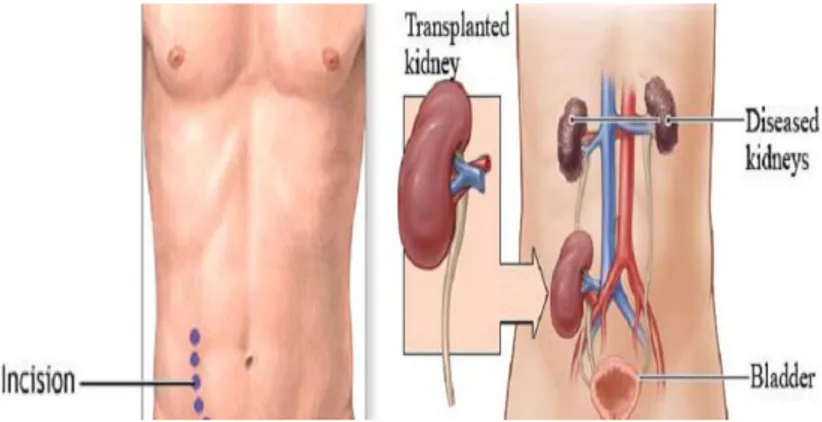
The modalities of renal replacement therapy available for the treatment of end stage renal disease (ESRD) include peritoneal dialysis, hemodialysis and renal transplantation. (United States Renal Data System[USRDS], 1999).
Kidney transplantation; has become the preferred treatment for qualified patients with ESRD while kidney transplantation is more cost-effective than maintenance dialysis and more importantly(figure 03), it provides better quality of life and prolongs.(Rubin, 2014).
Figure 03: kidney transplant anatomy (Mark, 2013)
peritoneal dialysis; works using the body's peritoneal membrane as a filter, this form of dialysis is very gentle on the body and it can protect the remaining kidney function also it's able to be successfully incorporated into most lifestyles.(Kidney Health Australia, 2016)(figure04).
Figure 04: peritoneal dialysis options (National Kidney Foundation[NKF],2006).
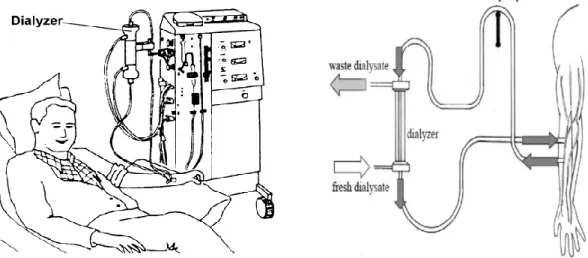
Hemodialysis modality; is a complex process requiring a skilled health care team and an appropriate educational process that can be individualized for patients and their supports
00
(figure05). (Brendan et al, 2018), it has been used since the 1940 to treat people with kidney disease when the kidney can't performed their function as a excretion water and regulation the level chemical elements in blood, dialysis can help keep the body. (Carissa Stephens.,2018)
Figure05: hemodialysis operation (Hasan , 2008; Health Information Translations, 2008). To get the blood to flow the artificial kidney, it must to create an entrance point (vascular access) in to blood vessels, there is three types of entrance point: (Carissa Stephens.,2018) Arteriovenous(AVF) fistula; is created by making a surgical connection between one of your arteries and one of your veins. Most of the time, a fistula is created in your non-dominant arm, but it can also be placed in your leg if the arteries and veins in your arm are not large enough or healthy.(Azura vascular car,2017)
Figure 06:Arteriovenous fistula(Larry, 2013).
Arteriovenous graft; is the second most common vascular access of choice in hemodialysis patients ,This type is a surgically created anastomosis between an artery and vein via prosthetic conduit(figure07).(Nagadarshini et al, 2016).
01
Figure 07: Arteriovenous graft (Lynn et al, 2015)
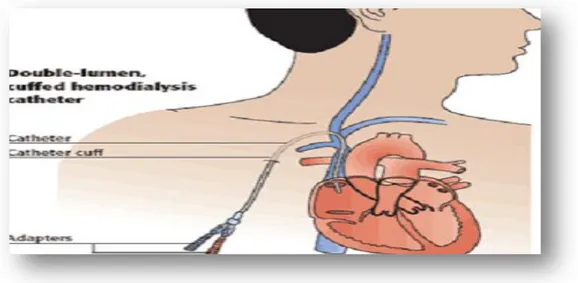
Vascular access catheter; is placed in a branch vein in the arm, neck, or just beneath the collarbone(figure08).(Vascular Access Procedure,2005).
Figure 08: Vascular access catheter option(Eileen et al ,2007). II.6.2.Supplementing treatment:
The supplementing treatment of CKD consists treatment of underling cause if possible, aggressive treatment of high blood pressure , cessation of smoking , use of pharmacological drugs and other symptoms.(Gohil et al, 2013).
II.7. Prevention of chronic kidney disease
The CKD can to decline by lifestyle modification such as diet control , weight reduction and exercises (Aminu et al, 2005), also try to reduce the number of people with prediabetes,
02
diabetes and hypertension ,the most common precursors of CKD and begin to address some of social, economic and other factors that negatively impact health.(Ann et al, 2016).
III. kidney disease and Oxidative stress
The kidney is a highly energetic organ. This makes it more vulnerable to damage caused by OS . In turn, OS is associated with kidney disease progression. Furthermore, several complications of chronic kidney disease (CKD) such as inflammation , the major cause of death in patients with CKD, are also linked to increased levels of OS.(Kristien et al, 2018). The kidneys maintain persistently high levels of mitochondrial oxidative phosphorylation and arterial blood flow, making them an environment in which ROS formation is expected (Agarwal, 2003).
In ERSD patients the antioxidant-pro-oxidant balance is shifted toward an increased oxidative stress. Several antioxidant systems have been shown to be deficient in patients with chronic renal insufficiency. Reduced levels of vitamin C are present, in part due to a dietary restriction of fresh fruits and vegetables to avoid hyperkalemia, and vitamin E intracellular levels are low, selenium levels are reduced, and there is a deficiency in the glutathione system (Davis et al, 2005 ).
The imbalance in pro- and anti-oxidant capacities in these patients results in excess production of ROS in the blood (Nguyen et al, 1985 ) , and neutrophils in uremic patients produce more ROS when stimulated (Davis et al, 2005).
The oxidant stress in dialysis patients causes increases in malondialdehyde, oxidized LDL, and increases in antibodies against oxidized LDL (Locatelli et al, 2003).
V. Inflammation in Hemodialysis patients and oxidative stress
Oxidative stress in renal failure has been associated with hypertension endothelial dysfunction , decreased erythrocyte lifespan , and atherosclerosis and inflammation (Davis et al, 2005 ).
The inflammatory cells are then a source of free radicals in the forms of reactive oxygen and nitrogen species, although reactive oxygen species (ROS) are considered the most common. The highly reactive ROS are capable of damaging various structures and functional pathways in cells (Small et al, 2013 ). Moreover the inflammation is a redox-sensitive mechanism, as oxidative stress is able to activate transcriptor factors such as NF-kB, which regulates inflammatory mediator gene expression. NF-kB is a dimer factor maintained inactivated in the cytoplasm by binding to inhibitory proteins (members of I-kB family).(Victoria et al, 2008).
03
The causes of inflammation in dialysis patients include both factors arising from dialysis itself (efficiency and biocompatibility issues) as well as others that are non-dialysis related, such as advanced age and diabetes, renal disease and uremia perse (Vassilis et al, 2009). ESRD patients have increased levels of inflammation-related proteins, such as interleukin-6 (IL-6), tumor necrosis factor-a (TNF-a) and C-reactive protein(CRP) and are subjected to enhanced oxidative stress as aresult of both insufficient anti-oxidant defence mechanisms and excessive generation of oxidant compounds (Spittle et al, 2001).
Components of the inflammatory response associated with hemodialysis (HD) method include neutrophil activation due to interaction between blood and dialysis membranes with consequent increased synthesis and release of pro-inflammatory cytokines (IL-1â, IL-6, TNF-a), poor quality of dialysis water, back filtration of contaminated dialysate to the blood compartment, intravenous iron therapyand presence of foreign bodies (access graft, centralvenous hemodialysis catheter) (Francesco et al, 2003).
In addition, there is a strong relationship between inflammation and oxidative stress in this patient population, as both are related to endothelial dysfunction, and reactive oxygen species (ROS),lipid and protein oxidation products as well as advanced glycation end-products (AGEs) are generated in response to inflammatory stimuli (Mezzano et al, 2001).
ExpErimEntal
part
71
Part 1: Patients study I.1.1. Risk factors study I.1.1.1.The study duration
The duration of this study was taken 8 month which was started from September 2018 to april 2019 at hemodialysis service of Saad Dahleb hospital (Djamaa) and medical analysis laboratory of the hospital of Saad Dahleb in Djamaa , Bachir Ben Naser –El-Oued and biological laboratory of science of nature and life faculty at university of Echahid Hamma Lakhdar El-Oued.
I.1.1.2.Region of the study
Theregion of Oued Righ is a valley situated in the North east of the Algeria sahara. It covers a South North axis whose latitude is 32°,54' to 39°,9'North and longitude 05°,50 to 05°,75 east.this region is divided naturally into bloks called trios: upper Oued Righ (Touggort), in the middle( Djamaa) and in lower of this region (M'gheir region) (Abdelkader and Hamid, 2012).
Our study was conducted in the Middle of Oued Righ(the Djamaa region). which is limited to the North by El M'gheir, East by Oued Souf to the west by Ouled Djellal and in the south by Touggourt region(Abdelfatah , 2008)(figure09).
71
Concerning a questionnaire (annex01) and statistical study, our work was conducted on 77 voluntary individual divided into 2 groups, group 1 (41 persons reserved as a control recruited from our entourage) and group 2 (36hemodialysis patients) represented mean the age 46.32 years their origin cover all Djamaa region. This population are recruited by Hemodialysis service, they are represented CKD confirmed by the diagnosis kidney echography (Annex 38) and nephrologists doctor of Hospital SAAD SAHLEB Djamaa.
I.1.2. Biological study
Our biological study is carried out on 41 volunteers person of mean age 45.05 ± 2.65 years ,were divided into 21 healthy control with mean age 39.00 ± 3.41 years , the other group of 20 hemodialysis patients of hospital Saad Dahleb –Djamaa with mean age 51.40 ± 3.64 years.
Inclusion criteria
Voluntary persons live in the Djamaa region.
The control voluntary does not have any kidney pathology. Hemodialysis patients diagnosis by nephrography.
Exclusion criteria
Voluntary live in other region. Control less than 18 years.
Control has a previous renal or other diseases. I.1.2.1. Reagents
Sodium chloride (NACL), Hydrochloridacide (HCL), Hydrogene peroxide (H2O2),
Thiobarbituricacide (TBA), Methanol, Coomassie Blue, Butylatedhydroxytoluene(BHT), Trichloroacetic acid (TCA), Phosphate-buffered (KH2PO4, K2HPO4), Ascorbic acid,
Ethylenediamintetraaceticacid (EDTA), Coppersulphate(CuSO4) , Fecl3 and potassium
fericianure. I.1.2.2. Methods
I.1.2.2.1. Data collection
For epidemiological study, we have distributed for all volunteers our questionnaire which contains some social and clinical data that can show us different factor associated with CKD .
71
For biological study, blood sampling is done in the morning for both groups, whether for control or hemodialysis, but for the last group their sampling is done before and after dialysis, after this operation we collected the samples blood in two types of tubes:
In anticoagulant (EDTA) tubes for hematological (FNS) and oxidative stress (MDA , GSH, Catalase) markers assay.
In dry tubes, samples are centrifuged at 3000 rpm for 10 minutes to obtain the serum and utilized for urea, creatinine, calcium, ionogram analysis and ORAC activity assay.
Part 2: Qualitative study of water in different area of Djamaa region I.2.1.Samples collection
to obtained some comparatives informations of drinking water quality, a snapshot study was done on 3 drinking water samples of 29 samples divided between 12 the spring water, 13 tap water (TW) and 4 filtered water (FW) which obtained from deferents regions in Djamaa according to an orderly sampling method, these regions were represented in Djamaa maps. this experimental study was conducted in the ADE laboratory in El Oued unite since 6 month (September 2018 to February 2019)
I.2.2. Methods of testing
I.2.2.1. Conductivity measurement
It is measured by electric method to the conductivity of water determination where The results are displayed directly by the conductimetere an µS with the temperature measured(Determination of electrical conductivity,NA 749 ).
I.2.2.2. Sodium ( Na) And Potassium (K) assay
Flame atomic absorption spectrometry for the sodium and potassium dosing in drinking water, raw water, and spring water. The results are displayed directly by the spectrometer in mg/l of Na or K
02
Titrimetric method for the determination of chlorides dissolved in water with AgNO3 and
K2CrO4 (Mohr's method,ISO 9297 – NA 6917) and of the calcium by Sodium Hydroxide and
EDTA(1984 (F) Calcium Assay - EDTA Titrimetric Method ISO 6058), the results measured by formula:
Cl (mg/l) Ca (mg/l) .Fc.103.F
I.2.2.4. Iron (Fe) assay
A specifies spectrometric method for phenantroline for the determination of iron in water. The intensity of the staining is proportional to the amount of the iron and the results are displayed directly by the spectrometer in mg / l of iron.(Determination of iron ,ISO 6332)
Part 3: Effect of water on renal function in rats I.3.1. Animals and treatment
Nine females rats with weight (181.74± 6.96 ) were bought from animals service of Pasteur institute in Algeria , they are installed in faculty SNV ,university of El Oued, Algeria in plastic cages divided in three groups of 3 rats of each. They kept in the animals breeding house for adaptation.
The animals were adapted to laboratory condition photoperiod (12 h of night/12h of Light), an ambient temperature of 22 ± 03 °Cand humidity of (63.2 ± 14 )% for two weeks. The standard diet and water are free for the animals during period of adaption.
I.3.2.Experimental Design
After the duration of adaption (2 weeks) ,we are distributed the rats an three groups and distinguished between its by three types of drinking water which are the axis of this study during 60 days.
group1 ;rats receive the mineral water in drinking as control. group2;rats receive the tap water (TW)
group3;rats receive the filtered water (FW) contained " Hypersperse 700-11"which is a viscous solution as the interscalant product we are prepared it by dilution method 1/20 by original solution.
07
to avoid the precipitation of chlorine in the tubes of the installation.
The evaluation of body weight was controlled during the eight weeks of the experiment. I.3.3. Blood collection and tissue preparation
At the end of 8th week of experiment the animals were fasted for 16 h, anesthetized by chloroform inhalation then sacrificed by decapitation. The blood was collected in EDTA tubes for hematological analysis and in dry tubes for urea, creatinine, calcium and electrolytes levels assay.
The serum was obtained by blood centrifuging at 3000 rpm for 10 min and frozen at 20 °C until the use.
In addition, One gram of kidney from each rat of the different experiment groups was used. The tissues were milled and homogenized in 9 ml of buffer solution of TBS (50 mM Tris, 150 mM NaCl, pH 7.4). The tissue suspension was centrifuged at 9 000 rpm for 15 min at 4 °C the supernatant obtained was stored at -20 until use for the oxidative stress marker assay.
I.3.4. Measurement of biological Markers I.3.4.1. Biochemical parameter assay
Serum urea , creatinine, calcium parameters levels were determined by autoanalysis( BIOLIS24j ) use commercial kit from spinreact , spain ( ref: urea-20141 , creatinine-20151 , calcium-20051 ) .
I.3.4.2. Method of Hematological analysis
Hematological analysis (FNS ) is performed by the hematology autoanalyzer (Sysmex ) . I.3.4.3. Method of electrolytes analysis
Determination of the ionogram parameter ( Sodium , potassium and chlorine ) by Automatic electrolyte analyzer ( Easylute ) .
00
I.3.4.4.1. Preparation of erythrocyte homogenate
After displacement of the blood sample, the spittoons are made up to 50 ml with SLR (10 mM Tris-HCl pH 7.5, 10 mM NaCl) and incubated for 30 minutes in the freezer. then centrifuged at 3900 rpm for 20 min and obtained supernant ( erythrocyte homogenate ) was used for the determination of antioxidant activity .
I.3.4.4.2. Leukocyte separation
After separation of the erythrocytes, the previous operation (removal of the supernatant) is repeated almost twice. if red blood cells persist in the pellet, carry out an additional washing with a lysis buffer until the leucocyte coupling and then recover to perform the stress tests and protein concentration .
I.3.4.4.3. Determination of protein concentration principle
protein concentration was measured according to the method of Bradford M.M., 1976 that uses comassie blue complex ( the appearance of the blue color reflects the degree of ionization of the medium and the intensity corresponds to the concentration of the proteins). Operating mode
Take 0.04mlof leukocyte homogenate. Add 2ml of Coomassie Blue.
Waiting 5 min for color stabilization. Read the opical density at595nm,
The obtained optical density is reported on a calibration curve previously drawn. The concentration of the protein is determined by comparison with a standard range of bovine serum albumin ( 1mg/ml) previously carried out under the same conditions.(annex.02.) I.3.4.4.4.Determination of malondialdehyde level
The malondialdehyde was measured according the method of (YAGI,1976), The method is based on the reaction between the carbonyl compounds of malondialdehyde with thiobarbituric acid to give absorbent pink chromophores at 532 nm. MDA level was expressed as nmol of MDA/mg prot.
02
The level of reduced Glutathion is determined according the WEAK and CORY (1988).by measuring the optical density results from the formation of 2-nitro-5-mercocapturic acid from the reduction of dithio-bis-2-nitrobenzoic acid, which is called Ellman reagent with SH groups exist in GSH briefly.
800µl of homogenate samples are add to 200µl of salicylic acid (0.25%). The mixture was centrifuge at 1000 rpm for 5 min.
Take 500 ml of supernatant and mixed with 1000µl of tris buffer(tris 0.4mol,0.02mol NaCl ,Ph =8.9 ) and 25 µl of DTNB (0.01 mol/L).
Read the absorbance at 412 nm after 5 min of incubation .
OD : Optical Density.
1.525 : total volume of blend an ml.
13133: Absorption constant of SH groups at 412 nm. 0.5 : volume of solution float an ml.
1 : volume of protein mixture .
0.8: volume of homogeneous solution without protein exists in 1 ml. GSH : concentration of glutathione.
I.3.4.4.6. Glutathione-S-transferase (GST)Activity assay
GST activity was measured spectrophotometrically by the method of (Habig et al,1974) . based on the formation kinetics of a complex between a GST substrate: 1-chloro-2-4-dinitrobenzene (CDNB) and GSH. 50 µl of CDNB(0.02M) was mixed with 850µl and 830 µl of phosphate buffer in blank and test tube respectively, then 100 µl of GSH(0.1M) was added to mixture , 20µl of homogenate was puted test tubes. results are measured each1 min during 5 min. The complex formed can be visualized by increasing the optical density at a 340 nm. The GST activity was expressed as nmol CDNB /min/mg prot
02
I.3.4.4.7. Determination of superoxide dismutase activity assay
The assay method of SOD activity using the NBT by the superoxide anion (O2 .), is used as a
basis for detecting of presence of SOD by measuring the spectrophotometrically absorbance at 560 nm.( Beauchamp and Fridovich,1971)
Collect in tubes Blank (In the dark) Sample(Illuminated tube)
Concentration in the reaction
medium
EDTA-Met 1000µL 1000µL 0,1mM EDTA
Phosphate buffer 892,2µL 892,2µL 13mM Met
Sample 0 50 /
Phosphate buffer 1000µL 950µl 50Mm
NBT 85,2µL 85,2µL 75µM
riboflavin 22,6µL 22,6µL 2µM
Expression of results :
I.3.4.4.8. Determination of enzymatic activity of catalase
The catalase activity consists in measuring the catalase-induced loss of H2O2 contained in the sample by measuring the absorbance of H2O2 at 560 nm using a UV /visible spectrophotometer. Briefly In test tubes mix 1 ml of phosphate buffer (KH2PO4, 0.1 M, pH 7.2), 0.975 ml of freshly prepared H2O2 (0.091 M) and 0.025 ml of the enzyme source (homogenate). The absorbance is read at 560nm each minute for 2 minutes.
(( ) ( ))
02
A2: Absorbance at the second minute. T: Time interval in minutes
I.3.4.4.9. Determination of antioxidant power ORAC a. principle
The total antioxidant power of the serum,its capacity to absorb free oxygen radicals (ORAC: Oxygen Radical Absorbance Capacity), is estimated by the ability of red blood cells to resist free radical-induced hemolysis in vitro in the presence of plasma according to the method of Oyaizu, M. (1986). This method is based on the time-dependent monitoring of red blood cell hemolysis induced by a free radical generator..
b. Treatment of redbloodcells
• Centrifuge donor blood at 2000 rpm for 10 min and remove plasma.
• Wash gently 1 volume of the pellet with 2 volumes of physiological saline (without lysing the RBCs), then centrifuge again at 2000 rpm for 5 min.
c. Operating mode Control tube
• Add 1 ml of RC: 20 μl of CuSO4 (2 mM), 20 μl of H2O2 (30%) and 2 ml of physiological saline, then stir gently.
Incubate for 5 min at room temperature, centrifuge for 5 min at 2000 rpm.
• Read the OD at 450 nm from the supernatant and put it back into the tube and stir gently. • Repeat this operation every 10 minutes for 1 hour.
Standard tube
• To 1 ml of RC are added: 20 μl of CuSO4 (2 mM), 20 μl of H2O2 (30%) and 2 ml of physiological saline, and 20 μl of vitamin C (400 μM) and then stir gently.
Incubate for 5 min at room temperature, centrifuge for 5 min at 2000 rpm.
02
Test tube
• To 1 ml of RC are added: 20 μl of CuSO4 (2 mM), 20 μl of H2O2 (30%) and 2 ml of physiological saline, and 20 μl of serum (400 μM) and then stir gently.
Incubate for 5 min at room temperature, centrifuge for 5 min at 2000 rpm.
• Read the OD at 450 nm from the supernatant and put it back into the tube and stir gently. • Repeat this operation every 10 min for 1 hour (t0, t10, t20, t30, t40, t50, t60, and average the latter:
• ΣDO = Σ (t0, t10, t20, t30, t40, t50, t60) / 7
• To calculate the total antioxidant power using two methods. Calculate method
I.3.4.4.10. Determination of ferric reducing antioxidant power(FRAP)method.
500µl of serum and 1.25 ml of buffer solution 6,6 (0.2M) add to 1.25 potassium fericianure and incubation 20 min in Bain Marie at 50 C°.also, 1.25 ml of aqueous TCA solution is added to stop the reaction and centrifugation 3000rpm/10 min .after we add:
1.25 ml of supernatant
1.25 ml of distilled water
1.25 ml of FeCL3(0.1%)
And reading an UV visible at 700 nm against a blank
Blank: similarly prepared but replace the sample with distilled water to calibrate the device. Statistical analysis
The statistical evaluation was carried out by the student's t test using Minitab 14 statistical packagen ,OR risk factored regression analysis using SPSS statistics 25 and the Excel 2007 (Microsoft). The values were given as mean±SEM .Statistical significance was defined as P<0.05
82
II. Results
II.1. patients study
II.1.1. Description of study population
In our study we are chose population are characterized by many different characters are shown in table 02 ( age, weight, sex ,social case, job, education level, blood group ).We are selected 36 hemodialysis patients and 41 controls , after statistical analysis we are obtained the results showed in table below.
Table (02) : Description of study population
control Patients
Age 46.61 ± 2.84 46.03 ± 2.95
Body weight 61.20 ± 2.09 59.96 ± 2.62
sex Men% 16.88 23.38
Women% 36.36 23.38
Social case Married% 29.870 29.870
Single% 23.376 15.584
job Worker% 19.480 14.285
unemployed% 33.766 32.467
Educational level primary% 5.194 25.974
medium% 7.792 5.194 High school % 19.480 12.987 High education% 20.779 2.597 Blood group A% 18.181 7.791 B% 10.389 10.388 AB% 7.791 3.896 O% 16.882 18.181