Design and verification of the
Far Ultraviolet Spectrographic Imager (FUV-SI) for the IMAGE mission
Etienne RENOTTE, Serge HABRAKEN, Pierre ROCHUS,
Marie-Laure HELLIN, Anne ORBAN, Isabelle TYCHON
Centre Spatial de Liège (CSL), Avenue du Pré-Aily, B-4031 Liege-Angleur, Belgium.
Tel. ++32 4 367 66 68, Fax. ++32 4 367 56 13, e-mail: erenotte@ulg.ac.be, http://www.ulg.ac.be/cslulg/
ABSTRACT
The IMAGE FUV-SI is simultaneously imaging auroras at 121.8 nm (hot proton precipitation) and 135.8 nm (electron auroras). The spectrograph design challenge is the efficient rejection of the intense Lyman-alpha emission at 121.6 nm while passing its Doppler-shifted component at 121.8 nm. The FUV-SI opto-mechanical design, analysis, integration, and verification of performances against environment (thermal and vibration) are discussed in this paper. In absence of STM (protoflight philosophy) environmental constraints at subsystem levels are derived analytically from F.E.M. and used for pre-qualifying optical subsystems.
Keywords:
UV spectrograph, opto-mechanical design, environmental testing, F.E.M.1. INTRODUCTION
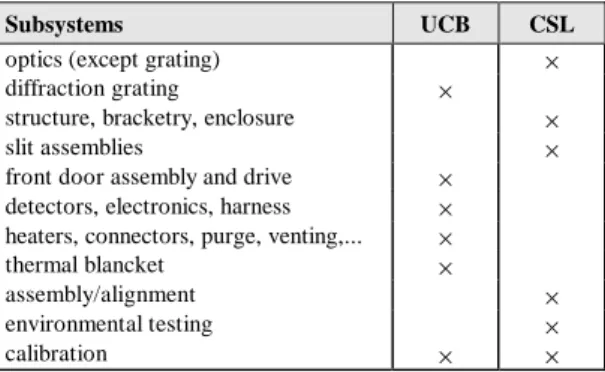
Table 1: FUV-SI organisational responsibilities.
Subsystems UCB CSL
optics (except grating) ×
diffraction grating ×
structure, bracketry, enclosure ×
slit assemblies ×
front door assembly and drive ×
detectors, electronics, harness ×
heaters, connectors, purge, venting,... ×
thermal blancket ×
assembly/alignment ×
environmental testing ×
calibration × ×
The Far Ultraviolet system (FUV) is an experiment which forms part of the instrument package for IMAGE, a NASA/MIDEX mission due for launch in 2000. The FUV system consists of four major sub-assemblies, namely, a Spectrographic Imager (FUV-SI), a Wideband Imaging Camera (FUV-WIC), a geocorona sensor (FUV-GEO), and a Main Electronic Package (FUV-MEP). The FUV-SI was developed by a U.S./Belgian team led by the Space Sciences Lab. of the University of California, Berkeley (UCB). The distribution of responsibilities between UCB and CSL is summarised in Table 1.
The development of the FUV-SI instrument has been facing a number of technical challenges :
1°) the scientific objectives requires the isolation of the 121.8 nm auroral emission while efficiently blocking the 100 times more intense Lyman-α line, 0.2 nm apart; moreover the 121.8 nm radiation is not available from standard sources;
2°) the unusual configuration of this instrument: contrarily to most spectro-imagers the FUV-SI consists of a monochromator followed by imagers; this implies the practical issue that the useful wavelength is needed to align the so-called back-imagers;
3°) the model philosophy foresaw only one proto-flight model (PFM) so that the conditions (vibrations and thermal) applied to the sub-assemblies were not known until the availability of the end model;
4°) last but not least the production schedule was accounting only 10 months from the design approval (CDR) to the delivery of the fully integrated, aligned, and verified instrument to U.C. Berkeley.
This paper reviews the structural design, integration and verification sequence of the FUV-SI.
2. DESIGN REVIEW
2.1 Instrumental configuration
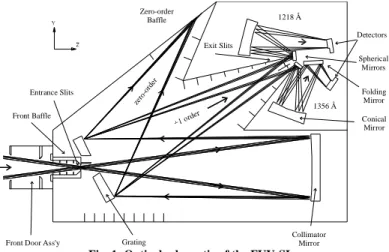
The FUV-SI basically consists of a Wadsworth monochromator (actually a bi-chromator) that isolates the 1218Å and 1356Å emissions and directs them into respective twin imagers. In turn the imagers relay onto the detectors an intermediate image of the earth (auroral oval) formed by the collimator about the grating. The separation and imaging principle is depicted in Fig. 1. The optical design of the SI was described in a previous paper [1].
From a configuration point of view, the FUV-SI instrument is made of three main parts: the monochromator, the back-imagers, and the detectors. The MCP cross-delay line detectors were developed at U.C. Berkeley and are described in a companion paper [3].
The reason for structurally separating the monochromator from the back-imager is found in the practical difficulty of aligning the five optical elements of the back-imager when assembled to the monochromator. Therefore the back-imager is using an independent optical bench that is mounted onto the principal baseplate. This configuration enables the pre-alignment, with visible light, of the back-imager independently of the monochromator leaving only two adjustments (fine focus of the "conical mirrors") to be performed in vacuum UV after assembly. The alignment of the FUV-SI is presented by Habraken [2] in an associate paper.
Front Door Ass'y Front Baffle Entrance Slits Grating Collimator Mirror Zero-order Baffle Exit Slits Conical Mirror Spherical Mirrors Folding Mirror Detectors 1218 Å 1356 Å zero -ord er
Fig. 1: Optical schematic of the FUV-SI. 2.2 Structural design
The monochromator structure, that is the instrument main structure, consists of a sandwich baseplate that mounts onto the spacecraft deck on three kinematic legs. The baseplate is made of a 60 mm thick aluminium honeycomb sandwiched between two aluminium facesheets of 0.6 mm. The total mass of the baseplate is 2.75 kg, including inserts, that is equivalent to a density of 0.15. The legs are made of titanium alloy Ti6Al4V. Legs are so designed that they are able to flex radially in case of temperature gradient between the SI and the spacecraft mounting surface. Moreover they are connected to the baseplate through teflon-coated spherical bearings so that virtually no bending moment can be transmitted to the baseplate.
The baseplate holds the front flange, grating assembly, collimator assembly, exit slit assembly, back-imager, baffles, and enclosure. All these sub-assemblies are bolted to inserts bounded into the honeycomb.
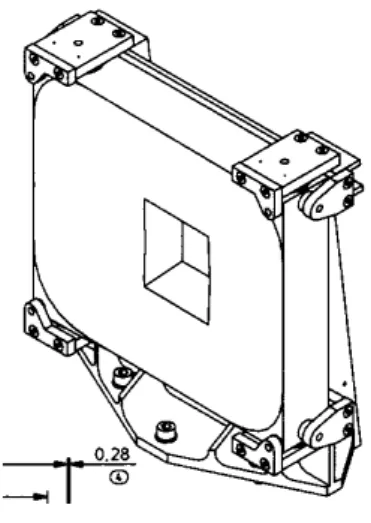
Fig. 2: Back-imager CAD view. (Courtesy of OIP n.v., Oudenarde, Belgium)
The front flange is a monolithic piece of aluminium that holds the front door and fore baffle assembly on one side; and the entrance baffle and entrance slit grill on the other side. During alignment the entrance baffle holding the entrance slit grill was able to translate about horizontal axis and rotate around optical axis thanks to two DC micro-motors. When the best position was obtained fixation screws have been locked and motors removed. The fore baffle is machined out of Noryl™ . It includes a remote controlled door for contamination prevention. This door is actually a MgF2 window so
that failure of the door mechanism (the only one within the SI) has non-fatal issue but a loss of sensitivity.
The exit slit column holds the exit slits and provide an additional support to the enclosure.
The back-imager (Fig. 2) uses an independent aluminium bench that interfaces with the main baseplate through six fasteners and two centring pins. The bench has a rib pattern machined in its bottom face reducing its mass to 1.16kg for a thickness of 20.5mm. It holds the five optical elements of the back-imager and the detector holding frame. This last piece shares four of the six back-imager fasteners for supporting the heavy detectors (Table 2). The detectors are mounted to the rear frame (Fig. 2) of the back-imager with four M5 fasteners torqued at 4.8Nm. Thermal-isolation spacer and viton O-ring seal the detector interface.
The total mass of the instrument is < 20 kg.
Table 2: FUV-SI mass properties.
Part Mass (g)
Front door assembly 470 e
Optical components 3239 c
Structure & brackets 11300 m
Detectors & electronics 3000 m
Accessories 1575 e
Total : 19584
2.3 Optics and Mounts
The grating and the collimator are the largest optical elements. With solid volume of 840 and 1125 cm³ respectively lightweighting was required to reduce inertial loads during launch and save mass on the instrument. Both are in the monochromator where the amount of scattered light shall be minimised. Consequently glass materials were selected with regards to superior polishing capabilities with respect to metal. One of the commonly accepted measurements used to quantify scattered radiation of reflective surfaces is the Total Integrated Scatter (TIS) defined as the ratio of the total scattered power to the total reflected power. The TIS figure is related to the r.m.s. roughness through [6]: 2 i cos 4 specular diffuse diffuse TIS λ θ σ π ≈ + = ; (1)
where σ is the r.m.s. roughness of the reflective surface, λ is the wavelength of light being scattered, and θi is the angle of incidence,
assumed normal to the surface (cos θi = 1). Taking λ = 1216Å, it yields:
σr.m.s. < 10Å for TIS < 1%.
This requirement for a 10Å superpolish was confirmed by simulations on ASAP
straylight analysis software.
The grating blank material is Schott NG5. This dark glass was chosen by Zeiss
(Germany), the grating manufacturer, with regard to holographic recording considerations (no bulk effect). Its mechanical properties are similar to common glasses. The FUV-SI grating is a quite unique optical element that features a number of fabrication challenges: high line density (3600 grooves/mm) on a spherical optic surface, machined rib pattern in its back, central cut-out for input beam access, and UV enhanced coating (Al + MgF2).
The grating is clamped at its four corners onto a titanium bracket (Fig. 3). The difference of CTE between NG5 and titanium (alloy Ti6Al4V) is compensated by inserting Kel-F thermoplastic pads between glass and metal. For each direction the thickness of the thermoplastic pads is calculated by:
Ti F Kel 5 NG Ti 5 NG F Kel L L α − α α − α = − − , (2)
where α designates the CTE of the different materials and L the lengths for a given direction. This design gives strictly zero thermally-induced stress for uniform temperature changes.
Fig. 3: Grating assembly (AMOS s.a.).
Fig. 4: Rear view of the collimator assembly (AMOS s.a.): • mirror, ‚ bracket, „ cramp.
The collimator blank material is Corning BSC B.1664. This material was chosen for its availability under schedule constraints and for its CTE (6.8 ppm/C°) that is relatively high that helps for matching the aluminium CTE. The machined rib pattern in the back was designed to accommodate a three mounting system (Fig. 4). Titanium clamps are glued at three T junctions of the rib pattern. This design provides for stiffness of the glass/metal interface. Each clamp include a small spherical bearing linked to the aluminium bracket through a titanium flexure blade.
The back-imager subsystem is less sensitive to scattered radiation since only the useful monochromatic radiations are passing the exit slits. Therefore aluminium AA6061 was selected for blank material of the spherical and folding mirrors for compactness sake. They however feature an excellent r.m.s. roughness of 2 nm. These three elements are three-point bolted to a common bracket (Fig. 5).
Except the grating the two 'conical' mirrors were the most critical items. Since they are off-axis and symetrical they were cut out of a single large elliptical blank. A specific holographic null corrector was designed to verify their figure. The back is single-arch shaped for accommodating a central mounting. A circular boring is arranged at the back for bounding a stainless steel holder that is in turn bolted to the aluminium bracket at three flexures (Fig. 6).
Fig. 5: Spheric & flat mirror assembly (OIP n.v.): • helicoil, ‚&ƒ washers, „ spheric mirror,
… flat mirror, † bracket, ˆ&‰ fasteners.
Fig. 6: Conical mirror assembly (OIP n.v.): • conical mirror, ‚&ƒ washers, „ bracket,
… centring screw, †&‡ fasteners.
The entrance and exit slit grills were made by electro-forming a 40µm thick nickel sheet. The measured fabrication accuracy was better than 5µm on slit width and grill period. The entrance slit grill is mounted at the end of the entrance baffle overhanging within the grating cut-out. The 1356Å exit slit consists of a wide rectangular opening defined by a chamfered frame. The 1218Å exit grill is pined to the exit slit column and maintained by a thin aluminium frame.
2.4 Straylight Design
Fig. 7: Screening and baffles within the FUV-SI, enclosure shown in dashed lines.
The entrance of the instrument is restricted by a forebaffle that defines a rectangular opening and stops direct rays out of the instrument field of view (FOV). The entrance baffle consists of four successive vanes before the slit grill.
Fig. 7 shows the baffles and screens used to reduce straylight inside the monochromator cavity and isolate the back-imager. Vanes are arranged to the left of the back-imager to trap the zero order of the grating. Other vanes are located to prevent direct and second-order light paths to the back-imager.
The baffles were machined out of aluminium (alloy 6061T6), then submitted to heat treatments to remove the twists induced by the machining of thin faces. Afterwards, as all aluminium surfaces, they were black-anodised with inorganic dyes.
The enclosure was made by embossing a 0.6mm aluminium sheet. It includes grooves for stiffness improvement.
The straylight design was tested succesfully against off-axis UV sources and in-line visible light. It must be noticed however that the detectors are almost solar blind.
2.5 Thermal Design
The FUV-SI shall survive temperature excursions from -30°C to +40°C (non-operational range) and shall meet its performance requirements between -10°C and +30°C (operational range). The SI will be mounted onto the spacecraft honeycomb deckplate that is entirely included within the solar panels except a rectangular opening for the field of view. Since we did not have a sufficient knowledge of the spacecraft thermal design we decided to implement active thermal control and thermal isolation on the FUV-SI. The instrument is wrapped in a MLI thermal blanket (ε ≈ 0.02) that is mainly viewing at the internal walls of the spacecraft. The radiation loss to spacecraft interior (assumed at -10°C) is given by QS/C = σ× A ×ε× (T
4 1 - T 4 0) = 5.67 10 -8× 1.2 × 0.02 × (2934 - 2634) = 3.52 Watts, where σ = 5.67 10-8 W/m2 K4 is the Stefan-Boltzman constant. The forebaffle is the only opening to cold space. The front surface is made of
aluminium (ε≈ 0.12) and is about 250 cm². The heat loss to cold space is estimated by Qspace = σ× A ×ε× T 4
= 5.72 10-8× 0.025 × 0.12 × (293)4 = 1.254 Watts. The thermal resistance of one titanium leg is estimated at ∼ 45K/W, which is calculated by integrating the thermal conductivity of titanium (6 W/mK) along the leg profile; the conduction through bearing is neglected. Since the three legs are mounted in parallel the total resistance is 15K/W. Hence the conduction loss through the feet is estimated Qfeet = ∆T/R = 30/15 = 2 Watts. The total
detectors are conductively isolated from the SI and strapped to the spacecraft so that they are neglected for the calculation of the heater power requirement. Subsequently the active thermal control consists of two 'survival' heaters that are powered by the spacecraft and two 'thermal control' heaters powered by the FUV-MEP. In addition there are bake-out heaters fastened to the grating and collimator brackets (2 × 5W on each bracket). The survival heaters are Minco pasted respectively on the baseplate (8W) and on the back-imager bench (3.4W). They are controlled through autonomous thermostats that close at -10°C. The thermal control heaters are two 5W Minco pasted in the vicinity of optical elements (grating and collimator).
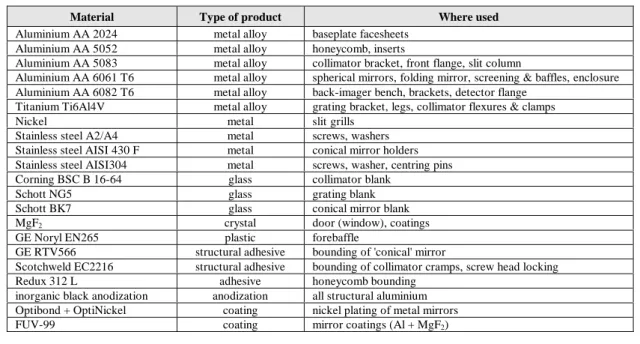
Table 3: FUV-SI main materials list.
Material Type of product Where used
Aluminium AA 2024 metal alloy baseplate facesheets
Aluminium AA 5052 metal alloy honeycomb, inserts
Aluminium AA 5083 metal alloy collimator bracket, front flange, slit column
Aluminium AA 6061 T6 metal alloy spherical mirrors, folding mirror, screening & baffles, enclosure
Aluminium AA 6082 T6 metal alloy back-imager bench, brackets, detector flange
Titanium Ti6Al4V metal alloy grating bracket, legs, collimator flexures & clamps
Nickel metal slit grills
Stainless steel A2/A4 metal screws, washers
Stainless steel AISI 430 F metal conical mirror holders
Stainless steel AISI304 metal screws, washer, centring pins
Corning BSC B 16-64 glass collimator blank
Schott NG5 glass grating blank
Schott BK7 glass conical mirror blank
MgF2 crystal door (window), coatings
GE Noryl EN265 plastic forebaffle
GE RTV566 structural adhesive bounding of 'conical' mirror
Scotchweld EC2216 structural adhesive bounding of collimator cramps, screw head locking
Redux 312 L adhesive honeycomb bounding
inorganic black anodization anodization all structural aluminium
Optibond + OptiNickel coating nickel plating of metal mirrors
FUV-99 coating mirror coatings (Al + MgF2)
3. INTEGRATION & TEST OVERVIEW
The "integration & verification campaign" is summarised in the flow chart of Fig. 8. The detailed drawing and manufacturing of items under CSL responsbilities was basically made at two Belgian subcontractors, i.e. AMOS s.a. for the monochromator, and DSS-OIP n.v. for the back-imager. The subcontractors were also responsible for assembling their respective subsystem according to specifications given by CSL. Moreover, DSS-OIP performed a pre-alignment of the back-imager using four visible point-sources located at the intermediate image formed by the monochromator and a visible detector simulator provided by U.C. Berkeley. Integration of the instrument was conducted in CSL cleanroom where a specific clean area (~ class 100) was arranged arround a 1m³ vacuum chamber. Most alignments and verifications were performed in vacuum-UV using remote devices. Accurate mechanical pre-positioning and visible pre-alignments greatly simplified the vacuum operations by minimising the number of remote motions. Optical integrations, alignment, GSE, and verification of performances are presented in details by Habraken [2] in a companion paper. At the time this paper is being written the environmental tests are completed and the flight detectors are about to be delivered to CSL. The remaining tests are the "field of view calibration" and the "response calibration". The rest of this paper, that is mainly devoted to the mechanical design and verification of the FUV-SI, will concentrate on the results of the environmental tests performed at CSL.
Grating, Test Slits,
Alignment Detector Flight Slits Mechanical assembly of Back-imagers (at DSS-OIP) visible alignment of Back-imagers (at DSS-OIP) Proto Detectors Mechanical assembly of Wadsworth Spectrograph (at AMOS) diffraction efficiency,
fine alignment of Slits
UV alignment of
Back-imagers
environmental tests (TV, TB, Vibration)
Front door, Enclosure
FOV calibration
Flight Detectors
response calibration mirror reflecivity on samples
Collimator alignment
packaging, delivery to UCB
4. VIBRATION
4.1 Bracketry
With reference to the protoflight model philosophy the design of the grating and collimator mounts had to be verified as soon as possible. Therefore we released the fabrication of these two brackets, together with dummy optical elements, immediately after the Critical Design Review (CDR). So that, the flight grating bracket and a dummy grating were available for shake test in September 1997, i.e. well before the availability of the main structure.
At that time we had only vibration specifications applicable to the overall instrument. Since no structural model had been developed we could not assess vibration levels that apply to subsystems from experimental measurements. Therefore we derived the transfer function of the instrument from the F.E.M. performed by the monochromator subcontractor. For this calculation we assume the acceleration at the mounting surface of the subsystems (SI baseplate) as equal to the acceleration at the centre of gravity (CG) of the equipment.
Expressing the shaker force we find:
( )
ω =( ) ( )
ω ω=Mst aCG Mdyn ab
F (3)
where Mst is the static mass of the equipment;
aCG is the acceleration at CG of equipment;
ab is the shaker table acceleration;
Mdyn is the 'dynamic mass' (= frequency-dependent apparent mass as seen from the shaker table).
An analytical expression of the 'dynamic mass' may be given using the 'effective masses1' Meffi provided by the F.E.M. calculation
software [4, 5].
( )
∑
ζ Ω ω − Ω − ω ω − = ω i i i 2 i 2 2 i st dyn j 2 Meff MM (for a given axis) (4)
where Meffi is the 'effective mass' associated with mode i; Ωi is the natural pulsation of mode i (= 2πfi); ζi is the damping of mode i
(estimated 3%).
It gives for sine accelerations:
( )
ω =( ) ( )
ω b ω st dyn CG a M M a ; (5)and for random accelerations:
( )
ω =( )
ω b( )
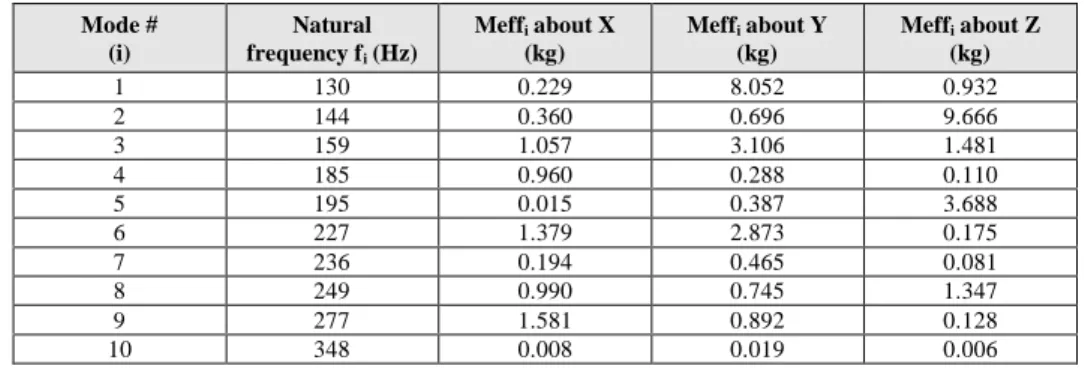
ω 2 st dyn CG PSD M M PSD . (6)Table 4 : FUV-SI first 10 natural frequencies and effective masses (calculated from F.E.M. performed by AMOS s.a.). Mode # (i) Natural frequency fi (Hz) Meffi about X (kg) Meffi about Y (kg) Meffi about Z (kg) 1 130 0.229 8.052 0.932 2 144 0.360 0.696 9.666 3 159 1.057 3.106 1.481 4 185 0.960 0.288 0.110 5 195 0.015 0.387 3.688 6 227 1.379 2.873 0.175 7 236 0.194 0.465 0.081 8 249 0.990 0.745 1.347 9 277 1.581 0.892 0.128 10 348 0.008 0.019 0.006
1 The 'effective mass' is a measure of the mass displaced by the mode. For example the effective mass associated with the inflation mode of a cylinder is zero because the displaced mass is symmetrically balanced.
8.0095 9.071021 10. 5 PSDycg f( ) PSDl f( ) 1.999 10. 3 20 10 100 f 1 10 3 1 104 1 105 1 104 1 103 0.01 0.1 1 10
Fig. 9: Estimate of PSD at CG of equipment (solid line) compared to PSD at mounting surface (dashed line). Calculated for Y-axis.
Subsequently aCG and PSDCG as calculated by (5) and (6)
are used, with convenient fittings, to specify the qualification tests of subassemblies.
Since the dynamic mass is almost equal to the static mass in the range 0-100 Hz the initial specification of sine vibration may be applied to the subsystems. Fig. 9 shows the result of this calculation for random vibration about Y-axis using data of Table 4 provided by the Monochromator Subcontractor. One can see the significant amplification of the PSD around 130 Hz that corresponds to the calculated first natural frequency of the SI and further peaks at 159 and 227 Hz corresponding to the most significant effective masses.
The PSD profile of Fig. 9 cannot be introduced as such in the shaker control software. We therefore define line shape envelopes that include those plots. They are presented in Fig. 10 with a notching of the grating and collimator first natural frequency around 200Hz. The grating assembly survived the sinusoidal vibration tests (15 G in the range 20-100 Hz) and the random vibration tests of Fig. 10.
The position of the dummy grating surface was compared to a fixed mirror after each shake. No misalignment has been found as a proof of the stability of the grating mounting. The sine sweep identified a first natural frequency at 236 Hz and damping of 1.8% when hardbolted to the vibration support. This frequency drops down to 200 Hz when mounted onto washers that is a better approximation of the mounting onto the SI baseplate (cylindrical inserts). On the other hand the collimator assembly did not survive the random shake about lateral axis. The two bottom flexure blades broke up. It is probable that the fasteners at aluminium bracket loosed. The titanium flexure blades have been redesigned, enlarging the Ti/Al contact surface and adding blocking pins. This new design was successfully tested. A first natural frequency was found at 188 Hz. The back-imager assembly was tested later on at OIP with success.
0,01 0,1 1 10 100 1000 10000 Hz G²/Hz Overall: 8.63 G r.m.s. 0,0001 0,001 0,01 0,1 1 10 100 1000 10000 Hz G²/Hz Overall: 14.22 G r.m.s. 0,0001 0,001 0,01 0,1 1 10 100 1000 10000 Hz G²/Hz Overall: 11.03 G r.m.s.
a) X axis b) Y axis c) Z axis
Fig. 10 : PSD profiles for FUV-SI subsystems (with notching as calculated for the grating assembly).
4.2 Instrument
Vibration test of the complete instrument was the first environmental test performed after completion of alignment and locking of adjustments. The test specimen is very representative of the flight unit. It is fitted with the prototype detectors that are mechanically equivalent to flight detectors. It wears neither thermal blanket nor harness. The FUV-SI is bolted to the shaker table using the same fasteners as for the spacecraft mounting, i.e. 10 fasteners of type 10-32 UNJF torqued at 6 Nm. The detector vacuum chambers were maintained under dry nitrogen purge during the whole vibration campaign.
In the meantime (since the tests of the grating and collimator) Southwest Research Institute (SwRI), the IMAGE Prime Investigator, defined new specifications that are presented in Table 5. Note that they are much lower than the ones used for testing the grating and collimator so that the tests made earlier are very conservative.
A low level sine sweep in the range from 20 to 2000 Hz revealed a first resonance around 89 Hz for Z-axis, that is much lower than the estimation provided by the F.E.M. analysis (130 Hz). There is no clear explanation of that discrepancy but a poor simulation of the friction at the three spherical bearings. The flexure of the legs is likely responsible for the first mode. Indeed the first resonance peak appears very noisy that is most probably chargeable to micro-plays at the spherical bearings. On the other hand, it seems the bearings are
filtering vibrations imposed at the basis so reducing the resonance peak amplitude by a few orders of magnitude with respect to an elastic deformation.
Table 5: FUV-SI Vibration test levels.
Frequency (Hz) Level Frequency (Hz) PSD (G²/Hz)
Thrust axis (X) 10 - 20 0.2" DA 20 0.026
20 - 100 4.0 G o-p 20 - 50 +6 dB/Oct
Lateral axes (Y,Z) 10 - 50 0.008" DA 50 - 800 0.16
50 - 100 1.0 G o-p 800 - 2000 -6 dB/Oct
2000 0.026
Overall: 14.1 G r.m.s.
a) Sine vibration. b) Random vibration.
Random vibrations were applied with convenient notching to prevent the instrument at main resonances. They are for X-axis: 0.02G²/Hz in the range from 125 to 175Hz, for Y-axis: 0.02G²/Hz in the range 50-150Hz, and for Z-axis: 0.5G in the range 50-150Hz. The FUV-SI has survived those levels but the 1218Å detector lost two fasteners (out of twenty) sealing the vacuum chamber. They were not torqued properly on this prototype model.
The test campaign was followed by a careful UV light inspection of all the fastener glue lockings and by two performance checks:
1°) verification of the Lyman-α rejection, and 2°) spot image
quality for 24 points of the field of view. In practice it is verified that the FUV-SI does not see the 1216Å line of a hydrogen source
mounted behind a MgF2 diffuser. The countrate of the 1218Å
detector is compared to the 1356Å one that can't see that radiation -by design - but the source continuum. No significant degradation of the Lyman-α rejection was observed after vibration. The figure of merit for image quality is the spot image dispersion expressed in terms of Full Width at Half Maximum (FWHM) that shall be
within ∅145µm at the detector photocathodes. This figure
significantly degraded for the 1218Å channel (> 200µm) and we first suspected a defocus of the 'conical mirror'. After a few days of investigation it was found that this performance loss was not due to a mechanical misalignment but a 'ghost image' depending on the detector threshold voltage. After adjustment of this threshold the
initial performance was recovered. Fig. 11: FUV-SI being instrumented on CSL shaker.
5. THERMAL TESTS
5.1 Thermo-elastic Tests
Table 6: Lyman-α transmission vs. temperature.
Temperature Ly-α Transmission
-20°C -10°C 0°C + Col. grad. 0°C + Grat. grad. +10°C +20°C +30°C +40°C 1.47% 1.50% 1.92% (*) 1.50% 1.50% 1.30% 1.47% 1.50% The aim of this test was to verify the performances of the instrument
(Lyman-alpha rejection and image quality) at different temperatures. The instrument temperature was cycled in the range from -20°C to +40°C and performances were measured at -20°C, -10°C, +30°C, and +40°C; the operational temperature range being -10°C to +30°C. The radiative environment used to cool down or warm the FUV-SI is provided by regulated gaseous nitrogen panels surrounding the specimen. In order to speed the thermal-vacuum sequence the FUV-SI was not wearing its thermal blanket.
As shown in Table 6 the residual transmission of the Lyman-α radiation is not depending upon instrument temperature. The two figures at 0°C are measured with the grating, respectively the collimator, being heated. The bad result at 0°C (*) is due to source instabilities.
FWHM measurements were also performed at those temperatures for 14 view angles. This test uses a different set-up where a fixed
collimated argon source is sent to the instrument that is mounted onto a two-axis rotation stage that provides for the 15°×15° FOV
covering. The argon source is mounted behind a vacuum UV monochromator for selecting the 1218Å, respectively the 1356Å, radiation. We must notice that the instrument performances in terms of FWHM are slightly improved for temperatures around 30-40°C. For the 1356Å detector the FWHM is barely in the range from 70 to 140µm as a function of temperature and view angle. The 1218Å FWHM is slightly better: 70 to 115µm with practically no field dependence. Fig. 12 a) and b) show a measure of the spot displacements on the
photocathode versus temperature. In the operational temperature range the spot displacement is within 220µm at 1218Å and within 240µm at 1356Å. Note that the detectors invert the spatial coordinates.
Peak position on detector 1218 A°
14000 16000 18000 20000 22000 24000 5000 7500 10000 12500 15000 17500 20000 22500 25000 Vertical position [µm] Horizontal position [µm] t° = -20°C t° = -10°C t° = 40°C post-vibration (reference)
Fig. 12. a) Displacement of spot image vs. temperature (1218Å detector).
Peak position on detector 1356 A°
14000 16000 18000 20000 22000 24000 26000 5000 7500 10000 12500 15000 17500 20000 22500 25000 Vertical position [µm] Horizontal position [µm] t° = -20°C t° = -10°C t° = 40°C post-vibration (reference) t° = 30°C
5.2 Thermal Balance Test
The aims of the test were to assess the thermal behaviour of the FUV-SI and to evaluate its own regulation capabilities. The test was made of two parts: 1°) an 'inert' test at room temperature; and 2°) an 'active' test in a cycled environment.
During the 'inert' test the different heaters are sequentially operated at their maximum voltage for 3 hours, the FUV-SI being fitted with its MLI thermal blanket. To enable operation of the survival heaters for temperatures above -10°C we needed to short-circuit the relevant thermostats. The evolution of temperatures are recorded by the three thermistances (type YSI-44908) installed on the SI, located respectively at the baseplate centre, grating bracket, and collimator bracket. Table 7 presents the temperature increases caused by those heaters as measured at the three thermistances. Between sequences time was allowed for room temperature recovery. It must be noticed that a temperature equilibrium was never reached. We must regret also that the heat transfer from the thermal control heaters is quite poor.
Table 7: Temperature increases after 3 hours of heater operation.
Heater that is powered up... baseplate ∆T grating bracket ∆T coll. bracket ∆T
baseplate survival heater - R1 (8W) 10.6°C 4.1°C 5.3°C
back-imager surv. heater - R2 (3.4W) 0.8°C no effect no effect
bake-out heaters - R4..R7 (5W each) 4.1°C 15.7°C 8.3°C
therm. control heater - R8 (5W, adj. to grating) 3.3°C 3.2°C 1.0°C
therm. control heater - R9 (5W, adj. to collim.) 3.6°C no effect 3.7°C
both survival heaters - R1..R2 during 4½hours 13.2°C 8°C 7.7°C
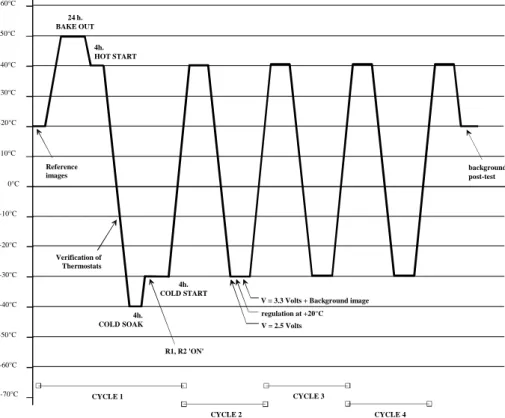
The heater thermostats are enabled before starting the 'active' thermal balance test. The active test is based on the temperature profile given in Fig. 13. The regulation is made on the FUV-SI radiative and conductive environment, i.e. on the thermal shrouds surrounding the specimen. The three feet of the SI are strapped to the bottom panel to duplicate, as far as possible, the conduction heat transfers. The detector copper straps are bolted to the thick plate of the manipulator that stays roughly at room temperature. We placed a small liquid nitrogen panel in front of the instrument field of view to duplicate cold space. In addition to the cycles the purposes of this 'active' test were to 1°) verify the proper operation of the thermostats; 2°) assess the survival heater capabilities at -30°C; 3°) assess the detector heat transfer at -30°C; 4°) attempt for bringing back the SI at room temperature using its own heaters; and 5°) take a background image at -30°C. Reference background images are taken at room temperature before starting the thermal system. The first part of the thermal sequence was a 24 hours bake-out at +50°C after 9½ hours allowed to the thermal shrouds for reaching this temperature. After 24 hours the baseplate temperature reached 43.6°C and was not yet stabilised. The detectors, that are out of the insulating blanket, were almost stabilised at 45.3°C. 0°C +10°C +20°C +30°C +40°C +50°C +60°C -10°C -20°C -30°C -40°C -50°C -60°C -70°C 24 h. BAKE OUT 4h. HOT START 4h. COLD SOAK Verification of Thermostats R1, R2 'ON' 4h. COLD START Reference images
V = 3.3 Volts + Background image regulation at +20°C V = 2.5 Volts CYCLE 1 CYCLE 2 CYCLE 3 CYCLE 4 backgrounds post-test
During the first cooling phase we controlled the closing of the survival heater circuits. Through a few iterations we found that the heaters switch ON at -6.8°C for decreasing temperature, and OFF at -1°C for increasing temperature; as measured with the baseplate thermistance. Note that the thermostats are mounted onto the connector flange which has direct view at the radiative panel. During the next cold phase one detector was powered up at 2.5V (i.e. 70% of nominal voltage) and the thermal control heaters R8 and R9 at 12V during 2.5 hours. The baseplate temperature increased by about 7.5°C. With reference to the temperature slope (< 3°C/hour) the time estimate for bringing the SI at +20°C was too long and we decided to stop this regulation attempt. We took a background image with the 1218Å detector operated at 3.3V (90% of nominal voltage), then images with both detectors after the three remaining cycles. They were comparable, in terms of distribution and integration time, to the previous ones.
-50,00 -40,00 -30,00 -20,00 -10,00 0,00 10,00 20,00 30,00 40,00 50,00 60,00 Time
Baseplate °C Shroud Setting °C
24h. Bake-out pump down background image at 1356Å background image at 1218Å shroud warming up +40°C hot case -40°C cold soak thermostats verifications +40°C hot case 12V on R8..R9 2,5V on HVPS R8..R9 and HVPS OFF 2,5V on HVPS 3,3V on HVPS background at 1218Å detector OFF background at 1218Å... and at 1356Å
Fig. 14: Evolution of the FUV-SI temperature (baseplate) vs. shroud temperature.
5.3 Thermal Vacuum Test
This last environmental test was to verify the thermal resistance of the instrument. It consists of four temperature cycles in the range from -30°C to +40°C with four hour stabilisation periods at both extreme temperatures of each cycle. Contrary to the 'active' thermal balance test the temperature is now regulated on the specimen on the basis of temperature values returned by thermocouples pasted on the baseplate and on the back-imager. The MLI blanket was removed to improve the heat transfers between the specimen and the radiative panels. This test lasted five days and the average duration of one complete cycle is 26 hours.
Verification of the Lyman-alpha rejection was performed before and after cycling. The 1356Å detector did not withstand the cycling. It must be noticed that both flight detectors failed a similar test made at Berkeley (some connections broke up). The MCP mechanical holding has been redesigned and retested successfully at Berkeley in early June 1998.
6. CONCLUSIONS
The Centre Spatial de Liege (CSL) has designed optics and structure for the Spectrographic Imager on the IMAGE mission. The CSL was also responsible for integrating, aligning, and testing the FUV-SI. This paper reviewed the design of the instrument. The performances of the instrument were verified against vibrations and thermal cycles. The rejection of the Hydrogen Lyman-alpha line at 121.6nm is a bit out of specifications (1.3% instead of 1.0%) but stable against environmental tests. The figure of merit for image quality was not affected by vibrations and met the specifications (5 arcmin) for all field angles and all temperatures within the operational range.
7. ACKNOWLEDGEMENTS
The work reported herein was sponsored by the Belgian Federal Office for Scientific, Technical and Cultural Affairs (SSTC) and coordinated by ESA-PRODEX Office (ESA contract Nr. 12328/97/NL/US). The authors are grateful to Dr. S. B. Mende and all his coworkers at Berkeley for this great collaboration. Special thanks go to Delft Sensor Systems - OIP n.v. and AMOS s.a. for the work they performed under aggressive schedule constraints.
8. REFERENCES
[1] S. Habraken, C. Jamar, P. Rochus, S. Mende, M. Lampton. "Optical design of the FUV spectrographic imager for the IMAGE mission". Proc. SPIE 3114, 544-553, 1997.
[2] S. Habraken, Y. Houbrechts, E. Renotte, C. Jamar, S. Mende, H. Frey, O. Siegmund. "Alignment and performance of the FUV spectrographic imager for the IMAGE mission". to be published in Proc. SPIE 3445-47, 1998.
[3] J.M. Stock. "Cross-delay-line microchannel plate detectors for the spectrographic imager on the IMAGE satellite". to be published in Proc. SPIE 3445-46, 1998.
[4] A. Girard. "The effective mass concept in base excitation dynamics." EUROMECH 107, Edimbourgh, September 1978.
[5] Girard A., Imbert J.F. "Modal effective parameters and truncation effects in structural dynamics." Proc. 5th International Modal Analysis Conference, pp. 820-826, London, 6-9 April 1987.