Behavioral/Cognitive
Concurrent Synaptic and Systems Memory Consolidation
during Sleep
Laura Mascetti,
1,2Ariane Foret,
1,2Jessica Schrouff,
1,2Vincenzo Muto,
1,2Vinciane Dideberg,
3Evelyne Balteau,
1,2Christian Degueldre,
1,2Christophe Phillips,
1,2Andre´ Luxen,
1,2Fabienne Collette,
1,2Vincent Bours,
3and Pierre Maquet
1,21Cyclotron Research Centre, University of Lie`ge, 4000 Lie`ge, Belgium,2Walloon Excellence in Life Sciences and Biotechnology, 4000 Lie`ge, Belgium, and 3Department of Human Genetics, University Hospital Sart-Tilman, University of Liège, 4000 Lie`ge, Belgium
Memories are consolidated during sleep by two apparently antagonistic processes: (1) reinforcement of memory-specific cortical
inter-actions and (2) homeostatic reduction in synaptic efficiency. Using fMRI, we assessed whether episodic memories are processed during
sleep by either or both mechanisms, by comparing recollection before and after sleep. We probed whether LTP influences these processes
by contrasting two groups of individuals prospectively recruited based on BDNF rs6265 (Val66Met) polymorphism. Between immediate
retrieval and delayed testing scheduled after sleep, responses to recollection increased significantly more in Val/Val individuals than in
Met carriers in parietal and occipital areas not previously engaged in retrieval, consistent with “systems-level consolidation.” Responses
also increased differentially between allelic groups in regions already activated before sleep but only in proportion to slow oscillation
power, in keeping with “synaptic downscaling.” Episodic memories seem processed at both synaptic and systemic levels during sleep by
mechanisms involving LTP.
Introduction
The mechanisms by which sleep promotes memory
consolida-tion remain unsettled. A first theory (“systems-level memory
consolidation”) assumes that hippocampal-dependent
mem-ories are reorganized and strengthened in large-scale
distrib-uted brain circuits during sleep (
Schwindel and McNaughton,
2011
). During sleep, hippocampal–neocortical interactions
would progressively transfer the burden of memory from
hip-pocampal–neocortical circuits to long-term neocortical stores
(
Frankland and Bontempi, 2005
). Remote memory is
poten-tially strengthened in neocortical circuits through LTP
(
Frankland et al., 2001
). The cortical modules within which
memories are reorganized are not yet clearly identified.
Me-dial frontal cortex is suspected to participate in memory
rear-rangement in animals and humans (
Gais et al., 2007
;
Takashima et al., 2009
). However, cortical circuits that
even-tually store mnemonic information potentially involve other
associative cortices [parietal cortex (
Takashima et al., 2009
)]
and modality-specific cortices, namely for visual memories,
temporo-occipital areas (
Takashima et al., 2009
).
Another theory (“synaptic downscaling” hypothesis) assumes
a progressive synaptic potentiation throughout the brain during
wakefulness in relation to local neuronal activity (
Tononi and
Cirelli, 2006
). Slow oscillations during subsequent non-rapid eye
movement (NREM) sleep are generated in proportion to local
neuronal work (
Kattler et al., 1994
) and learning (
Huber et al.,
2004
) achieved during wakefulness, and their exponential decline
during sleep would reflect the recalibration of synaptic efficacy
(
Vyazovskiy et al., 2009
). Because synaptic downscaling during
NREM sleep would differentially affect synapses depending on
the potentiation accrued during wakefulness, the theory predicts
that signal-to-noise selectively increases for responses to learned
stimuli the following day (
Tononi and Cirelli, 2006
). The
neu-rotrophin BDNF is released in response to neural activity (
Mowla
et al., 1999
) and causally involved in LTP (
Patterson et al., 1996
)
and the formation of long-term memory (
Bekinschtein et al.,
2008
). BDNF expression during wakefulness modulates
subse-quent slow waves during sleep (
Faraguna et al., 2008
).
Here, we used fMRI, which is exquisitely sensitive to synaptic
activity in a given brain area (
Canals et al., 2009
), to identify brain
regions in which responses change as a result of synaptic
poten-tiation, at each step of memory consolidation. We tested whether
retrieval of episodic memories after sleep was consistent with
either or both types of memory consolidation in humans.
There-fore, these two theories differ in that synaptic homeostasis
pre-dicts a global decrease in synaptic strength after sleep, whereas
systems-level consolidation assumes a selective increase in
syn-aptic connectivity after sleep in memory-related brain circuits.
Although synaptic downscaling entails local memory processing
associated with NREM sleep slow waves, systemic consolidation
results in a large-scale redistribution of memory traces within the
Received Jan. 20, 2013; revised April 7, 2013; accepted May 9, 2013.Author contributions: L.M., A.F., E.B., A.L., F.C., and P.M. designed research; L.M., A.F., V.M., C.D., and P.M. performed research; L.M., A.F., J.S., V.D., E.B., C.D., C.P., F.C., V.B., and P.M. analyzed data; L.M., A.F., V.M., A.L., F.C., and P.M. wrote the paper.
This research was supported by the Belgian National Fund for Scientific Research, the University of Lie`ge, the Queen Elisabeth Medical Foundation, the Le´on Fredericq Foundation, the Belgian Inter University Attraction Pro-gram, and the Walloon Excellence in Life Sciences and Biotechnology program.
The authors declare no competing financial interests.
Correspondence should be addressed to Dr. Pierre Maquet, Cyclotron Research Centre (B30), Alle´e du 6 Aouˆt, 8, 4000 Sart-Tilman, Lie`ge, Belgium. E-mail: [email protected].
DOI:10.1523/JNEUROSCI.0284-13.2013
brain, including in areas that were not initially involved in retrieval.
This leads to the prediction that memory retrieval after sleep should
only be associated with changes in local responses in the case of
synaptic downscaling. In contrast, if systemic consolidation takes
place during sleep, memory consolidation should be associated
with both local response changes and the recruitment of novel
brain areas. Among the latter, we predicted that, in the current
experiment, newly recruited cortical stores would include
poste-rior associative cortices and occipital areas involved with face
processing.
Materials and Methods
Moreover, to assess the involvement of LTP in human sleep-dependent memory consolidation, the experiment was based on the comparison of two groups of volunteers, prospectively recruited based on the Val66Met non-synonymous single-nucleotide polymorphism of the BDNF gene (rs6265). Neurons transfected with the human A allele (Met-BDNF) showed a re-duced activity-dependent BDNF release, and poorer episodic memory is observed in Met carriers (Egan et al., 2003). Therefore, by design, any differ-ence in brain responses between groups would suggest implications of LTP in memory consolidation. We anticipated that Met carriers would induce less LTP than homozygous for the G allele (Val/Val) during encoding. The initial test session took place at 5:45 P.M.,⬃1 h after encoding (Fig. 1A). In
rodents, cortical BDNF infusion at encoding does not affect short-term re-tention but enhances long-term performance in a hippocampus-dependent memory task (Alonso et al., 2005). We thus predicted that brain responses would not differ between allelic groups during initial retrieval but only during delayed testing after a period of sleep (scheduled between 10:30 P.M. and 7:00 A.M.). The next morning, delayed testing took place at⬃8:30
A.M.,⬃1.5 h after awakening, after dissipation of sleep inertia. Although BDNF gene expression
decreases during sleep (Cirelli and Tononi,
2000), we predicted that differential BDNF re-lease during encoding and posttraining
wakeful-ness (Fig. 1A) would result in enhanced slow
oscillation during subsequent sleep in Val/Val in-dividuals relative to Met carriers (Faraguna et al., 2008). As a consequence, the synaptic downscal-ing hypothesis would predict that the signal-to-noise ratio during retrieval the next day, assessed as the difference between episodic recollection and recognition based on familiarity, should be particularly marked in Val/Val individuals in proportion to changes in slow oscillation induced by learning during posttraining sleep.
Population
Volunteers were recruited through advertise-ment on the University of Lie`ge intranet. They gave written informed consent in compliance with procedures approved by the Ethics Com-mittee of the Faculty of Medicine of the Univer-sity of Lie`ge. The absence of medical, traumatic, psychiatric, or sleep disorders was established by a semi-structured interview. Participants (males and females) were young (18 –25 years old), healthy, right-handed, and lean (body mass index ⬍26) individuals. None complained about sleep disturbances as determined by the Pittsburgh Sleep Quality Index (PSQI) Questionnaire (score ⬍6) (Buysse et al., 1989). None had worked night shifts during the preceding year or traveled through more than one time zone during the last 3 months. Extreme chronotypes were excluded according to the morningness– eveningness Horne-Ostberg (HO) Questionnaire (scores
⬍31 or ⬎69) (Horne and Ostberg, 1976). All
participants had normal scores on the 21-item
Beck Anxiety Inventory (BAI; score⬍11) (Beck
et al., 1988) and the 21-item Beck Depression Inventory-II (BDI-II; score ⬍14) (Steer et al., 1997). They were non-smokers and moderate caffeine and alcohol consumers. None was on medication, except for oral contraceptives. No caffeine was allowed during the experiment. Volunteers complying with these criteria performed the Raven’s Progressive Matrices (Raven et al.,
1983), and blood sample was obtained for BDNF genotyping (rs6265).
Par-ticipants were eventually selected based on their BDNF genotype. Allelic groups were formed with participants matched according to sex, age, edu-cation level, chronotype, PSQI Questionnaire, and Raven scores (Table 1). They received a financial compensation for their blood test and their partic-ipation in the study.
Genotyping
Genomic DNA was extracted from blood samples using a MagNA Pure LC Instrument (Roche Applied Science). The DNA sequence of interest
was amplified by PCR in a final volume of 50l containing 0.6 Meach
primer (Thermo Fisher Scientific), 0.5l of Faststart TaqDNA
Polymer-ase (Roche Diagnostics), 0.8 mM each deoxynucleotide triphosphate
(Roche Diagnostics), and 20 ng of genomic DNA. After 10 min of dena-turation at 95°C, samples underwent 35 cycles consisting of denadena-turation (95°C, 30 s), annealing (60°C, 40 s), and extension (72°C, 30 s), followed by a final extension of 7 min at 72°C. These amplified DNA then under-went pyrosequencing reaction (Pyromark Q96 Vacuum Workstation, PSQ 96MA, Pyromark Gold Q96 Reagents; Qiagen). The sequences of the used primers are available on request.
Experimental design
The experiment consisted of an encoding session and two test sessions that took place 1 h after encoding and after a 16 h delay. During 1 week, volun-teers were instructed to go to bed before midnight and sleep for at least 8 h,
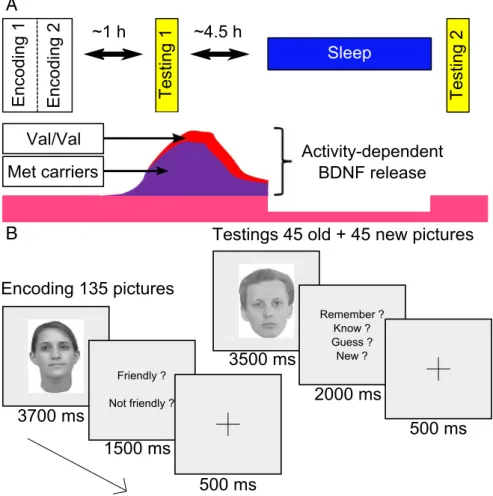
A
B
Figure 1. Experimental design. A, The experiment includes three fMRI sessions: one encoding (⫻2)andtworetrievalsessions, initial and delayed, separated by a night of sleep (test night). The bottom schematically illustrates the release of BDNF in the two allelic groups. B, Trial description for encoding and test sessions.
and no naps were allowed [verified using sleep diaries and actigraphy (Acti-watch; Cambridge Neurotechnologies)]. Participants spent 3 nights under polysomnographic recording: (1) an adaptation night, (2) a baseline night after actigraphy and before the encoding session, and (3) a test night that took place between the initial and delayed testing (Fig. 1A).
The memory task
During the encoding session conducted in the MR scanner at 4:30 P.M., participants were asked to remember 135 pictures of neutral faces (67 females; no glasses, moustache, or beard; same size and luminance), each displayed during 3700 ms and presented in random order. A prompt then appeared and participants were instructed to specify within 1500 ms whether the face was friendly or not, with the help of a keyboard placed in their right hand. A fixation cross was displayed after the participant’s response during 500 ms. Null events consisting of the presentation of the fixation cross were randomly introduced and lasted at least 10,000 ms.
The encoding was repeated twice. Test sessions (⬃8 min) took place at
5:45 P.M. (initial testing) and the next day at 8:30 A.M. (delayed testing). During each test session, participants had to make recognition memory judgments about 45 previously studied and 45 new pictures (equal sex ratio in both categories), presented in random order during 3500 ms. The set of 45 “old” pictures differed between test sessions. Participants had up to 2000 ms to specify the following: (1) whether they were certain to have encoded the item and could retrieve specific details about the encoding episode (“remember” responses, recollection); (2) whether they were certain to have encoded the item but just had a feeling of familiarity (“know” responses); (3) whether they thought but were unsure that they had seen the face (“guess” responses, included to ensure a comprehensive assessment of familiarity measure); and (4) whether they thought the item had not been presented during encoding (“new” responses). They responded by a key press after which a fixation cross appeared for 500 ms (Fig. 1B). Null events also appeared randomly. Subjective [Karolinska
sleepiness scale (KSS) (Akerstedt and Gillberg, 1990)] and objective
[psy-chomotor vigilance task (PVT) (Dinges and Powell, 1985)] alertness was
assessed before each fMRI session and after the last session of the first day. The memory task and the PVT were coded using MATLAB version 7.1 (MathWorks), with Cogent 2000 (version 1.25).
fMRI data acquisition
fMRI time series were acquired on a 3 T head-only scanner (Magnetom Allegra; Siemens Medical Solutions) operated with the standard transmit– receive quadrature head coil. Multislice T2*-weighted functional images were acquired with a gradient EPI sequence using axial slice orientation
and covering the whole brain/most of the brain (32 slices; FOV, 220⫻
220 mm2; voxel size, 3.4⫻ 3.4 ⫻ 3 mm3; 30% interslice gap; matrix size,
64⫻ 64 ⫻ 32; TR, 2130 ms; TE, 40 ms; flip angle, 90°). The three initial volumes were discarded to avoid T1 saturation effects. A high-resolution T1-weighted image was also acquired for each subject [3D modified driven equilibrium Fourier transform (Deichmann et al., 2004): TR, 7.92
ms; TE, 2.4 ms; TI, 910 ms; flip angle, 15°; FOV, 256⫻ 224 ⫻ 176 mm3;
1 mm isotropic spatial resolution]. A mirror mounted on the standard head coil allowed individuals to see the stimuli presented on a screen placed at the rear of the scanner.
EEG acquisition
The adaptation night was recorded with a V-Amp amplifier (Brain Prod-ucts). Six EEG (Fz, Cz, Pz, Oz, C3, and C4), four EOG (horizontal and vertical eye movements), and two chin EMG were recorded. A reference electrode was placed on the right mastoid. The other nights were re-corded using a QuickAmp device (Brain Products) allowing for 64 EEG-channel recordings, two bipolar EOG, and one bipolar EMG. EEG was
referenced to the mean of all electrodes. Electrode impedances were⬍10
k⍀. A 50 Hz notch filter was used, and the sampling rate was 500 Hz for
both systems. Baseline night recordings began at 11:00 P.M. and ended at
7:00 A.M. Test night recordings began at 10:30 P.M., i.e.,⬃6 h after
encoding and 4.5 h after the end of the first test sessions. Volunteers were awakened at 7:00 A.M.
EEG analyses
EEG data were analyzed with the “fMRI Artifact Rejection and Sleep
Scoring Toolbox” [FASST; http://www.montefiore.ulg.ac.
be/⬃phillips/FASST.html (Leclercq et al., 2011)] and SPM8
(http://www.fil.ion.ucl.ac.uk/spm) implemented in MATLAB version 7.5. Sleep recordings were scored by two independent observers, using the criteria of the American Academy of Sleep Medicine (Iber and Amer-ican Academy of Sleep Medicine, 2007), except for the use of 20 s win-dows. The final scoring was obtained after a consensus was achieved between scorers. Artifacts were identified manually and excluded from additional analyses. The first NREM sleep period, defined as the period between the first stage 2 and the first apparition of rapid eye movement (REM) sleep (first eye saccade), was extracted from the entire night. When REM sleep latency exceeded 90 min, suggesting that the first REM period had been “skipped,” the first NREM period was ended after any sign of light NREM sleep or (even incomplete) REM sleep. We further split the first NREM episode in four quartiles and focused on the first quartile (Q1) because the increase in slow oscillation during posttraining
sleep is known to be transient (Huber et al., 2004). Recordings were
referenced to average mastoid.
Spectral analyses. Spectral analyses were conducted on the first NREM
period and on Q1. For each electrode, power density was computed between 0.5 and 25 Hz using an FFT, 4 s windows overlapping by 2 s, and a Hanning window (frequency resolution, 0.25 Hz). EEG power was extracted for slow-wave activity (SWA; i.e., 0.75– 4 Hz) and EEG power centered on the spectral mode of slow oscillation (0.75–1 Hz), referred to as “slow oscillation power” (SOP).
Spindle detection. Spindle detection was based on amplitude detection
parameters as defined byMo¨lle et al. (2002). In the implemented version [FASST (Leclercq et al., 2011)], three electrodes of reference were deter-mined (i.e., Fz, Cz, and Pz or the closest if one was bad). The signal on these channels was then filtered between 8 and 20 Hz. For each reference electrode, an amplitude criterion was then defined as the 95th percentile of the filtered signal in sleep stage 2 convolved with a rectangular window length of 100 ms. Duration and distance criteria were the same for all reference channels and were set at 400 and 1000 ms, respectively. The
detected spindles were then epoched (⫺300 to ⫹1000 ms) to perform a
time–frequency decomposition between 11 and 16 Hz using Morlet waves. This operation allowed distinguishing between anterior or poste-rior spindles, depending on whether the largest power was observed on frontal or posterior channels, respectively. This detection was performed on the first NREM period. Finally, a density value (number of spindles per non-artifacted minute), as well as duration (milliseconds), amplitude (microvolts), and frequency (hertz) of spindles were extracted. The same reference electrodes were used for baseline and test nights.
Statistical analyses
t tests were performed on questionnaire data, except for BDI-II, for which a U test was performed because of the non-normal distribution of the data
(significant at p⬍ 0.05). t tests were performed on sleep durations, and midpoints measured by actigraphy (three recordings were discarded for
technical reasons: Val/Val, n⫽13;Metcarriers,n⫽13;normaldistributions
according to Kolmogorov–Smirnov test, significant at p⬍ 0.05).
Concern-ing behavioral data, distributions were normal. Repeated-measures ANOVAs with session and genotypes within- and between-subject factors,
Table 1. Demographic data in Val/Val and Met carriers
Val/Val Met carriers p value
Number of females 8 8 Number of males 6 7 Age 21.7⫾ 1.6 21.6⫾ 1.8 0.81 HO Questionnaire 54.7⫾ 5.4 54.6⫾ 8 0.98 PSQI Questionnaire 2.9⫾ 1.1 3.1⫾ 1.4 0.77 BAI 3.2⫾ 2.8 4.5⫾ 2.5 0.21 BDI-II 2.9⫾ 3.5 1.1⫾ 1 0.35
Raven’s progressive matrices: score (on 60 points) 55.8⫾ 2.3 55.8⫾ 2.2 0.99 Raven’s progressive matrices: testing time (min) 28⫾ 9.1 27.6⫾ 7.8 0.90
respectively, were conducted on PVT [median, fastest (10th percentile) and slowest (90th percentile) reaction times] and KSS scores and separately on the number of “remembered hits” (RH), “known hits” (KH), and “guessed hits” (GH), “false alarms” (FA), “correct rejections” (CR), “misses” (MI), and discrimination index (d⬘) and criterion (Green and Swets, 1966)
(signif-icant at p⬍ 0.05). For d⬘, planned comparisons were performed between
genotypes and testings (Bonferroni’s correction for four comparisons,␣ ⫽ 0.05/4: significant at p⬍ 0.0125). Distributions of sleep stages were normal. Repeated-measures ANOVAs with night as within-subjects factor and geno-type as between-subjects factor were conducted on durations and latencies of various sleep stages over the entire night, the first NREM cycle, and Q1 (significant at p⬍ 0.05). Concerning stage 2, stage 3, REM, and sleep dura-tion of the entire night, values from five Val/Val and one Val/Met subjects were not available because of bad EEG signal in the end of the night. For spectral analysis, data were log-transformed because of non-normal dis-tributions. Repeated-measures ANOVAs with night and electrodes as within-subjects factor and genotype as between-subjects factor were con-ducted, with Huynh–Feldt corrections for nonsphericity. Post hoc t tests, Bonferroni’s corrected for multiple comparisons, were performed to re-gionally specify EEG power changes between nights and genotypes (sig-nificant at p⬍ 0.05).
fMRI data analyses
fMRI data were analyzed using SPM8 implemented in MATLAB version 7.5. Functional scans were corrected for head motion, coregistered to the structural image, spatially normalized to a canonical EPI template con-forming to the MNI, and spatially smoothed (Gaussian kernel, 8 mm FWHM). The analysis conformed to a mixed-effects analysis and accounted for fixed and random effects (RFX). For each subject, a general linear model was used to estimate brain responses at each voxel. Trials corresponding to RH, KH, GH, MI, FA, and CR during encoding and test sessions were mod-eled as stick functions and convolved with the canonical hemodynamic re-sponse function. Movement parameters and a constant parameter were also included as covariates in the design matrix. High-pass filtering was imple-mented in the matrix design using a cutoff period of 128 s to remove slow drifts from the time series. Serial correlations in the fMRI signal were esti-mated using an autoregressive (order 1) plus white-noise model and a re-stricted maximum likelihood algorithm. Linear contrasts estimated the
main effect of recollection [RH⬎ (KH ⫹ GH)] separately for each test
session and for each encoding session [subsequent RH⬎ (KH ⫹ GH)], as
well as the session⫻ recollection interaction (delayed ⬎ initial testing). Summary statistic images corresponding to the interaction contrasts were smoothed (Gaussian kernel, 6 mm FWHM) and entered in the RFX analysis. Changes in SOP in Q1 (assessed as the first eigenvariate of the singular decomposition of significant changes in both groups in sleep EEG power between baseline and test nights), as well as spindle density during the first cycle of test night and changes in spindle density between first NREM cycles of baseline and test nights were included for each group as a regressor in the design matrix. RFX contrasts tested the effect of allelic group, which
corre-sponded to a recollection⫻ test ⫻ genotype interaction. Other contrasts
assessed whether the overnight change in responses associated with recollec-tion was linearly correlated to the increase in EEG power between nights or to spindle density during the first NREM cycle of test night or to changes in spindle density between first NREM cycles of baseline and test nights and differently so between allelic groups. A final contrast determined the brain responses associated with recollection separately for each test session. A cor-rection for nonsphericity was applied to account for possibly unequal vari-ance between groups. The resulting set of voxel values was thresholded at p⬍ 0.001 (uncorrected). Statistical inferences were performed at a threshold of
p⬍ 0.05 after correction for multiple comparisons over small spherical
volumes (10 mm radius), located in structures of interest reported in the literature, unless results were significant over the whole brain.
Bayesian inferences and posterior probability maps
In the RFX, we also computed posterior probability maps (PPMs) en-abling conditional or Bayesian inferences about regionally specific effects (Friston and Penny, 2003). PPMs and effect size were computed for the
contrast of recollection [RH⬎ (KH ⫹ GH)] to verify the absence of
activation in regions during early and delayed testings.
Results
Demographic data
Six hundred normal participants were screened in this study. One
hundred thirty-four participants corresponded to the inclusion
criteria and gave blood for BDNF genotyping. In this cohort, the
studied single-nucleotide polymorphism was in Hardy–Weinberg
equilibrium (
2⫽ 3.25, p ⫽ 0.07) with genotypic frequency of 0.6
(G/G), 0.31 (G/A). and 0.09 (A/A).
Two allelic groups were eventually established: (1) 14 Val/Val
(eight females) and (2) 15 Met carriers (eight females; six Met
homozygous). Groups did not differ in terms of age, education
level, chronotype, subjective sleep quality, anxiety, depression,
and IQ (Raven matrices) (
Table 1
).
Actigraphy
During the week and especially during the 3 d preceding the
experiment, participants were instructed to go to bed no later
than 12:00 A.M. and to sleep for at least 8 h. Over the last 3 d, sleep
duration (Val/Val, 9.22 h
⫾ 46 min; Met carriers, 8.91 h ⫾ 44
min) and sleep midpoint (Val/Val, 4:08 A.M.
⫾ 43 min; Met
carriers, 4:05 A.M.
⫾ 40 min) did not differ between groups (t
tests, p
⫽ 0.30 and p ⫽ 0.86, respectively; n ⫽ 13 in each group).
Alertness and episodic memory performance
Subjective and objective alertness was measured before each
scanning session and after the last session of the first day using
KSS and PVT, respectively. Repeated-measures ANOVAs showed
that they did not differ between groups [KSS, F
(1,27)⫽ 0.00, p ⫽ 1;
median reaction times at PVT, F
(1,27)⫽ 0.03, p ⫽ 0.86; slowest
reac-tion times at PVT (90th percentile), F
(1,27)⫽ 0.00, p ⫽ 0.99; fastest
reaction times at PVT (10th percentile), F
(1,27)⫽ 0.00, p ⫽ 0.99].
Repeated-measures ANOVAs showed that recollection rates
did not change significantly from initial to delayed testing (RH:
genotype, F
(1,27)⫽ 0.32, p ⫽ 0.58; testing, F
(1,27)⫽ 0.28, p ⫽ 0.60;
testing
⫻ genotype, F
(1,27)⫽ 1.89, p ⫽ 0.18), whereas the number
of familiarity-based responses decreased and the number of
guess-based responses increased in both genotypes (KH:
geno-type, F
(1,27)⫽ 0.25, p ⫽ 0.62; testing, F
(1,27)⫽ 13.42, p ⫽ 0.00;
testing
⫻ genotype, F
(1,27)⫽ 2.42, p ⫽ 0.13; GH: genotype,
F
(1,27)⫽ 0.77, p ⫽ 0.39; testing, F
(1,27)⫽ 6.98, p ⫽ 0.01; testing ⫻
genotype, F
(1,27)⫽ 0.18, p ⫽ 0.68). MI rates showed a small but
significant increase overnight, which did not differ between
ge-notypes (MI: genotype, F
(1,27)⫽ 0.47, p ⫽ 0.50; testing, F
(1,27)⫽
4.19, p
⫽ 0.05; testing ⫻ genotype, F
(1,27)⫽ 0.00, p ⫽ 0.96). FA
rates decreased overnight particularly in Val/Val, although the
change did not differ from Met carriers (FA: genotype, F
(1,27)⫽
2.70, p
⫽ 0.11; testing, F
(1,27)⫽ 90.06, p ⫽ 0.00; testing ⫻
geno-type, F
(1,27)⫽ 0.27, p ⫽ 0.61). CR rates increase to a larger extent
Table 2. Behavioral data in Val/Val and Met carriers (meanⴞ SD)Number of trials (of 45)
Initial testing Delayed testing
Val/Val (n⫽ 14) Met carriers (n⫽ 15) Val/Val (n⫽ 14) Met carriers (n⫽ 15) RH 14.1⫾ 8.7 11.5⫾ 4.9 13.4⫾ 8.9 13.1⫾ 4.7 KH 15.1⫾ 5.8 15.6⫾ 5.6 13.2⫾ 4.4 11.0⫾ 4.4 GH 10.3⫾ 4.8 11.3⫾ 3.2 11.8⫾ 5.4 13.4⫾ 4.2 MI 5.4⫾ 4 6.3⫾ 3.4 6.5⫾ 4.4 7.5⫾ 4.1 CR 31.3⫾ 7.7 28.1⫾ 4.7 38.8⫾ 5.5 35.3⫾ 5.3 FA 13.3⫾ 7.6 16.3⫾ 4.7 6⫾ 5.3 9.7⫾ 5.3 d⬘ 2.0⫾ 0.7 1.5⫾ 0.4 2.6⫾ 0.9 1.9⫾ 0.5 Criterion ⫺0.4 ⫾ 0.6 ⫺0.4 ⫾ 0.3 0.03⫾ 0.6 ⫺0.1 ⫾ 0.3
in Val/Val individuals than in Met carriers, although this was not
significant (CR: genotype, F
(1,27)⫽ 2.68, p ⫽ 0.11; testing,
F
(1,27)⫽ 106.18, p ⫽ 0.00; testing ⫻ genotype, F
(1,27)⫽ 0.04, p ⫽
0.84). Discrimination index was larger in Val/Val individuals
than in Met carriers (d⬘, genotype, F
(1,27)⫽ 8.65, p ⫽ 0.01) and
changed to a larger, although not significant, extent in the former
between test sessions (testing, F
(1,27)⫽ 24.64, p ⫽ 0.00; testing ⫻
genotype, F
(1,27)⫽ 1.29, p ⫽ 0.27) (
Table 2
). However, planned
comparisons showed that d⬘ did not differ between group during
initial testing ( p
⫽ 0.016, not significant after Bonferroni’s
cor-rection for four comparisons). Both groups significantly
in-creased d
⬘ from initial to delayed testing (Val/Val, p ⫽ 0.000; Met
carriers, p
⫽ 0.010, Bonferroni’s correction for four
compari-sons). These results show that both groups of normal participants
benefit from sleep in terms of memory performance, in keeping
with the literature (
Gais et al., 2006
). Importantly, the Val/Val
group achieved significantly better discrimination than Met
car-riers during delayed testing ( p
⫽ 0.010, Bonferroni’s correction
for four comparisons).
Sleep data
Sleep parameters during baseline and posttraining nights did not
differ between allelic groups (
Table 3
).
Learning-dependent changes in NREM sleep are known to
tran-siently occur during posttraining night and to predominate over
frequencies corresponding to the slow oscillation (
⬍1 Hz) (
Huber et
al., 2004
). Therefore, we extracted the first NREM period from the
entire night, as well as Q1. We checked that the duration of NREM
sleep during the first NREM period and Q1 did not differ between
groups (
Table 3
) and nights (repeated-measures ANOVAs, all p
val-ues
⬎0.05). We computed both SWA (NREM sleep EEG power
between 0.75 and 4 Hz) and SOP (NREM sleep EEG power between
0.75 and 1 Hz, the spectral mode of slow oscillation) for each
elec-trode over the first cycle and Q1.
Repeated-measures ANOVAs showed that SWA did not differ
between nights or genotypes during the first NREM period
(ge-notype, F
(1,27)⫽ 0.23, p ⫽ 0.64; night, F
(1,27)⫽ 1.44, p ⫽ 0.24;
night
⫻ genotype, F
(1,27)⫽ 0.04, p ⫽ 0.84). SWA tended to
change differently between allelic groups during Q1 (genotype,
F
(1,27)⫽ 0.54, p ⫽ 0.47; night, F
(1,27)⫽ 0.12, p ⫽ 0.74; night ⫻
genotype, F
(1,27)⫽ 4.11, p ⫽ 0.053).
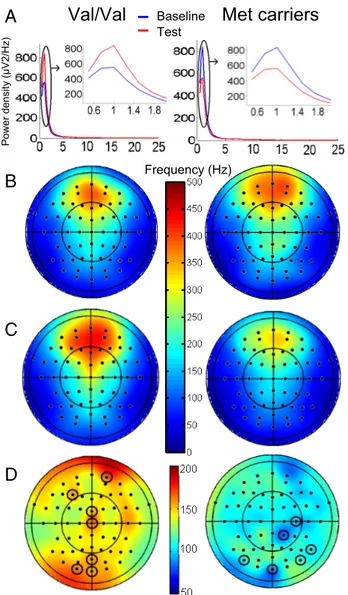
SOP showed a significant night
⫻ genotype interaction
(ge-notype, F
(1,27)⫽ 0.64, p ⫽ 0.43; night, F
(1,27)⫽ 0.05, p ⫽ 0.83;
night
⫻ genotype, F
(1,27)⫽ 4.53, p ⫽ 0.04) during Q1 (
Fig. 2
A).
In Val/Val individuals, the average SOP increase over all
elec-trodes was 6% between baseline and test nights. Post hoc t tests
(Bonferroni’s correction) showed that power in Q1 increased
significantly over Fp2, FCz, Cz, POz, Oz, O1, and F3 between
baseline and test nights. The topography of the spectral changes is
scarcely informative in the current study because of the
wide-spread activation implied by explicit memory tasks. In Met
car-riers, SOP decreased on average by 5%, although significant
decreases were only detected over P8, PO8, C4, CP2, Oz, and PO7
( p values
⬍0.05, Bonferroni’s corrected;
Fig. 2
B–D).
Confirma-tory repeated-measures ANOVAs conducted separately in each
allelic group confirmed a significant effect of night in Val/Val
individuals (F
(1,13)⫽ 6.40, p ⫽ 0.03) but not in Met carriers
(F
(1,14)⫽ 1.22, p ⫽ 0.29). Consistent with our expectations, these
results indicate that, between baseline and test nights, SOP
in-creased in Val/Val individuals and remained constant in Met
carriers.
Finally, there was no difference between groups in spindle
density, duration, amplitude, or frequency during the first
NREM period ( p values
⬎0.05).
Brain responses activated in relation to recollection
fMRI data showed that, across groups, initial recollection [RH
⬎
(KH
⫹ GH)] was associated with significant brain responses in a
distributed set of areas in frontal, temporal, mesio-temporal,
pa-rietal, and cingulate cortices ( p
FWE-whole brain⬍ 0.05;
Fig. 3
A,
yellow areas;
Table 4
). Initial recollection induced larger
re-sponses in the right intraparietal sulcus (IPS) in Met carriers than
in the Val/Val group ( p
FWE-whole brain⬍ 0.05;
Fig. 3
A, B, green
area;
Table 4
), whereas no response was larger in the latter relative
to the former. These results indicate that, if anything, recollection
is increased with enhanced right parietal responses in Met
carri-ers during initial testing. Based on animal data (
Alonso et al.,
2005
), it is unlikely to result from differences in BDNF release
since encoding.
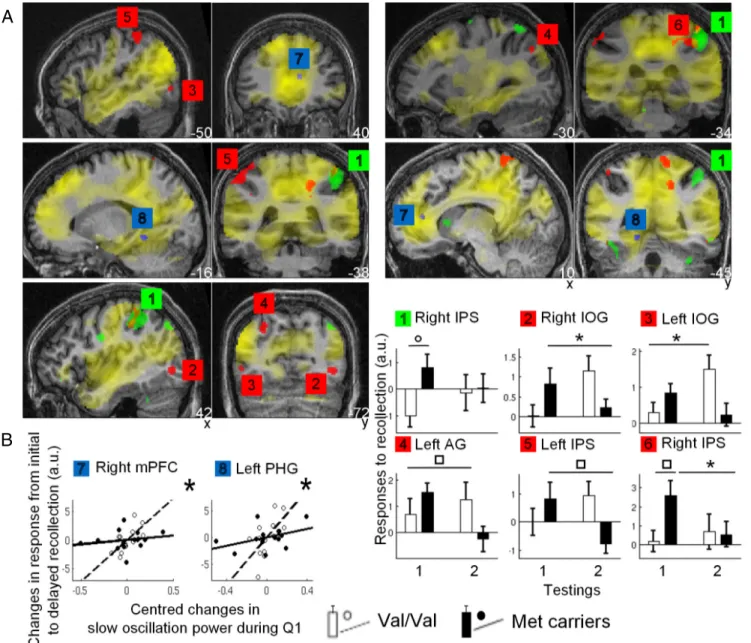
From initial to delayed testing, responses elicited by
recollec-tion increased significantly more in the Val/Val group than in
Met carriers in the left angular gyrus (AG), bilateral inferior
oc-cipital gyri (IOG), and bilateral IPS [p
SVC⬍ 0.05 (in which SVC is
small volume correction);
Fig. 3
A, B, red areas;
Table 4
]. In
con-trast, no brain response was more enhanced in Met carriers
dur-ing delayed relative to initial testdur-ing. To further dissect memory
Table 3. Sleep data for baseline and test nights in Val/Val and Met carriers (meanⴞ SD)Baseline night Test night
Statistics for allelic group difference
(min) Val/Val (n⫽ 14) Met carriers (n⫽ 15) Val/Val (n⫽ 14) Met carriers (n⫽ 15)
Stage 2 duration 179.1⫾ 27.9 188.4⫾ 34.7 187.7⫾ 25.4 179.8⫾ 36.8 F(1,21)⫽ 0.00, p ⫽ 0.96 Stage 3 duration 169.3⫾ 34 164.7⫾ 45.4 161⫾ 15.4 167.8⫾ 41 F(1,21)⫽ 0.15, p ⫽ 0.71 REM duration 98.3⫾ 21.3 103.3⫾ 22.6 102.2⫾ 28.9 119.7⫾ 14.7 F(1,21)⫽ 2.53, p ⫽ 0.13 Stage 2 latency 8.9⫾ 6.3 12.4⫾ 11.5 12.4⫾ 11.2 12.3⫾ 10.4 F(1,27)⫽ 0.32, p ⫽ 0.58 Stage 3 latency 15.3⫾ 7.3 19.5⫾ 13.6 15.9⫾ 11.5 17.4⫾ 10.6 F(1,27)⫽ 0.73, p ⫽ 0.40 REM latency 117.8⫾ 54.9 95⫾ 13.6 85.1⫾ 24.8 88.8⫾ 38.3 F(1,27)⫽ 0.60, p ⫽ 0.43
Total time in bed 494.5⫾ 13.6 497.1⫾ 12.7 503.3⫾ 5.7 505.3⫾ 10.1 F(1,27)⫽ 0.18, p ⫽ 0.68
Sleep duration 446.7⫾ 31 456.4⫾ 22.7 451⫾ 38.2 467.3⫾ 23.1 F(1,21)⫽ 3.11, p ⫽ 0.09
First NREM period
Stage 2 duration 15⫾ 15 15.4⫾ 11.3 9.6⫾ 5.0 9.7⫾ 4.6 F(1,27)⫽ 0.00, p ⫽ 0.95
Stage 3 duration 57.5⫾ 15.1 51.5⫾ 16.4 56.7⫾ 15.0 48.2⫾ 10.4 F(1,27)⫽ 3.73, p ⫽ 0.06
Total period duration 81.9⫾ 33.6 69.4⫾ 17.5 67.2⫾ 17.3 58.4⫾ 10.9 F(1,27)⫽ 2.61, p ⫽ 0.12
Q1
Stage 2 duration 6.6⫾ 3.9 6.2⫾ 2.7 5⫾ 1.7 5.7⫾ 1.7 F(1,27)⫽ 0.08, p ⫽ 0.78
Stage 3 duration 11.7⫾ 6.3 10.9⫾ 5.2 11.9⫾ 4.1 9.2⫾ 5.1 F(1,27)⫽ 1.45, p ⫽ 0.24
consolidation, we estimated the activity of these areas during
early and delayed testing separately in each allelic group. Activity
estimates showed that, in Val/Val individuals, left IOG and AG
did not significantly respond to recollection during early testing
( p
⬎ 0.05; Bayesian estimation of probability of activation ⬍4%
in both regions). In contrast, their response became significant
during delayed testing. None of these two areas overlapped with
brain areas recruited during initial testing (left IOG did not even
overlap with areas involved in encoding). This finding shows that
these regions corresponded to newly recruited areas and suggests
that systems-level memory consolidation took place overnight
differentially between BDNF polymorphic groups. Conversely,
responses in both IPS and right IOG significantly decreased
be-tween sessions in Met carriers. Only the right IPS was
signifi-cantly recruited during early testing, as mentioned previously
(
Fig. 3
A, B, area 6). Responses in left IPS and right IOG were not
significant during early testing ( p
⬎ 0.05; Bayesian estimation of
probability of activation
⬍5% in both regions) and responses
were not significant in any of these three areas during delayed
testing ( p
⬎ 0.05; Bayesian estimations of probability of
activa-tion of 0, 9, and 23% in left IPS, left IOG, and right IPS,
respec-tively). Collectively, these results reveal a robust overnight
response enhancement in Val/Val individuals in left IOG and AG.
In contrast, response changes in Met carriers occurred in areas
that did not significantly respond during delayed retrieval.
fMRI data also showed that overnight changes in brain
re-sponses associated with recollection were linearly related to the
changes in SOP during Q1 from baseline to test night in the right
mPFC and left parahippocampal gyrus (PHG) in Val/Val but not
Met carriers ( p
SVC⬍ 0.05;
Fig. 3
A, B, blue areas;
Table 4
), both
already activated in response to recollection during encoding and
initial testing. Consistent with synaptic downscaling, these
find-ings suggest that, in Val/Val, a local process takes place overnight
in relation to the neuronal workload achieved during daytime
(i.e., during learning, retrieval, or both) and in proportion to the
gain in EEG power of slow oscillation during posttraining night.
These results do not rule out an effect of systems-level
consolida-tion: mPFC has been repeatedly involved in sleep-dependent
hippocampo-dialog during sleep (
Gais et al., 2007
), and
systems-level consolidation was indirectly associated with slow waves,
most likely through an entrainment of other NREM oscillations
(e.g., spindles) (
Sirota et al., 2003
;
Marshall et al., 2006
).
How-ever, overnight changes in recollection-related responses were
significantly related to neither spindle density during the first
NREM cycle of test night nor change in spindle density during the
first NREM cycle between baseline and test nights.
Finally, brain responses that significantly change between
ini-tial and delayed sessions in proportion to d
⬘ were looked for, but
there was none.
Discussion
Memory consolidation was estimated using fMRI by comparing
brain responses elicited by recollection [i.e., episodic recognition,
RH
⬎ (KH ⫹ GH)] during two retrieval sessions scheduled 1 h
after encoding and 16 h later, after a night of sleep, in two groups
of normal participants differing by their Val66Met BDNF
geno-type. This contrast especially probes hippocampus-dependent
memory (
Yonelinas et al., 2005
) and is particularly relevant for
characterizing local or distributed processes of episodic memory
retrieval.
Memory performance, estimated by d⬘, improved after sleep
in both allelic groups. Overall, Val/Val had better memory
per-formance on both tests, although the difference became
signifi-cant only after a night of sleep. This finding indicates that BDNF
polymorphism influences overnight memory consolidation,
sug-gesting that differential BDNF release induced by encoding
trig-gers differential memory processing during subsequent hours.
Note that changes in brain responses discussed below are
in-dependent of these behavioral results because they selectively
probe episodic memory and contrast recollection to
familiar-ity responses.
A transient increase in SOP was observed during Q1 in Val/
Val individuals, whereas no significant change was observed in
Met carriers. Differences in sleep EEG spectrum are smaller than
reported previously (
Bachmann et al., 2012
). In the current
study, the objective was not to report the impact of Val66Met
BDNF polymorphism on EEG rhythms but to use the functional
consequence of this polymorphism as a tool to test hypotheses
related to sleep-dependent memory consolidation. Stringent
re-cruitment criteria matched allelic groups on a large number of
demographic parameters, thereby attenuating possible
differ-A
B
C
D
Figure 2. Sleep EEG spectral analysis. A, Spectral density (0.5–25 Hz) on Fp2 (one of the electrodes that showed significant changes) during Q1 in baseline (blue) and test nights (red). Insets, 0.5–2 Hz. SOP increases between baseline and test nights in Val/Val individuals. Topog-raphy of SOP (0.75–1 Hz) during Q1 of baseline (B) and test night (square microvolts) (C). D, Percentage between-night differences. Circled electrodes, p⬍ 0.05, Bonferroni’s corrected. Left column, Val/Val; right column, Met carriers.
ences related to this polymorphism. In addition, a memory task is
known to induce short-lasting changes in slow oscillation during
sleep (
Huber et al., 2004
) and surely induces more subtle changes
in EEG activity than total sleep deprivation (
Bachmann et al.,
2012
). However, in keeping with our predictions, differential
BDNF release induced before sleep by learning is associated with
enhanced slow oscillations in Val/Val individuals.
In Val/Val individuals, responses induced by recollection
in-crease between retrieval sessions in the right mPFC and left PHG in
proportion to the increase in SOP recorded during Q1 during test
night relative to baseline night. These brain areas share two
impor-tant functional features. First, they were recruited before sleep,
dur-ing encoddur-ing, and initial testdur-ing. Second, they are known to be
systematically active in relation to slow waves during human NREM
sleep (
Dang-Vu et al., 2008
). These elements concord with a local
process, induced by learning and involving LTP, resulting in
en-hanced slow oscillation during sleep and an increase signal-to-noise
response during later testing (i.e., increased response to recollection
relative to familiarity-based responses). These results thus support
the predictions of the downscaling hypothesis. They equally support
any theory assuming the homeostatic regulation of local neuronal
function in which the set parameter, instead of the average synaptic
strength, would be a key functional parameter, such as redox state or
oxidative metabolism (
Scharf et al., 2008
). Alternatively, one might
assume a saturation of synaptic potentiation in Val/Val individuals
in the evening, explaining the lack of difference in memory-related
responses during early retrieval. However, this hypothesis would not
easily account for the difference in responses for remembered and
known faces recorded the next morning, because synaptic
downscal-ing would equally affect representation of remembered and known
A
B
Figure 3. fMRI results. A, Yellow, Brain areas recruited during initial recollection in both groups. Green, Larger responses in Met carriers than in Val/Val during initial recollection. Red, Larger changes in response from initial to delayed recollection (Val/Val⬎Metcarriers).Blue,AreasinwhichchangesinVal/ValareproportionaltothechangesinSOPfrombaselinetotestnight.Functional results are displayed at puncorrected⬍ 0.001, except for initial testing displayed at puncorrected⬍ 0.05 (to show all areas likely to be involved in early memory formation), over a typical individual MR
image. B, Parameter estimates (mean⫾SEM)ofbrainareaslabeledasinA.Thetwoleftbarspertaintoinitialtesting(testing1),andthetworightbarspertaintodelayedtesting(testing2).White bars, Val/Val; black bars, Met carriers.䡩pFWE-whole brain⬍ 0.05 (1); *pSVC⬍ 0.05 [2, 3, 6 (right bar), 7, 8];▫puncorrected⬍ 0.001 [4, 5, 6 (left bar)]. Scatter plots for areas 7 and 8 represent the
regression between individual activity estimates and changes in SOP during Q1, assessed as the first eigenvariate of the singular decomposition of significant changes in both groups in sleep EEG power between baseline and test night. a.u., Arbitrary units. Open circles, dotted lines, Val/Val; filled circles, solid lines, Met carriers.
faces. Finally, the findings are not incompatible with systems-levels
consolidation. The mPFC has been identified as a major area in the
reorganization of episodic memories that integrates information
and suppresses irrelevant representations from the hippocampus
(
Nieuwenhuis and Takashima, 2011
). Repetitions of learned neural
activity patterns during sleep were also associated with slow
oscilla-tion, although in the context of the temporal organization it imposes
on other brain oscillations (
Marshall and Born, 2007
), especially
spindles (
Gais et al., 2002
). Because we did not find any change in
brain response that would regress with spindle activity, systems-level
consolidation does not appear as the most likely mechanism to
ex-plain the findings in these two regions. Importantly, whichever the
underlying mechanisms, our results further suggest that
sleep-dependent consolidation of episodic memories is modulated by
cor-tical LTP.
Responses induced by recollection in left IOG and AG increased
overnight only in Val/Val individuals and significantly more so than
in Met carriers. In Val/Val individuals, the former region did not
respond during encoding or initial testing and yet was recruited
dur-ing delayed testdur-ing after sleep. This finddur-ing is incompatible with a
local synaptic downscaling that would selectively process memories
of the learned faces (synaptic homeostasis induced by previous
neu-ral work but unrelated to the probed memories remains possible but
was not assessed here). In contrast, it supports the view of a
systems-level memory consolidation by which the burden of episodic
mem-ory not only would be redistributed in cortical memmem-ory stores but
can even involve novel areas. The IOG is part of the face perception
network and is especially involved in the identification of individuals
(
Ishai, 2008
). It is in good position to serve as a major long-term
store for the face features encoded during the experiment. The AG
did not show any response to recollection during initial retrieval but
was recruited early on during encoding. In these conditions, the
enhanced response observed during delayed testing is equally
con-sistent with either a local or a distributed memory consolidation
process.
Strictly speaking, the recruitment of these two areas during
delayed testing might also result from the mere passage of time.
However, volunteers spend 8 of 13.5 h in sleep between the end of
encoding and their waking the next morning. In addition, it has
been repeatedly shown that memory retention is enhanced by
sleep compared with an equivalent period of wakefulness (
Gais et
al., 2006
). Finally, BDNF infused in the cortex during the waking
hours after encoding does not modify long-term memory in
ro-dents (
Alonso et al., 2005
). Although a waking control group
would theoretically settle this question, it appears that neither a
sleep-deprived group nor a waking group tested during daytime
are appropriate controls in the current instances because of
con-founds by either different sleep pressure or circadian phase. This
issue deserves a future thorough experimental evaluation.
Finally, left IPS and right IOG did not respond to recollection
during either initial or delayed testing, although their response
significantly decreased between sessions in Met carriers. These
findings do not contribute to support either theories of
sleep-dependent memory consolidation.
In conclusion, both sleep (
Bachmann et al., 2012
) and
mem-ory (
Egan et al., 2003
) are known to show genetically determined
Table 4. fMRI resultsx y z Z score pFWE-whole brain Reference SVC
RH⬎ (KH ⫹ GH) (Val/Val ⫹ Met carriers) (initial testing)
Left ventral mPFC ⫺8 44 4 7.543 0.000 Whole brain
Left superior frontal gyrus ⫺24 26 44 7.412 0.000 Whole brain
Left dorsal mPFC ⫺12 38 46 7.140 0.000 Whole brain
Right superior frontal gyrus 22 34 48 5.626 0.001 Whole brain
Left posterior temporal sulcus ⫺52 ⫺70 24 7.221 0.000 Whole brain
Left inferior parietal lobule ⫺50 ⫺68 36 6.982 0.000 Whole brain
Left middle temporal gyrus ⫺58 ⫺14 ⫺14 6.529 0.000 Whole brain
Right mid-cingulate cortex 8 ⫺28 42 7.131 0.000 Whole brain
Left posterior cingulate cortex ⫺8 ⫺48 28 7.028 0.000 Whole brain
Right posterior cingulate cortex 12 ⫺48 32 6.645 0.000 Whole brain
Left cuneus ⫺10 ⫺90 22 6.579 0.000 Whole brain
Left retrosplenial cortex ⫺8 ⫺56 12 6.416 0.000 Whole brain
Right precentral cortex 48 ⫺14 52 6.261 0.000 Whole brain
Left PHG ⫺24 ⫺26 ⫺18 6.179 0.000 Whole brain
Right superior parietal cortex 28 ⫺42 64 5.580 0.001 Whole brain
Right retrosplenial cortex 14 ⫺42 6 5.318 0.002 Whole brain
Left superior parietal cortex ⫺18 ⫺44 62 5.091 0.006 Whole brain
Right superior temporal sulcus 54 ⫺46 22 6.241 0.000 Whole brain
Right middle temporal gyrus 56 ⫺14 ⫺14 6.234 0.000 Whole brain
Right inferior parietal lobule 66 ⫺38 26 5.850 0.000 Whole brain
Right PHG 28 ⫺48 ⫺6 4.995 0.010 Whole brain
Right hippocampus 28 ⫺18 ⫺20 4.929 0.013 Whole brain
RH⬎ (KH ⫹ GH) (Met carriers ⬎ Val/Val) (initial testing)
Right IPS 48 ⫺34 48 5.02 0.008 Whole brain
RH⬎ (KH ⫹ GH) (Val/Val ⬎ Met carriers) (delayed ⬎ initial testing)
Right IOG 42 ⫺74 ⫺2 3.620 0.007 (Schiltz and Rossion, 2006)
Left IOG ⫺48 ⫺70 0 3.140 0.026 (Skinner et al., 2010)
Left AG ⫺30 ⫺72 38 3.090 0.029 (Vilberg and Rugg, 2007)
Left IPS ⫺52 ⫺38 48 3.500 0.010 (Iidaka et al., 2006)
Right IPS 44 ⫺38 58 3.390 0.013 (Yonelinas et al., 2005)
RH⬎ (KH ⫹ GH) (Val/Val) (delayed ⬎ initial testing) (SOP test ⬎ baseline)
Right mPFC 10 40 12 3.33 0.015 (Sterpenich et al., 2007)
intersubject variability. The current results further reveal
hereto-fore unsuspected interindividual variability in sleep-dependent
memory processes at both the behavioral and cerebral levels.
These findings warrant future assessment of genetically based
variability of memory performance between participants in
rela-tion to sleep parameters.
More generally, our results provide experimental evidence
that episodic memories are processed at both the local and
dis-tributed levels. They suggest that both synaptic downscaling and
systems-level consolidation occur during sleep. Beyond their
ap-parent antagonism, both processes likely contribute to generate
robust episodic memories.
References
Akerstedt T, Gillberg M (1990) Subjective and objective sleepiness in the active individual. Int J Neurosci 52:29 –37.CrossRef Medline
Alonso M, Bekinschtein P, Cammarota M, Vianna MR, Izquierdo I, Medina JH (2005) Endogenous BDNF is required for long-term memory forma-tion in the rat parietal cortex. Learn Mem 12:504 –510.CrossRef Medline
Bachmann V, Klein C, Bodenmann S, Scha¨fer N, Berger W, Brugger P, Lan-dolt HP (2012) The BDNF Val66Met polymorphism modulates sleep intensity: EEG frequency- and state-specificity. Sleep 35:335–344.
CrossRef Medline
Beck AT, Epstein N, Brown G, Steer RA (1988) An inventory for measuring clinical anxiety: psychometric properties. J Consult Clin Psychol 56:893– 897.
CrossRef Medline
Bekinschtein P, Cammarota M, Katche C, Slipczuk L, Rossato JI, Goldin A, Izquierdo I, Medina JH (2008) BDNF is essential to promote persistence of long-term memory storage. Proc Natl Acad Sci U S A 105:2711–2716.
CrossRef Medline
Buysse DJ, Reynolds CF 3rd, Monk TH, Berman SR, Kupfer DJ (1989) The Pittsburgh Sleep Quality Index: a new instrument for psychiatric practice and research. Psychiatry Res 28:193–213.CrossRef Medline
Canals S, Beyerlein M, Merkle H, Logothetis NK (2009) Functional MRI evidence for LTP-induced neural network reorganization. Curr Biol 19: 398 – 403.CrossRef Medline
Cirelli C, Tononi G (2000) Differential expression of plasticity-related genes in waking and sleep and their regulation by the noradrenergic system.
J Neurosci 20:9187–9194.Medline
Dang-Vu TT, Schabus M, Desseilles M, Albouy G, Boly M, Darsaud A, Gais S, Rauchs G, Sterpenich V, Vandewalle G, Carrier J, Moonen G, Balteau E, Degueldre C, Luxen A, Phillips C, Maquet P (2008) Spontaneous neural activity during human slow wave sleep. Proc Natl Acad Sci U S A 105:
15160 –15165.CrossRef Medline
Deichmann R, Schwarzbauer C, Turner R (2004) Optimisation of the 3D MDEFT sequence for anatomical brain imaging: technical implications at
1.5 and 3 T. Neuroimage 21:757–767.CrossRef Medline
Dinges DF, Powell JW (1985) Microcomputer analysis of performance on a portable, simple visual RT task sustained operations. Behav Res Methods
Instrum Comput 17:652– 655.CrossRef
Egan MF, Kojima M, Callicott JH, Goldberg TE, Kolachana BS, Bertolino A, Zaitsev E, Gold B, Goldman D, Dean M, Lu B, Weinberger DR (2003) The BDNF val66met polymorphism affects activity-dependent secretion of BDNF and human memory and hippocampal function. Cell 112:257–269.
CrossRef Medline
Faraguna U, Vyazovskiy VV, Nelson AB, Tononi G, Cirelli C (2008) A causal role for brain-derived neurotrophic factor in the homeostatic reg-ulation of sleep. J Neurosci 28:4088 – 4095.CrossRef Medline
Frankland PW, Bontempi B (2005) The organization of recent and remote
memories. Nat Rev 6:119 –130.CrossRef Medline
Frankland PW, O’Brien C, Ohno M, Kirkwood A, Silva AJ (2001) Alpha-CaMKII-dependent plasticity in the cortex is required for permanent
memory. Nature 411:309 –313.CrossRef Medline
Friston KJ, Penny W (2003) Posterior probability maps and SPMs.
Neuro-image 19:1240 –1249.CrossRef Medline
Gais S, Mo¨lle M, Helms K, Born J (2002) Learning-dependent increases in sleep spindle density. J Neurosci 22:6830 – 6834.Medline
Gais S, Lucas B, Born J (2006) Sleep after learning aids memory recall. Learn
Mem 13:259 –262.CrossRef Medline
Gais S, Albouy G, Boly M, Dang-Vu TT, Darsaud A, Desseilles M, Rauchs G, Schabus M, Sterpenich V, Vandewalle G, Maquet P, Peigneux P (2007)
Sleep transforms the cerebral trace of declarative memories. Proc Natl
Acad Sci U S A 104:18778 –18783.CrossRef Medline
Green DM, Swets JA (1966) Signal detection theory and psychophysics. New York: Wiley.
Horne JA, Ostberg O (1976) A self-assessment questionnaire to determine morningness-eveningness in human circadian rhythms. Int J Chronobiol
4:97–110.Medline
Huber R, Ghilardi MF, Massimini M, Tononi G (2004) Local sleep and learning. Nature 430:78 – 81.CrossRef Medline
Iber C, American Academy of Sleep Medicine (2007) The AASM manual for the scoring of sleep and associated events: rules, terminology and techni-cal specifications. Westchester, IL: American Academy of Sleep Medicine. Iidaka T, Matsumoto A, Nogawa J, Yamamoto Y, Sadato N (2006) Fronto-parietal network involved in successful retrieval from episodic memory. Spatial and temporal analyses using fMRI and ERP. Cereb Cortex 16:
1349 –1360.Medline
Ishai A (2008) Let’s face it: it’s a cortical network. Neuroimage 40:415– 419.
CrossRef Medline
Kattler H, Dijk DJ, Borbe´ly AA (1994) Effect of unilateral somatosensory stim-ulation prior to sleep on the sleep EEG in humans. J Sleep Res 3:159 –164.
CrossRef Medline
Leclercq Y, Schrouff J, Noirhomme Q, Maquet P, Phillips C (2011) fMRI artefact rejection and sleep scoring toolbox. Comput Intell Neurosci
2011:598206.CrossRef Medline
Marshall L, Born J (2007) The contribution of sleep to hippocampus-dependent memory consolidation. Trends Cogn Sci 11:442– 450.
CrossRef Medline
Marshall L, Helgado´ttir H, Mo¨lle M, Born J (2006) Boosting slow oscilla-tions during sleep potentiates memory. Nature 444:610 – 613.CrossRef Medline
Mo¨lle M, Marshall L, Gais S, Born J (2002) Grouping of spindle activity during slow oscillations in human non-rapid eye movement sleep. J
Neu-rosci 22:10941–10947.Medline
Mowla SJ, Pareek S, Farhadi HF, Petrecca K, Fawcett JP, Seidah NG, Morris SJ, Sossin WS, Murphy RA (1999) Differential sorting of nerve growth factor and brain-derived neurotrophic factor in hippocampal neurons.
J Neurosci 19:2069 –2080.Medline
Nieuwenhuis IL, Takashima A (2011) The role of the ventromedial prefron-tal cortex in memory consolidation. Behav Brain Res 218:325–334.
CrossRef Medline
Patterson SL, Abel T, Deuel TA, Martin KC, Rose JC, Kandel ER (1996) Recombinant BDNF rescues deficits in basal synaptic transmission and hippocampal LTP in BDNF knockout mice. Neuron 16:1137–1145.
CrossRef Medline
Raven JC, Court JH, Raven J (1983) Manual for Raven’s progressive matri-ces and vocabulary scales, revised edition. London: Lewis.
Scharf MT, Naidoo N, Zimmerman JE, Pack AI (2008) The energy hypoth-esis of sleep revisited. Prog Neurobiol 86:264 –280.CrossRef Medline
Schiltz C, Rossion B (2006) Faces are represented holistically in the human
occipito-temporal cortex. Neuroimage 32:1385–1394.CrossRef Medline
Schwindel CD, McNaughton BL (2011) Hippocampal-cortical interactions and the dynamics of memory trace reactivation. Prog Brain Res 193:163–177.
CrossRef Medline
Sirota A, Csicsvari J, Buhl D, Buzsa´ki G (2003) Communication between neocortex and hippocampus during sleep in rodents. Proc Natl Acad Sci
U S A 100:2065–2069.CrossRef Medline
Skinner EI, Grady CL, Fernandes MA (2010) Reactivation of context-specific brain regions during retrieval. Neuropsychologia 48:156 –164.
CrossRef Medline
Steer RA, Ball R, Ranieri WF, Beck AT (1997) Further evidence for the con-struct validity of the Beck depression Inventory-II with psychiatric out-patients. Psychol Rep 80:443– 446.CrossRef Medline
Sterpenich V, Albouy G, Boly M, Vandewalle G, Darsaud A, Balteau E, Dang-Vu TT, Desseilles M, D’Argembeau A, Gais S, Rauchs G, Schabus M, Degueldre C, Luxen A, Collette F, Maquet P (2007) Sleep-related hippocampo-cortical interplay during emotional memory recollection.
PLoS Biol 5:e282.CrossRef Medline
Takashima A, Nieuwenhuis IL, Jensen O, Talamini LM, Rijpkema M, Ferna´n-dez G (2009) Shift from hippocampal to neocortical centered retrieval
network with consolidation. J Neurosci 29:10087–10093. CrossRef
Tononi G, Cirelli C (2006) Sleep function and synaptic homeostasis. Sleep
Med Rev 10:49 – 62.CrossRef Medline
Vilberg KL, Rugg MD (2007) Dissociation of the neural correlates of recog-nition memory according to familiarity, recollection, and amount of
rec-ollected information. Neuropsychologia 45:2216 –2225. CrossRef
Medline
Vyazovskiy VV, Olcese U, Lazimy YM, Faraguna U, Esser SK, Williams JC, Cirelli C, Tononi G (2009) Cortical firing and sleep homeostasis.
Neu-ron 63:865– 878.CrossRef Medline
Yonelinas AP, Otten LJ, Shaw KN, Rugg MD (2005) Separating the brain regions involved in recollection and familiarity in recognition memory.