This is an author-deposited version published in:
http://oatao.univ-toulouse.fr/
Eprints ID: 11823
To link to this article: DOI: 10.1260/1756-8293.5.4.245
URL:
http://dx.doi.org/10.1260/1756-8293.5.4.245
To cite this version: Chinwicharnam, Kwanchai and Gomez Ariza, David
and Moschetta, Jean-Marc and Thipyopas, Chinnapat Aerodynamic
Characteristics of a Low Aspect Ratio Wing and Propeller Interaction for
a Tilt-Body MAV. (2013) International Journal of Micro Air Vehicles, Vol.
5 (n° 4). pp. 245-260. ISSN 1756-8293
O
pen
A
rchive
T
oulouse
A
rchive
O
uverte (
OATAO
)
OATAO is an open access repository that collects the work of Toulouse researchers and
makes it freely available over the web where possible.
Any correspondence concerning this service should be sent to the repository
administrator:
[email protected]
Aerodynamic Characteristics
of a Low Aspect Ratio Wing
and Propeller Interaction
for a Tilt-Body MAV
Kwanchai Chinwicharnam1, David Gomez Ariza2, Jean-Marc Moschetta3
and Chinnapat Thipyopas1 1Kasetsart University, Bangkok, Thailand 10400
2Faculty of Engineering, Kasetsart University, Bangkok, thailand, 10900 3Institut Supérieur de l’Aéronautique et de l’Espace, BP 54032,
31055 Toulouse cedex 4, France
ABSTRACT
An experimental investigation of the interaction of a propeller-wing configuration for a tilt body MAV VTOL was performed in the low speed wind tunnel. This study’s primary objective is to present the effect of the interactions between a low aspect ratio wing and propeller for a range of incidence in transition between horizontal and vertical flight. During the transition from horizontal flight to vertical flight or vice versa, the flow patterns seen by the wing are the result of the combination between the free-stream and the propeller flow. This was reflected in the change of the aerodynamic forces and moments of the wing. The model is a tractor configuration propeller and with a wing of aspect ratio equal to one, the airfoil of the wing is a NACA 0012. All tests were conducted at low speeds in a range from 2 to 8 m/s. In order to simulate the transition flight of a tilt-body MAV VTOL a range of incidence from -10 to 90 degrees was used. The results show that the flow of the propeller certainly improves the aerodynamic characteristics of the wing, increasing the lift and delaying stall with respect to the flight path of the MAV.
NOMENCLATURE c = Wing chord (m)
n = Propeller rotation speed (rev/s) CD = Drag coefficient
CL = Lift coefficient
Cm = Pitching moment coefficient
CNp = Lateral propeller force coefficient
CT = Thrust coefficient
CX = Total longitudinal force coefficient
D = Drag (N) L = Lift (N) J = Advance ratio
M = Pitching moment (N.m)
l = Installation propeller a head of wing leading edge (m) r = Radial position (m)
xLE = Moment reference point with respect to the leading edge (m) S = Wing area (m2)
T = Thrust (N)
V = Lateral free stream velocity (m/s) VR = Slipstream resulting velocity (m/s)
w0 = Static induced velocity (m/s) X = Total longitudinal force (N)
αMAV= Model angle of attack (deg)
αs = Slipstream angle of attack (deg)
αw = effective wing angle of attack (deg)
ρ = air density (kg/m3)
1. INTRODUCTION
The interaction between wing and propeller is one of the main factors to be taken into account for improvement of the aerodynamic performance of MAV. In aerodynamic terms, for the case of a propeller at incidence the interaction between the propeller slipstream and the lateral free-stream has been shown to be a very challenging problem due to the complexity of this resultant flow. This has been shown by Ribner for full scale propeller in [1] and Gomez in [2] for MAV. Now if a wing is added, the complexity of the problem is increased by the influence of the wing over the propeller and the influence of the resultant combined flow of the propeller and the freestream over the wing. It has been shown by Catalano [3] that the position of propeller has an influence on the wing boundary layer characteristics such as: laminar flow extension and transition, laminar separation bubbles, and reattachment and turbulent separation. It was shown by Catalano that pusher propeller configuration inflow affects the wing characteristics more effectively than the tractor configuration. But it was also shown by Bataille in [4] that to have a good control of the tilt-body MAV, using the control surface of the tractor configuration outperformed the pusher configuration.
It has been shown by Veldhuis in [5] for the full scale aircraft and Hrishikeshavan in [6], Ageev in [7] and Shkarayev in [8], that for MAVs, the propeller slipstream produced a modified flow over the wing where the kinetic energy is increased, modifying the boundary layer characteristic by increasing the Reynolds number and changing the separation behavior.
Similar researches as the one perform by Randall in [9] and [10] have studied in detail the co-axial propeller slipstream effect on the lift and drag of the wing. The results show the slipstream effect on the stall delay, lift augmentation, drag increase, and reduced aerodynamic efficiency. This research studied and supported the Mini-Vertigo MAV. Itasse in [11] studied the characteristic longitudinal flight behavior during an equilibrium transition between vertical/horizontal flight modes. Part of the research focused on the enhancement of the longitudinal control of the MAVion (a tractor configuration MAV of ISAE). Deng et al. in [12] studied the propeller-wing interaction using both the experimental and numerical methods. It was found that the slipstream has a significant influence on the pressure distribution on the wing surface, as well as, explained the pattern of wing-tip vortex at different angles of attack with a rotary propeller. However, the test is limited to low angles of attack. Therefore, the aerodynamic part of wing and propeller interaction is essential to study and understand the performance of MAV during transition flight.
To further understand the behavior of the flow seen by the wing for a single propeller and to isolate the wing forces under the effect of the slipstream from the propeller forces, four different types of models were designed and studied. First an isolated propeller at incidence was tested. Second, an isolated wing was analyzed. Third, a combined propeller-wing model where both are connected was studied. Finally a model of the propeller-wing interaction where the propeller was isolated from the wing was used. For this third model just the wing aerodynamic forces and moments were measured. For all the models the effect of propeller wash or slipstream on the wing aerodynamics during transition flight was the focus of the study and just the fixed-wing tractor configuration was considered. Moreover, the wing down-wash effect over the propeller, which several researches neglected, has been considered in this paper.
2. EXPERIMENTAL SETUP
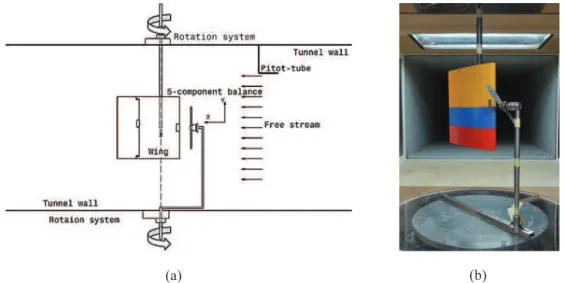
The model information is shown in Table 1 and Figure 1. The test was performed at the ISAE SabRe
wind-tunnel. The model was tested from low incidence angle to high incidence angle; thus the range of the angle of attack (αMAV) varies from -10 to 90 degrees. The model was also designed with a plain flap. The experiments where focused on low Reynolds number. Moreover, the installation of propeller position was also studied.
Figure 1. Model information and tractor configuration model in SabRe
Table 1. Model Information
3. EXPERIMENTAL SETUP
The study of the wing propeller interaction was performed using the measurements of four different experimental models. First, a single isolated propeller was tested at different angles of attack (αp) as shown by Gomez in [2]. A wing only model was started to be a baseline behavior of the wing. The third model was called MPROWM (Mounted propeller on wing model). The aerodynamic forces and moments measured in [2] are subtracted from the total measurements of MPROWM model to obtain the aerodynamic load and moments of the wing under the slipstream influence. Finally a fourth model call SPROWM (Separated propeller wing model) was used to investigate the wing down-wash effect over the propeller.
The MPROWM and SPROWM models were installed in the closed-circuit low speed wind tunnel of ISAE (SabRe). The test section dimensions are 1.2m x 0.8m and 2.4m. The model was positioned
vertically with respect to the flow of test section.
The propeller was moved using the aluminum motor support wedges as seen in Figure 1(b). The propeller was set at two different positions from the leading edge: 7%c and 18%c. The model was
turned from -10 to 90 degrees using an automatic position motor in order to simulate the angle of attack
of the models. The flap deflections were in a range from -10 to +20 degrees. A digital servo mechanism
inside the wing was used to deflect the flap. The propeller speeds were fixed at 5000 RPM and 6000 RPM. The free stream velocity was set in a range from 2 to 8 m/s.
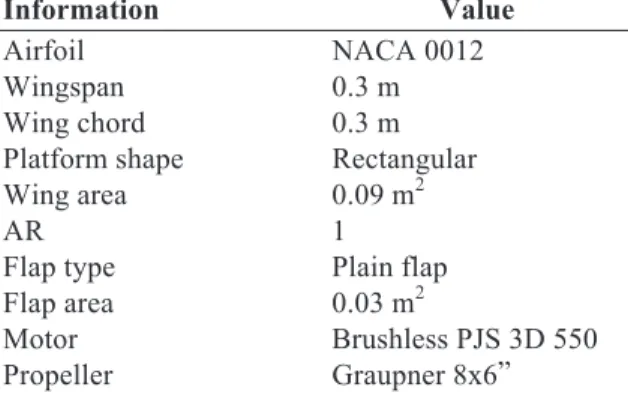
Information Value
Airfoil NACA 0012 Wingspan 0.3 m Wing chord 0.3 m Platform shape Rectangular Wing area 0.09 m2 AR 1
Flap type Plain flap Flap area 0.03 m2
Motor Brushless PJS 3D 550 Propeller Graupner 8x6” and Chinnapat Thipyopas
Figure 2. Model MPROWM a) Wind-tunnel tests set up , b) Actual model in the SabRe wind tunnel
Figure 3. Model SPROWM a) Wind-tunnel tests set up b) Model in the SabRe wind tunnel
The isolated wing, MPROWM and SPROWM were installed at the SabRe wind tunnel shown in Figures 2a and 3a.The forces and moments were measured by the internal five-component Micro Sting Balance (Figure 3) which is limited to 10 N in terms of forces and 0.5 N-m in terms of moments. This balance is made of high strength 35NCD16 alloy steel. The calibration of this balance used in the current investigation follows the same parameter as the calibration performed by Thipyopas in [13].
The acquisition system for SabRe was developed by DAEP Laboratory and is composed of a National Instruments acquisition terminal, six Celians signal conditioners (power supply, signal
amplification, filters), a control and acquisition computer and a National Instrument rack equipped with an interface SCXI module. A Labview based software was developed and used for the control of the
experimental setup and for acquisition of the data.
The data was collected at a sampling frequency 1,000 Hz and recorded after 10 seconds of stabilization time. Moreover, 10 samples for each AOA were used in order to perform an statistical analysis of the data. Note: all of data has been corrected through the wind tunnel wall effects, which is the method of Pope [14].
(a) (b)
(a) (b)
Figure 4. High Sensitive Micro String Balance MicroB
Figure 5. Free body diagram of MPROWM
3.1 Mounted Propeller on Wing Model (MPROWM) and theoretical model
The balance was installed inside the wing. A second calibration was performed including the model weight. The αMAVand flap deflection angle δfwere calibrated as well. αMAVwas calibrated by the use of a portable laser positioning system. δf was calibrated using a potentiometer and a protractor. The bias error observed during the calibration is very small and can be ignored.
The force conventions are considered in terms of the body axis as shown in Figure 5 and 6. In the combination of wing-propeller as shown in the MPROWM model; the resulting aerodynamic forces are generated by the combination of the single propeller forces, the wing forces, and the interaction effects between the propeller wash and the wing down-wash. The main effect of the propeller wash over the and Chinnapat Thipyopas
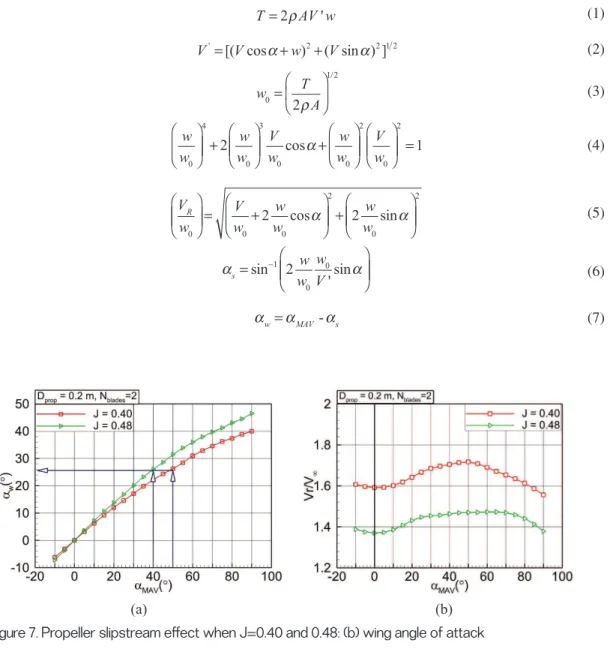
wing is the increase of the Reynolds number and the change of the wing effective angle of attack (αw). As a first approximation αwcan be calculated using the method suggested by McCormick in [15] and shown in eqns (1-7).
The calculated modifications to αw and the resultant velocity vector shown in Figure 5 were performed using the measured experimental thrust. The results of eqn (7) for an advance ratio of J = 0.40 and J = 0.48 is shown in Figure 7a. Figure 7b show the ratio of the resultant velocity with respect to the free-stream velocity. The resultant velocity is calculated using eqn (5).
This theoretical result can be compared with the experimental results to analyze if the predicted behavior of the propeller slipstream matches the observed trends of the MPROWM experiment result.
(1) (2) (3) (4) (5) (6) (7)
Figure 7. Propeller slipstream effect when J=0.40 and 0.48: (b) wing angle of attack
The wing angle of attack (αw) in Figure 7a is smaller than the MAVαMAVdue to the combination between free-stream velocity and the propeller induced velocity which generates the resultant velocity shown in Figure 7b. The wing effective angle of attack (αw) increases as the advance ratio does. This can be explained by, first, the fact that the free-stream velocity is kept constant in function of αMAVand the change of J is due to the decrease in RPM as shown in Table 2. Second, from Figure 6 it can be
deduced that if V is constant and w increases (as thrust increases) the propeller slipstream angle (αs) will also increase with the model angle of attack (αMAV). Taking into account eqn (7) it is seen in Figure 7a how the effective wing angle of attack will tend to decrease as the induced velocity is predominant
(a) (b) αw=αMAV-αs α = α − w w w V sin 2 'sin s 1 0 0 α α = + + V w V w w w w w 2 cos 2 sin R 0 0 0 2 0 2 α + + = w w w w V w w w V w 2 cos 1 0 4 0 3 0 0 2 0 2 ρ = w T A 2 0 1/2 α α = + + V' [( cosV w)2 ( sin ) ]V 2 1 2 ρ = T 2 AV w'
over the free-stream. This of course also means that smaller αwbecomes, further the stall of the wing in function of αMAVwill be delayed. Moreover, the resultant velocity increases as well which causes the wing to experience different Reynolds as αMAVand J increase .
This effect will be studied more in detail in the following sections, although the analysis would be focused on the behavior of the wing with respect to the model angle of attack αMAV. This was done because αMAVrepresents the angle of transition between horizontal and vertical flight .
4. RESULTS
The relation of free-stream velocity in variation of propeller rotation is considered in terms of advance ratio which is shown in Table 2. The aerodynamic coefficient in this paper can be calculated as:
, , , ,
Table 2. Advance ratio equivalences
4.1 Wing and Propeller Wash Effect
4.1.1 Lift coefficient study
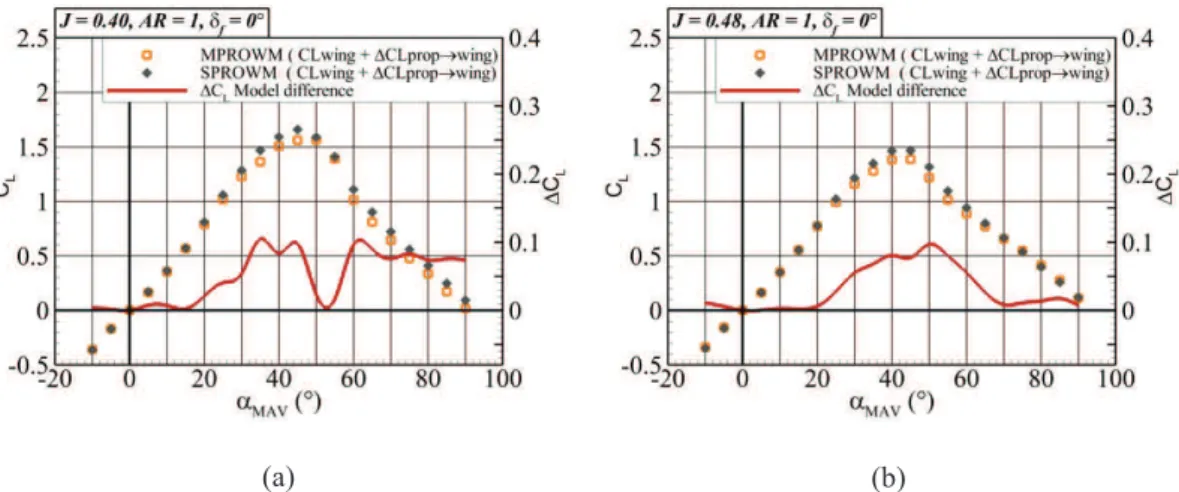
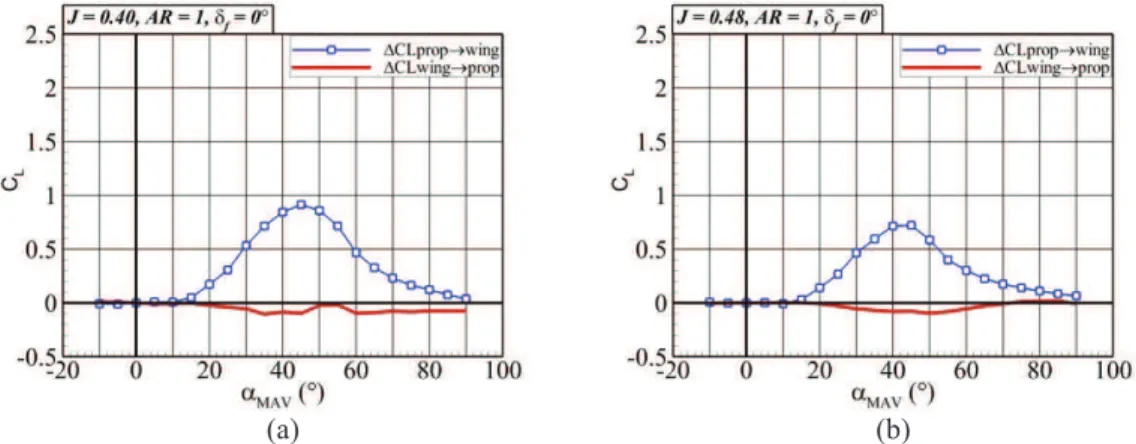
In Figures 9a and 9b, the effect of the prop-wash over the lift coefficient for the MPROWM model can be observed. To obtain the prop-wash effect for the MPROWM model the generated lift coefficient contributions can be derived from eqn (8). By assuming that the effect of the wing down-wash over the propeller is negligible (∆CLwing→prop = 0) the propeller-wash effect (∆CLprop→wing) can be calculated from the measured values of CLtotal, CLwing and CLprop. The total lift coefficient of the wing under the prop-wash effect (CLwing + ∆CLprop→wing) is compared with respect to the total model lift and the unpowered wing lift in Figure 9a and 9b.
(8)
In Figures 9a and 9b it can be observed that the prop-wash has a strong stall-delay effect on the wing. The stall angle in terms of αMAVincreases from 25 degrees to 50 degrees for J=0.4 and 25 degrees to
= + + ∆ → + ∆ →
CLtotal CLwing CLprop CLprop wing CLwing prop
V (m/s) RPM J 6 5000 0.36 8 5000 0.4 8 6000 0.48 = J V nD ρ = C X V S X 1 2 2 ρ = C M V Sc M 1 2 2 ρ = C D V S D 1 2 2 ρ = C L V S L 1 2 2
and Chinnapat Thipyopas
(a) (b)
Figure 9. MPROWM Wing prop-on/off and propeller-wash effect in terms of lift coefficient vs. αMAV: a) J=0.4 b) J=0.48
45 degrees for J=0.48. Moreover the results show that the maximum lift coefficient increases when the
advance ratio decreases. This is due to the increase in induced velocity as the propeller generates more thrust. The maximum wing prop-on lift increases 200% and 175% of the wing lift coefficient by the
propeller-wash effect (CLwing + ∆CLprop→wing) for J=0.40 and 0.48 respectively. These results confirm
again that the propeller slipstream can develop the wing boundary layer characteristics such as laminar separation bubbles, reattachment and turbulent separation as is shown by Catalano in [3].
As seen before, the increase of the stall angle with respect to the free stream αMAVis a consequence of the change in the wing effective angle of attack αwin function of deflection of the slipstream produced by the free-stream (αs). This makes αwstrongly depending on the ratioV∞/wo. So it can be seen that as the propeller axial induced velocity increases with respect to the free-stream velocity, αw will tend to be smaller.
Figure 10 Comparison propeller-wash effect between MPROWM and SPROWM in terms of lift coefficient vs. αMAV: a) J=0.4 b) J=0.48
It can be also be observed that the lift of the wing accounts for almost 40% the total lift of the model
before stall. After the wing has stalled most of the lift is generated by the propeller. This behavior is of course expected, but it should be remarked that longer the stall of the wing is delayed less lifting power from the propeller will be required.
Part of this investigation has been also focused on the effect of the wing over the propeller. Figure 10a and 10b show the calculated prop-wash effect using MPROWM model vs. the measured prop-wash using the SPROWM model. The difference in the behavior of the lift coefficient for both models shows that neglecting the wing-wash effect over the propeller is a reasonable assumption.
Considering the lift difference ∆CLbetween the models, it seems that the MPROWM underestimate by less that 10% the lift coefficient before 20 degrees. Subsequently, the prop-wash has a strong effect
on the model and its maximum is at 40-45 degrees, which is near the stall angle. To further support this
conclusion, using the results of the SPROWM model in eqn (8) the wing-wash effect ∆CLwing→propcan be calculated. The results between the measured ∆CLprop→wingand the calculated ∆CLwing→prop can be observed in Figures 11a and 11b. It is shown that the effect of the down-wash of the wing over to propeller has a tendency to reduce the propeller lift but in comparison with the effect of the propeller over the wing the effect of the down-wash can be neglected for a first approximation to the MAV stability calculations.
(a) (b)
Figure 11 Propeller-wash and wing-wash effect in terms of lift coefficient vs. αMAV: a) J=0.4 b) J=0.48
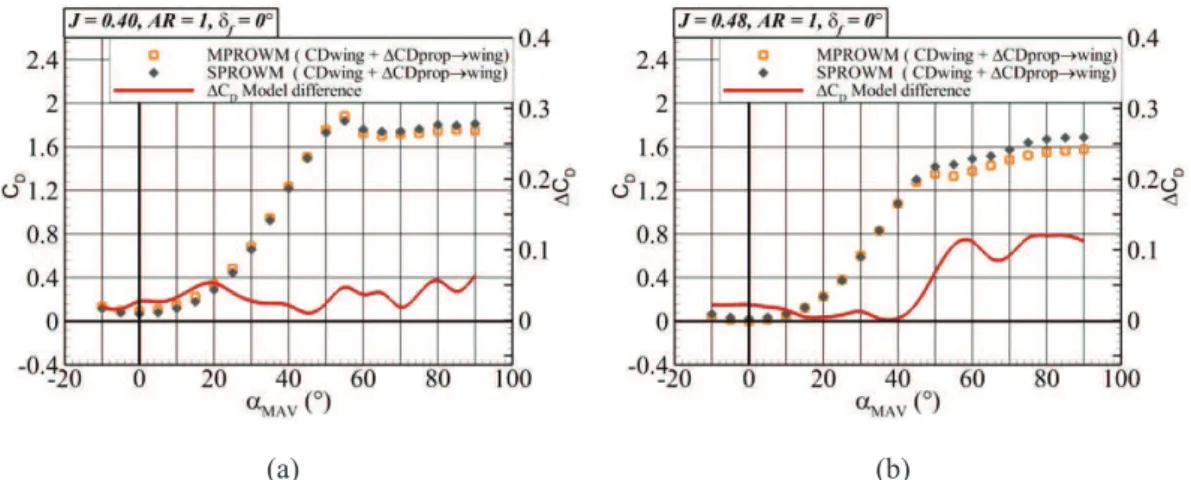
4.1.2 Total Longitudinal Force Coefficient
Figures 12a and 12b show how theCDof the unpowered wing and the CDof the wing under the prop-wash influence in function of αMAV. For this case also wing-wash effect over the wing is ignored. It is seen that the total longitudinal force of the MAVCXtotalmakes a transition at an angle of 25 degrees.
This transition is produced when the horizontal component of the thrust is not strong enough to have a propulsive effect. After 25 degrees CXtotalis transform in pure drag.
Analyzing the propeller-wash effect over the drag of the wing it can be seen that drag increases between a maximum of 190% and 156% for J=0.40 and J=0.48 respectively. For the total model the
maximum CXtotal is found at 90 degrees where for J=0.40 it rises 25% and for J=0.48 it rises 13%
compare with the prop-wash wing drag. This clearly shows that the wing is also responsible for most of the drag produced by the model.
The total longitudinal force and wing drag can be separated in each part of MPROWM as in eqn (9). (9)
The comparison of the propeller-wash effect between MPROWM and SPROWM in terms of drag coefficient is shown in Figures 13a and 13b. It is clear that in the MPROWM model, where ∆CDwing→propis neglected, a good accuracy in terms of prediction of the drag coefficient is obtained. For high angles of attack, when the advance ratio is increased a difference can be noticeable. This difference remains at around 7%.
Figure 12 Wing prop-on/off and propeller-wash effect in terms of drag coefficient vs. αMAV: a) J=0.4 b) J=0.48
(a) (b)
= + + ∆ → + ∆ →
CXtotal CDwing CXprop CDprop wing CDwing prop
(a) (b)
Figure 13 Comparison propeller-wash effect between MPROWM and SPROWM in terms of drag coefficient: a) J=0.4 b) J=0.48
Figure 14 Propeller-wash and wing-wash effect in terms of drag coefficient vs. αMAV: a) J=0.4 b) J=0.48
Figures 14a and 14b show that neither the propeller wash nor wing-wash interaction has an effect on each other between -10 to 25 degrees. But after 25 degrees a remarkable effect of the prop-wash over
the wing can be seen. For a J = 0.4, it is seen that the wing-wash effect does not have any major effect
over the propeller. On the other hand for aJ=0.48, it is seen that the wing-wash produces a small
increment of the thrust of the propeller which can account for the difference between the models seen in Figures 13a and 13b. Again, it can be seen that even if at high advance ratios certain differences between the models can be observed, the fact of ignoring the wing-wash effect over the wing has shown to be a valid supposition also in terms of drag prediction.
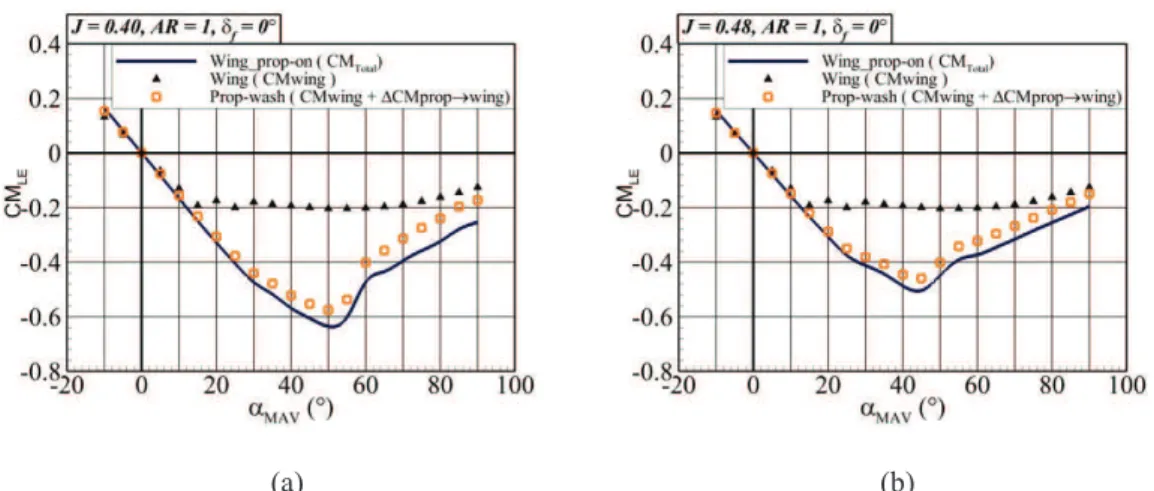
4.1.3 Pitching Moment Coefficient (LE)
The pitching moment is considered at the wing leading edge (LE), thus the negative values represent a pitch-down moment and the positive values a pitch-up moment. Figures 15a and 15b shows that the maximum CMLE increases about 290% for J=0.40 and 250% for J=0.48 with respect to the unpowered
configuration. It can be observed that before the stall of the unpowered configuration the slope of the linear part is the same for the powered and unpowered configurations.
(a) (b)
(a) (b)
The MPROWM CMLE can be separated by the contribution of each model element and its interactions:
(9)
where, CMprop= CTr + CNpxLE
It is shown in [2] that for a propeller at incidence the resultant propeller thrust CTis not applied at the center of the propeller. This is due to the asymmetric distribution of the thrust over the propeller disk. But, due to the fact that the radius of the current propeller is really small and the fact that the total off-axis thrust does not displace more than 45% away from the center of the propeller, it is safe to assume that for this type of propeller the pitching moment produce by CTr can be neglected. To predict
the pitching moment of the wing under the effect of the prop-wash (for the MPROWM) the wing-wash effect is ignored again.
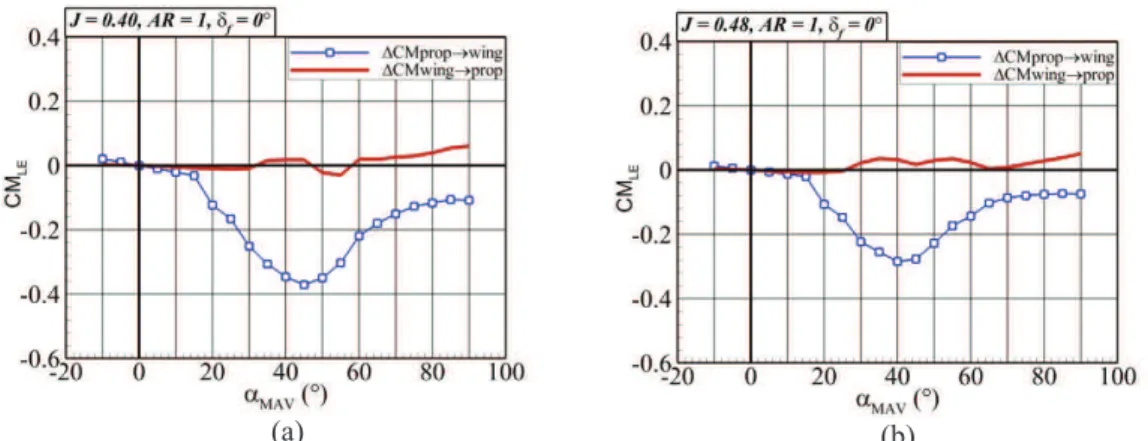
The effect of neglecting the wing-wash effect over the propeller on the pitching moment can be studied by comparing both experimental models MPROWM and SPROWM. As shown in Figures 16a and 16b it is observed that neglecting the effect of the wing wash over the propeller in order to calculate the prop-wash effect over the pitch moment has no major difference with respect to the measured experimental value (SPROWM model).
Figure 16. Comparison propeller-wash effect between MPROWM and SPROWM in terms of pitching moment coefficient at wing leading edge: a) J=0.4 b) J=0.48
(a) (b)
= + + ∆ → + ∆ →
CMtotal CMwing CMprop CMprop wing CMwing prop
and Chinnapat Thipyopas
(a) (b)
Figure 15. Wing prop-on/off and propeller-wash effect in terms of pitching coefficient vs. αMAV: a) J=0.4 b) J=0.48
Figure 17. Propeller-wash and wing-wash effect in terms of pitching moment coefficient vs. αMAV: a) J=0.4 b) J=0.48
It can be observed in a and 17b that the wing-wash effect over the propeller tens to further increase the pitching up moment . This can be explain by the fact that the wing hash effect tends to increase the propeller angle of attack as explain in [5], and it is show in [2] that the pitching moment of the propeller tends to increase with the angle of attack. It is clear again that the effect of the prop-wash ∆CMLEprop→wingover the moment of the wing is more important in comparison with ∆CMLEwing→prop.
4.2 Wing behavior in transition
Figures 18a to 18c show the behavior of the lift, drag and pitching moment coefficient curves in function of αw. The effect of the increased Reynolds number is reflected in the change of magnitude observed in the lift and drag coefficients. It should be noted that the Reynolds number increase is due to the increase in the resultant velocity as seen by the wing as observed in Figure 7b. It should be noted that as the advance ratio increases and the induced velocity of the propeller decreases the deflection of the slipstream also will increase. This increase in αs will of course increase αw. This is why it can be seen that the maximum αw for J = 0.48 is around 50 degrees and for J = 0.4 it is around 42 degrees
(Note: The maximum αw is obtained for an αMAV= 90 degrees). In Figure 18a the lift behavior of the
wing can be analyzed. But first it should be remembered that the stall angle for the current wing in an unpowered configuration is around 25 degrees as shown in Figures 9a and 9b. Taking this into account, it is clear that from the point of view of the wing a delay in the stall angle is also observed. Of course, the magnitude of the delay is smaller in comparison with the stall delay with respect to αMAV. But in this case, it seen more clearly how the increased circulation produced by the prop-wash delays the wing stall by controlling the separation of the boundary layer.
Analyzing closer Figure 18a, a very particular behavior can be observed. As the advance ratio increases the VRdecreases, which accounts for the magnitude reduction of the lift, drag and pitching moment coefficient. But a further stall delay is observed as the advance ratio increases. This behavior can be attributed to the embedded characteristics of low aspect ratio wings, where the vortical lift is predominant. So as VRdecreases, the vortical structures over the wing are not dissipated as fast. These vortical structures have a positive effect over the attachment of the boundary layer which is reflected in a stall delay.
(a) (b)
4.3 Stream-wise Propeller Position Effect
The position of the propeller was changed from 7% to 18% of the mean aerodynamic chord with respect
to the leading edge. This change of position was done to investigate the influence of the separation of the propeller from the wing over the behavior of the slipstream over the wing.
It was found that the slope over the stall of the wing for a propeller located at 18%c decreases
immediately after stall but the propeller located at 7%c reduces gradually. This can be explained by the
fact that if the propeller is closer to the wing, it can better control the flow around the wing and less deflection due to the lateral free stream will be experience.
As the propeller flow develops in the axial direction the VRdecreases, so the propeller position also has an impact over flow attachment over the wing surface. It is observed that for the small gains observed in terms of the lift coefficient a higher penalty in drag is paid as the propeller is closer to the wing. To understand the relation between the drag increase and the propeller proximity to the wing, it becomes necessary to study the topology of the flow in function of this parameter.
It can be concluded a priori that even with the drag penalties observed the best performance of the wing is obtained when the propeller is installed close to the wing. Previous studies as the one presented in [5] have shown the results for low αMAV. The current results show that a delay of the stall or even an improvement in the lift behavior of the wing can be obtained by reducing the distance between the propeller and the wing leading edge. It should be noted that there are small differences of RPM at very high angles of attack which are produced by the in-plane free-stream velocity component and the small effects of the wing down-wash over the up-going and down-going blades. But it is considered that the changes are so small that they can be neglected as an influence parameter in the comparison of the propeller position.
4.3 Flap Deflections Effect
Some studies of the flap deflections effect were performed for the MPROWM with a flap deflection range from -10 to 20 degrees. In Figures 20a and 20b the behavior of the lift and drag coefficient for
the power and unpowered flap is compared. As explained before the aerodynamic behavior of the wing is improved due to the influence of the prop-wash. The prop-wash develops the boundary layer on the wing surface and tends to keep a laminar flow at higher incidence angles. This also affects the flap and Chinnapat Thipyopas
Figure 18. Propeller slipstream effect over a) lift , b) drag and c) pitching moment coefficients for J = 0.40 and 0.48 vs. the effective wing angle of attack
behavior because as the separation of the boundary layer is delayed the flap can maintain its effectiveness. The increase in the wing CL and CD is consequent with the increase in magnitude observed for the unpowered configuration. A clear increase of the flap effectiveness at high angles of attack is observed. In the linear slope part the increase in CLδffor each 10 degrees is equal to 0.35 the
increase of CDδf is equal to 0.25. Further studies of the deflection of the prop-wash produced by the flap and the behavior at extreme high angles is necessary to understand the loss of efficiency.
for a Tilt-Body MAV
Figure 20. Flap deflection effect on the MPROWM : a) lift coefficient, b) total longitudinal force coefficient Figure 19. Propeller distance installation effect
(a) (b)
5. CONCLUSIONS
Due to multi-function of MAVs, it can tilt body from horizontal to vertical flight, as well as hover. Thus it is important to know to aerodynamic characteristics which influence flight control while flying. In order to investigate the aerodynamic characteristics, the study was focused on the interaction between a wing and propeller. Additionally, this research has focused on the effect of the propeller with respect the leading edge of the wing. The models used in this research consist of a basic configuration of a
NACA 0012 low aspect ratio wing powered by a propeller. This was used to explain the aerodynamic performance and interaction between wing and propeller for tilt body MAVs.
• The models were tested in the SabRe wind tunnel and found that the MPROWM aerodynamic
forces and moment are not only generated by the singular wing and propeller, but also the slipstream effect interactions with the wing.
• Moreover, the slipstream is divided into propeller-wash effect and wing-wash effect. The propeller-wash has the large effect, but the wing-wash over the propeller has a very small effect in comparison. The influence of propeller-wash on the wing develops the boundary layer and keeps a laminar flow at higher incident angle commonly found during transition. These effects increase the wing performance and delay stall angle.
• As the propeller is installed close to the wing leading edge minor improvements in the efficiency are observed in comparison with the farther position. This efficiency increase is observed because as the distance between the propeller and the wing leading edge is decreased, so is reduced the effect of the lateral flow over the propeller-wash.
The experimental data of this study can only explain the interaction between wing and propeller of tilt body MAVs in terms of aerodynamic loads and moments coefficients. Therefore the future work will use Computational Fluid Dynamic (CFD) methodology. In order to achieve the level of detail to describe the flow topology and behavior that occurs in the propeller-wing interaction, as well as, confirm the assumptions of experimental study about the flow, the numerical methodology uses the FLUENT. This intends to explain the propeller slipstream which is the main point of flow around the wing. The k-ε RNG turbulent model is applied. The main interest is that the RNG model in FLUENT provides an option to account for the effects of swirl or rotation. The Pressure-Velocity coupling solves to get the convergence by the SIMPLE C algorithm. The propeller is assumed to be an actuator disk. Moreover UDF is called for the actuator disk boundary condition which the velocity polynomial profile function of propeller is suggested by Rosen in [16]. A structured C-grid type is used and shown in Figure 21(a). The first case at zero AOA has been done and shows the axial velocity contour plot in Figure 21(b), which also found the axial velocity increases at propeller downstream.
Figure 21. a) Structure C-grid of wing and actuator disk, b) Axial velocity contour plot when the MPROWM αMAV= 40 degrees and free-stream velocity 6 m/s
5. ACKNOWLEDGMENTS
1st and 4th authors would like to thank the support of project by The Thailand Research Fund; TRF’s Grant no. MRG5580235. The authors appreciate the help and contributions of Rèmi Chanton, Sebastien Prothin and other members of the DAEP SUPAERO with the experimental setup preparation. Finally, the authors would like to thank Ryan Randall, his previous works helped and gave invaluable information.
REFFERENCE
[1] Ribner, H. S., Propellers in yaw. NACA Rept. 820, 1943.
[2] Gomez, D., Study of the Sensitivity to the Lateral Wind of a Mini Unmanned Aerial Vehicle with VTOL Flight Capabilities, PhD thesis, ISAE, 2013.
[3] Catalano, F.M., On the Effects of an Installed Propeller Slipstream on Wing Aerodynamic characteristics, Acta Polytechnica, 2004, 44(3), 8–14.
[4] Bataille, B., Moschetta, J.-M., Poinsot, D., and Berard, C., Development of a VTOL Mini-UAV Multi-tasking Missions, The aeronautical Journal, 2009, 113(1140), 87–98.
[5] Veldhuis, L., Propeller Wing Aerodynamic Interference, Delft University of Technology
Netherlands, Netherlands, 2005.
[6] Hrishikeshavan, V., Bogdanowicz, C., Chopra, I., Experimental Investigation of Performance of a Wing-Propeller System for a Quad-Rotor-Biplane Micro Air Vehicle, in: 54th AIAA/ASME/ASCE/AHS/ASC Structures, Structural Dynamics and Material Conference, AIAA,
2013
[7] Ageev, N. D., Numerical investigation of disc-wing MAV with propeller in a wing slot, in:
Proceedings of the international Micro Air Vehicles conference, Multi-science, 2011
[8] Shkarayev, S., Hoffmann, C., Longitudinal aerodynamics of a vertical takeoff and landing micro air vehicle. Journal of Aircraft, 2011,. 48(1), 166-176.
[9] Randall, R., Hoffmann, C.-A. and Shkarayev, S., Longitudinal Aerodynamics of a Vertical Take Off and Landing Micro Air Vehicle,Journal of Aircraft, 2011, 48(1), 166–176.
[10] Randall, R., Shkarayev S., Abate G. and Judson B., Longitudinal Aerodynamics of Rapidly Pitching Fixed-wing Micro Air Vehicle, Journal of Aircraft, 2012, 49(2), 453–467.
[11] Itasse, M., Moschetta, J.-M., Ameho, Y. and Carr, R., Equilibrium Transition Study for a Hybrid MAV, International Journal of Micro Air Vehicles, 2011, 3(4), 229–246.
[12] Deng S., van Oudheusden, B.W., Xiao, T. and Bijl, H., A Computational Study on the Aerodynamic Influence of a Propeller on an Mav by Unstructured Overset Grid Technique and Low Mach Number Reconditioning, The Open Aerospace Engineering Journal, 2012, 5, 11–21.
[13] Thipyopas, C. and Moschetta, J.-M., Experimental Analysis of a Fixed-wing VTOLMAV in ground effect,International Journal of Micro Air Vehicles, 2010, 2(1), 33–54.
[14] Pope,A., Barlow, J.B. and Rae, W.H.,Low-Speed Wind Tunnel Testing, 3rdedition, John Wiley &
Sons Inc., NewYork, 2011.
[15] McCormick, B. W., Aerodynamics of V/STOL Flight. Dover, New York, 1967.
[16] Rosen, A. and Gur, O., Novel Approach to Axisymmetric Actuator Disk Modeling. Journal of AIAA,2008, 46(11), 2914–2925.