Contents lists available atScienceDirect
Journal of Non-Crystalline Solids
journal homepage:www.elsevier.com/locate/jnoncrysolIn
fluence of the normal load of scratching on cracking and mechanical
strength of soda-lime-silica glass
Nasreddine Bensaid
a, Saci Benbahouche
a,⁎, Fouad Roumili
a, Jean-Christophe Sangleboeuf
b,
Jean-Benoît Le Cam
b, Tanguy Rouxel
baLaboratoire de Mécanique de Précision Appliquée– Institut d'Optique et Mécanique de Précision, Université Ferhat ABBAS, Sétif 1 19000, Algeria bDépartement Mécanique et verre, Institut de Physique de Rennes, UMR UR1- CNRS 6251, Bât. 10B, Campus de Beaulieu, 35042 Rennes cedex, France
A R T I C L E I N F O
Keywords: Scratch Median crack Lateral crack Strength GlassA B S T R A C T
The response of glass to a scratch experiment isfirst reviewed. Then the influence of the applied load on the microcracking pattern, the apparent friction coefficient, and the strength (post scratch test) are studied and discussed for a soda-lime-silica glass (standard window glass composition). As the normal load increases, the depth of the radial crack seems to stabilize at about 100μm length. Correlatively it is observed that the residual strength of the scratched glass remains at about 40 MPa whatever the scratch load above 0.5 N. Generally, this work contributes theoretically in the understanding of the existing factor controlling scratch in glasses.
1. Introduction
Contact between a solid particle and a surface of a brittle material is fundamentally interesting to understand the formation and the propa-gation of cracks as well as the deterioration in general on the ceramics and glasses surface exposed to the different exterior attacks either by erosion, abrasion corrosion or by scratching. It also constitutes a basic method to estimate the hardness of an indentation or scratching and the resistance to rupture of brittle materials.
Glass is a material particularly sensitive to surface damage which can occur when objects are formed, handled or used. Among all the surface damage features, the radial/median cracks have a direct influ-ence on the mechanical strength while the lateral cracks are detrimental to the optical properties (transmission or reflection). Scratching is then of paramount interest because it affects the strength[1]. Knowing the scratch shape permits correlating the response of the material, under controlled contact solicitations, to the physical mechanisms that govern the nature of the damage[2–9].
When performing the scratch test, controlling the contact loading history is necessary because scratches are not only plastic deformation but also cracking, a phenomenon sensitive to the environment[10]and the stiffness of the scratching device[11].
Along a scratch performed under a monotonous increasing load on the glass, three different damage regimes are typically observed[3–5] (Fig. 1):
1) Micro ductile regimeI (permanent track without visible damage). 2) Micro-cracking regime II, presence of lateral cracks reaching the
surface– chips or flakes, and curved radial cracks – chevron. 3) Micro abrasive regimeIII (presence of much debris and eventually
of small emerging lateral cracks).
2. Experimental procedure
The glass used in this study was a soda-lime-silicafloat glass man-ufactured by ENAVA (Entreprise Nationale du Verre et Abrasifs, Algeria). Samples were square-shaped, 30 × 30 × 4 mm3, cut from the
same plate.
The chemical composition given by ENAVA is inTable 1. Young's modulus (E): 72 GPa, Poisson's ratio (ν): 0.22 and hardness (Hv): 6.55 GPa were measured respectively by ultrasonic pulse echo technique and macro indentation[12].
Samples were scratched with a laboratory homemade linear scle-rometer, designed to permit loading and scratch velocity to be con-trolled during the test. The tangential and the normal forces were re-corded during the test[3]. The indenter was a Vickers diamond type, leading edge oriented.
The scratches were made under different normal loads (W): 0.1; 0.3; 0.5; 0.7; 1.0; 1.5; 2.0 N ( ± 0.01 N), with a constant scratching velocity of (10 ± 1)μm/s.
The loading path was composed of a ramp followed by a plateau (Fig. 2).
https://doi.org/10.1016/j.jnoncrysol.2018.01.004
Received 12 September 2017; Received in revised form 28 December 2017; Accepted 1 January 2018
⁎Corresponding author.
E-mail address:[email protected](S. Benbahouche).
Available online 04 January 2018
0022-3093/ © 2018 Elsevier B.V. All rights reserved.
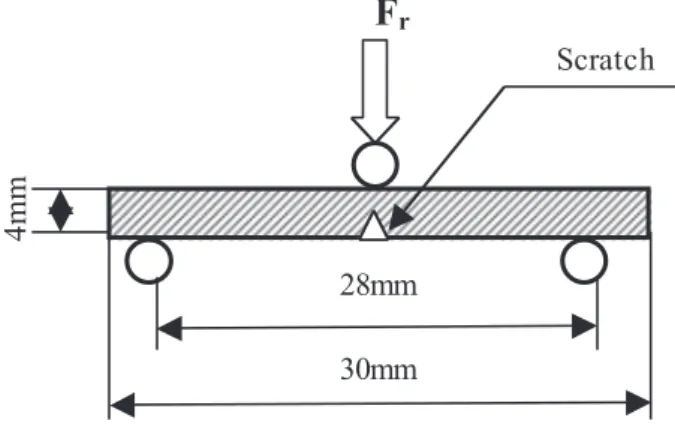
Just after scratching, top view microscopic observations have been done using a microscope 2D and bending tests were performed on specimens to determine strength, with a three points bending device mounted on a LLOYD LR 50 K compression testing machine (Fig. 3). The scratch was positioned under the upper loading point so as to have the maximum opening tensile stress perpendicular to the scratch[1]. The median crack length was measured at the origin of the rupture, on the fractured surface after the strength test.
The monotonous loading rate three-points bending test is carried out according to the instructions of the NFT57-105 standard, then the mechanical strengthσrhas been calculated using[7,13].
= F l ba σ 3 2 r r 2 (1)
with Fris the fracture load, l the distance between the two lower
sup-ports (28 mm), b the width of the sample (measured for each sample) and a the thickness of the sample (4 mm).
3. Results and discussion
The top view optical observations of scratches obtained for each condition are gathered inTable 2. A schematic representation of the subsurface crack pattern has been drawn for each scratch.
We can observe that for 0.1 N, there is only the birth of the median crack, and from 0.3 N until 0.7 N, lateral cracks initiate and propagate inside the material without intersecting the surface. Beyond 1 N until 2 N lateral cracks are intersecting the surface and result in chips growing while increasing the load. The micro abrasive phenomena is occurring at the end of the scratch due to the plowing of the indenter with glass debris (chips and fragments) when scratching.
Increasing the load (W) modifies the cracking system and develops the elasto-plastic deformation, which causes an increase in the tan-gential force (Ft). The apparent friction coefficient μ0, ratio between Ft
and W, allows for a better understanding of the influence of all these effects when plotting versus the normal load W (Fig. 4).
The apparent friction coefficient increases almost linearly until W reaches 0.7 N and then stabilizes for W around 2 N. In the case of scratching of glass, we consider that the tangential effort, (Ft) should be
divided as follows: a ductile deformation effort (Fdef), a coulombian
friction effort (Ff) and a cracking effort (Fcr): Ft= Fdef+ Ff+ Fcr.
Thus = = + + = + + μ F W F F F W μ μ μ t def f cr def f cr 0
withμdef= tan (β) = constant (considering a pure plastic deformation,
where β: is the rake angle), μf =F
W
f
= constant (considering a Coulombian friction).
Extrapolatingμ0to W = 0 allows measuring the Coulombian
fric-tion coefficient μf= 0.16, a key parameter when trying to model and
simulate scratching experiment by means of numerical methods. When W > 0, assuming thatμdefandμfare constant, the increase of
the apparent friction coefficient μ0in the range [0.1–0.7 N] is due to the
cracking effort Fcr which rises as the median crack. Above 1 N the
cracking effort Fcrbecomes more stable due to the occurrence of the
lateral cracking acting as a lever on rear side of the indenter. Focusing on the cracking phenomena, the depth of the median crack pcrackincreases rapidly for loads ranging from 0.1 to 0.7 N, the upper
bound to represent the median to lateral crack transition (Fig. 5). To model the increase of the median crack depth pcrackas a function
Fig. 1. Typical scratch obtained on a soda-lime-si-lica glass[3].
Table 1
Chemical composition of the glass.
Oxides SiO2 Na2O CaO MgO Al2O3 K2O SO3 Balance
Wt (%) 71.5 1.77 8.33 3.97 13.2 0.83 0.69 0.20
M
x [mm] W[N]
Plateau extending over 1.5 mm scratch length= 1.5mm Ramp = 0.5 mm
Fig. 2. Loading path consisting of a ramp and a constant-load plateau.
4m
m
28mm
F
r30mm
Scratch
of applied normal load W, one can use the model proposed by Swain [14–15]: = ⎛ ⎝ ⎜ + ⎞ ⎠ ⎟ p π m μ K ψ W 1 1 tan crack e c 2 2/3 2/3 (2) whereμ is the Coulombian friction coefficient, Kcthe toughness,ψ the
half-angle at the vertex of the indenter and mea modifying factor that
Table 2
Optical top-view of scratches for the different loads (0.1; 0.3; 0.5; 0.7; 1.0; 1.5; 2.0 N) at a constant velocity V = 10 μm/s. W [N] Crack scheme Optical top-view of the scratch 0.1 0.3 0.5 0.7 1.0 1.5 2.0
0,0
0,5
1,0
1,5
2,0
0,00
0,05
0,10
0,15
0,20
0,25
0,30
W[N]
μ
0Fig. 4. Effect of normal load on the friction coefficient (μ0).
0,0
0,5
1,0
1,5
2,0
0
20
40
60
80
100
120
140
160
P crack experimental Swain 2.5µm/s Swain original formula Our proposed modelP
crack]
m
µ[
W[N]
takes into account slight differences in crack shape from that considered by Lawn and Fuller[15]and also allows for the increased indentation pressure.
The comparisons of Swain's experimental results obtained for a scratching velocity of 2.5μm/s with ours show a good agreement even if the scratching speed is a little bit different. When fitting all the data with Swain original formula, one found that the value of the constant meis equal to 8 instead of 4 as proposed in Swain's original publication.
Swain's model is not taking into account a cracking threshold. Reporting the crack depth as a function of the normal load on a graph pcrack= f(W2/3), allows for an estimation of this threshold (Fig. 6).
The 2/3 power law is in good agreement with the median crack length evolution. A W0= 0.046 N load, below which there is no cracks
pcrack= 0, confirms the existence a threshold.
So, the model in accordance with the experimental results in the range [0.1–0.7 N] that we proposed is:
⎜ ⎟ = ⎛ ⎝ ⎞ ⎠ + − p π m K ψ W W 1 tan (1 µ ) ( ) crack e c f 2/3 2 0 2/3 3 (3) where W0is the threshold load.
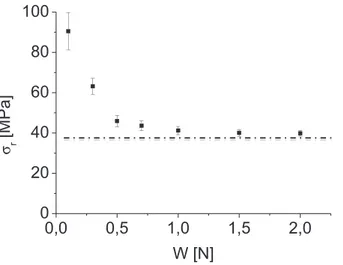
Reporting the mechanical strengthσr, versus the applied load W
below or equal to 1 N (Fig. 7), allows saying that one have a good agreement with the theory of the fracture mechanics, meaning that the mechanical strength decreases with the increase of theflaw size created on the surface.
The mechanical strength tends to stabilize near 40 MPa for a load
larger than 1 N. This confirms the saturation of the median crack length (pcrack) (seeFig. 5).σris clearly controlled by the deepest crack that is
the median crack for the case of scratching.
As a consequence, the optimal load to ensure the good cut of a piece of glass, without any lateral cracks, i.e. with clear edges, is W = 1 N. However, in Swain[14]or Cheng[16]papers, one can deduce that to have a good cut of the glass it's necessary to increase the load to a certain level (seeFig. 5).
The determination of the mechanical strength by three points bending allows characterizing the crack responsible for this rupture that is the median crack. One can consider this surface crack as a semi elliptic one submitted to a tensile stress (seeFig. 8).
The stress intensity factor Kccan be expressed as[17–19]:
= ∅
K σM πpcrack
(4) whereσ is the fracture stress, pcrackis the crack length, M is a correction
factor depending on the position of the crack initiation site (in our case the point A), and M takes the value of 1,14[17–19]. ϕ is an elliptic integral that depends on the ratio pcrack/c (where 2c is the scratch length
in our case):
∫
∅ = sin φ+ p c cos φ dφ crack 0 2 2 2 2 π 2 (5) Measuring the crack length allows to estimate the toughness of the glass from Eqs. 4 and 5. A value of 0.73 MPa.m1/2 is, in goodac-cordance with the value determined experimentally by a 2.492 N in-dentation (Fig. 9). One can notice that the toughness is almost constant, considering the measuring uncertainties, for loads ranging from 0.3 to 2 N. Considering the value of the toughness obtained for 0.1 N, one have a value 15% below the mean ones. This should be due to the fact that one has some low residual stresses on the surface which should
0,0
0,2
0,4
0,6
0,8
1,0
0
20
40
60
80
100
P
crack]
m
µ[
(W)
2/3P
crack=124.52(W)
2/3-15.92
Fig. 6. Effect of normal load for [0.1–0.7 N] on the median crack depth.
0,0
0,5
1,0
1,5
2,0
0
20
40
60
80
100
r]
a
P
M[
W [N]
σ
Fig. 7. Effect of normal load on the mechanical strength (σr).
y
x
2c
p
crackB
A
ϕ
Fig. 8. Semielliptical crack geometry.
0,0
0,5
1,0
1,5
2,0
0,0
0,2
0,4
0,6
0,8
1,0
K
Cm
a
P
M[
1/2]
W [N]
influence the propagation of very short cracks. 4. Conclusion
In this study we tried to simulate two phenomena: one is the ma-chining (carving) of the glass by scratching and the other conditions of aggressions caused by the bad manipulations. These lead to scratches on the soda-lime glass surface (under controlled conditions of the la-boratory) in order to understand the nature of the damage, the system of cracking and the role of one of the scratching parameters which is the load on the evolution of the deterioration.
Our work is essentially based on the influence of the applied load on geometric parameters of the scratch, the median crack, friction coe ffi-cient and their consequences on the mechanical strength as well as the toughness of soda-lime glass.
On the basis of the obtained experimental results, we can conclude that:
•
The deformation level becomes more and more important while increasing the load (W).•
The friction coefficient increases with the increase of the load until 1 N then beyond this load it stabilizes.•
The coefficient corresponding to a pure friction μad= 0.156.•
The growth of the friction coefficient (μ0) for the interval of load[0.1–1 N] is caused by the increase of the cracking effort. Beyond the load of 1 N until 2 N, this effort (Ffis) becomes stable.
•
While increasing the load from 0.1 N until 0.7 N, the depth of median crack (pcrack) increase, which generates the reduction of themechanical strength (σr).
•
Load 0.7 N represents the radial/lateral transition load.•
For loads from 0.1 until 0.7 N, the evolution of the median crack has tendency curve pcrack= 124,52 W2/3–15,92.•
The load line of cracking where we don't have a median crack (pcrack= 0) is W0= 0.046 N.•
From the load of 1 N until 2 N we have a mutual stabilization of the mechanical strength (σr) and of a median crack.•
The optimal load to insure a good cut (machining) of a glass is W = 1 N.•
For loads from 0.3 until 2 N the toughness is almost constant Kc≈ 0.73, but it is weaker Kc≈ 0.62 for the load of 0.1 N.•
For the weak load 0.1 N we have an elastic-plastic deformation. But for the other loads (W > 0.1 N) the deformation is purely plastic. This study offers an additional contribution to understanding and prediction of the soda- lime glass cracking, from the process ofscratching, if it is submitted to very definite aggression conditions and their influences on one of the most important mechanical properties which is the mechanical strength. Finally, we consider that this work is complementary to the works of Swain[14]and Weili Cheng[16]. References
[1] E.B. Shand, Strength of glass– the Griffith method revised, J. Am. Ceram. Soc. 48 (1) (1965) 43–49.
[2] T. Rouxel, Indentation et rayage du verre, Colloque de Sciences des Matériaux, Ecole Polytechnique Fédérale de Lausanne, 25 March, 2003.
[3] V. Le Houérou, J.-C. Sangleboeuf, S. Dériano, T. Rouxel, G. Duisit, Surface damage of soda-lime-silica glasses: indentation scratch behavior, J. Non-Cryst. Solids 316 (2003) 54–63.
[4] T. Rouxel, N. Dély, J.C. Sangleboeuf, Structure-property correlations in Y-Ca-Mg-Sialon Glasses: physical and mechanical properties, J. Am. Ceram. Soc. 88 (4) (2005) 889–896.
[5] S. Dériano, A. Truyol, J.C. Sangleboeuf, T. Rouxel, Physical and mechanical prop-erties of a new borosilicate glass, Ann. Chim. Sci. Mater. 28 (2003) 55–62. [6] A. Djamai, K.-J. Chin, H. Zaidi, Formation et propagation desfissures dans les
matériaux fragiles lors d'un rayage ou d'une indentation par indenteur sphérique, XVIeCongrès Français de Mécanique, 2003 (Nice 1–5 Septembre).
[7] S. Benbahouche, F. Roumili, R. Zegadi, Mechanical strength of tempered soda-lime glass damaged by sand gravitation, determined by bending with circular supports, Glass Technol. 43C (2002) 286–289.
[8] S. Benbahouche, F. Roumili, R. Zegadi, Effect of water on the impact strength of glass plates with eroded surfaces, Mater. Sci. 39 (N1) (2003) 148–152. [9] S. Benbahouche, F. Roumili, A. Seghir, R. Zegadi, Effect of water on the
transmit-tance of glass plates with eroded surfaces, J. Eur. Ceram. Soc. 26 (2006) 1673–1678.
[10] S. Fünfschilling, T. Fett, M.J. Hoffmann, R. Oberacker, G.A. Schneider, P.F. Becher, J.J. Kruzic, Crack-tip toughness from Vickers crack tip opening displacements for materials with strongly rising R-curves, J. Am. Ceram. Soc. 94 (6) (2011) 1884–1892.
[11] K. Li, Y. Shapiro, J.C.M. Li, Scratch test of soda-lime glass, Acta Mater. 46 (15) (1998) 5569–5578.
[12] J.-P. Guin, T. Rouxel, J.-C. Sangleboeuf, Hardness, toughness and scratchability of germanium-selenium chalcogenide glasses, J. Am. Ceram. Soc. 85 (6) (2002) 1545–1552.
[13] J. Zarzycki, Le Verre et L'État Vitreux, Masson, Paris, 1982 (Edition).
[14] M.V. Swain, Micro fracture about scratches in brittle solids, Proc. R. Soc. Lond. A 366 (1979) 575–597.
[15] B.R. Lawn, E.R. Fuller, Equilibrium penny-like cracks in indentation fracture, J. Mater. Sci. 10 (1975) 2016–2024.
[16] E. Weili Cheng, L. Ling, Finnie, Median cracking of brittle solids due to scribing with sharp indenters, J. Am. Ceram. Soc. 73 (3) (1990) 580–586.
[17] John J. Petrovic, Effect of indenter geometry on controlled-surface-flaw fracture toughness, J. Am. Ceram. Soc. 66 (4) (1983) 277–283.
[18] S. Dériano, A. Jarry, T. Rouxel, J.C. Sangleboeuf, S. Hampshire, The indentation fracture toughness (Kc) and its parameters: the case of silica-rich glasses, J. Non-Cryst. Solids 344 (2004) 44–50.
[19] J.J. Kruzic, R.O. Ritchie, Determining the toughness of ceramics from Vickers in-dentations using the crack-opening displacements: an experimental study, J. Am. Ceram. Soc. 86 (8) (2003) 1433–1436.