OATAO is an open access repository that collects the work of Toulouse
researchers and makes it freely available over the web where possible
Any correspondence concerning this service should be sent
to the repository administrator:
tech-oatao@listes-diff.inp-toulouse.fr
This is an author’s version published in:
http://oatao.univ-toulouse.fr/23046
To cite this version:
Texier, Damien
and Monceau, Daniel
and Mainguy, Ronan
and
Andrieu, Eric
Evidence of High-Temperature Strain Heterogeneities in a
Nickel-Based Single-Crystal Superalloy. (2014) Advanced Engineering
Materials, 16 (1). 60-64. ISSN 1438-1656
DOi: 10.1002/adem.201300016
Evidence of High-Temperature Strain Heterogeneities in a
Nickel-Based Single-Crystal Superalloy**
By
Damien Texier, Daniel Monceau,* Ronan Mainguy
and
Eric Andrieu
The use of single-crystal Ni-based superalloys is required in
the manufacture of severely stressed structural parts such as
high-pressure turbine blades.
[liDesign calculations of such
structural parts are based on data acquired from bulk
specimens. [
2! These results allow for the identification of
constitutive laws that homogenize the microstructure re
sponse. The optimization of the macroscopic response of such
materials is mostly due to studies on deformation mecha
nisms. [
3,4! These studies show evidence of the fundamental role
played by metallurgical states and particularly the major role
played by the 'Y h' interfaceJ
5-7l This type of approach
generally conceives the biphasic 'Y/ 'Y' material scale as billions
of cuboidal or rafted 'Y' -Llz precipitates embedded in a fcc
single crystal solid solution matrix. At the intermediate scale
considered in the present study, the material is seen as a
heterogeneous material composed of dendrites surrounded by
interdendritic regions. The goal is to reveal, if they exist,
differences in behavior between the dendritic zone (DZ) and
interdendritic zone (IDZ). To this end, high-temperature creep
experiments were carried out on specimens whose thicknesses
were smaller than the periodicity of the dendritic pattern.
Creep tests on specimens with micrometric thickness have
already been performed under different atmospheres to
highlight the impact of the environment on the mechanical
properties of a turbine blade.[8-lOJ Indeed, great care must be
taken to prevent any static or d
ynamic effect of oxidation on
the mechanical behavior of specimens. Hence, the experiments
reported in the present study were conducted under an
atmosphere optimized for the exclusive growth of a very thin
film of a-alumina at the surface of the specimens, without any
major consequences on the mechanical behavior.
[lll[*] D.
Monceau,
D.
Texier,
R.
Mainguy, E. Andrieu
CIRIMAT, ENSIACET-INPT, 4, Allée Emile Manso
- BP
44362 F-31030, Toulouse, Cedex 4, France
E-mail: daniel.monceau@ensiacet.fr
[**]
The authors are particularly grateful to Turbomeca-SAFRAN
group for providing the base material. This work was part of a
research program supported by DGA involving Snecma
SAFRAN group, Turbomeca-SAFRAN, ONERA, CEAT, and
CNRS laboratories (Mines Paris Tech, Institut P'-ENSMA,
LMT-Cachan, LMS-X, CIRIMAT-ENSIACET).
D.
Texier
is
also grateful to B. Viguier,
S.
Dryepondt,
P. Caron and
J.
Cormier for stimulating discussions.
P. DeParseval and
V.Bay lac are thanked for their help with EPMA and interferometry
analyses.
The material used in this study is a first-generation
superalloy MC2 with the following nominal composition,
Ni-8.0Cr-5.0Co-2.0Mo-7.8W-5.0A1-1.5Ti-6.1 Ta (wt% ). A rod
was solidified by a withdrawal process along the [001]
crystallographic direction then submitted to a standard heat
treatment (1300
°C-3 h
+
air cooling (AC.) - 1080
°C-6 h
+
AC.
- 870
°C-20 h
+
AC.). Due to the solidification settings, the
dendritic pattern can be described as a nested arrangement.
Despite the homogenizing heat treatment, the chemical
segregation at the dendritic scale was large enough to be
detected by scanning electronic microscopy (Figure 1). A mean
distance of 330 µm between the primary dendrite axes (PDA)
and 130 µm between secondary dendrite arms (SDA) was
measured by image analysis.
Creep experiments were carried out with a device designed
and developed specifically for the high-temperature mechani
cal characterization of ultrathin specimens under a controlled
atmosphere. These tests were developed and optimized with
the aim of defining operating conditions that prevent various
problems from affecting the surfaces of the specimens, i.e.,
oxidation, nitridation, or sublimation. First-generation single
crystal superalloys are prone to be non-exclusive alumino
former alloys. Despite the steady-state formation of a
continuous internal a-alumina layer, other oxides such as
transition alumina oxides, spinels, or nickel oxide can grow on
the sides or on top of the a-alumina layer. [
121At atmospheric
pressure, even if an a-alumina layer grows much more slowly
than other oxides, it can be shown that this surface degradation
can still be detrimental to creep experiments on ultrathin
samples. On the other hand, experiments under high vacuum
favor the sublimation of the samples, which considerably affect
the creep results. Ultimately, the best choice was to use a 1.2 bar
Ar atmosphere combined with an 0
2getter (Zr flakes). This
was shown to prevent metal sublimation and to limit alumina
growth. SEM observations of cross sections of creep-tested
samples allowed for the evaluation of the impact of alumina
growth on the evolution of the samples' biphasic microstruc
ture. Samples held for 40 h at 1100
°C did not exhibit any 'Y'
precipitate-free zone or modification of the chemical composi
tion of the substrate.
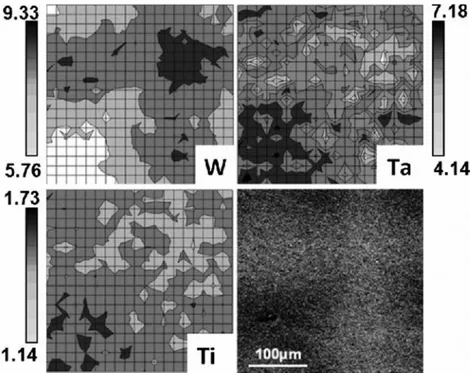
The normalized concentration values (wt%) of segregating
elements W, Ti and Ta are reported in the grayscale map shown
in Figure 2. The darkest zones correspond to the highest
concentration values. The dendritic motif clearly appears
throughout the different elemental maps. The segregation
coefficient for each element (Ki) was calculated from the EPMA
Fig. 1. Dendritic pattern normal to the loading axis. a Arrow is the loading direction,
rectangles are the 50 and 170 µm thick specimens after thinning down. data, in accordance with the method used to quantify the level of segregation for "as-cast" alloysY3,141 This parameter corresponds to the ratio between the mean values of the composition (in wt%) in the dendrite core and in the interdendritic region. Ni (KNi = 0.98), Ta (KTa = 0.88), and Ti
(KT;= 0.91) were observed to segregate into the interdendritic
region, unlike W (Kw =
1.25),
which segregated into dendrite cores and secondary arms. Despite the fact that the K; values are notably doser to 1 than the "as-cast" K; values, these element distributions agree with those reported in previous studies. [l5,161 The potential effect of the distribution of these alloying elements on the creep behavior and the thermal stability of the specimens' microstructure at high temperature justifies the choice to focus on the mesoscopic scale in this study.Fig. 2. Alloying element distribution at the dendrite scale (EPMA).
3
�
---
170µm
SOµm
X )C20
Time (hl 40
)C170 µm
1.5 mm X60
Fig. 3. Creep strain as a function of lime for different specimen thicknesses of single crystal superalloy at 1100 °C and an applied load of 100 MPa.Creep experiments (1100 °C-100 MPa) were carried out on specimens with different thicknesses. The creep results demonstrate a high level of scattering (Figure 3). This dispersion is significantly higher than the dispersion expected from thickness irregularities or the uncertainty in the applied load (�30%). The steady-state strain rates that were measured vary by two orders of magnitude, from 5.9 x 10⁻⁵ to 5.7 x 10⁻³h-1, and no direct correlation could be established between the sample thickness and the creep rate. BSE-SEM observations of specimens' surfaces show difference in proportion of dendritic and interdendritic area from a specimen to another one. Due to the thickness of specimen smaller than the dendritic pattern, the number of primary dendrite axes can be estimated and correlated to the value of steady state rates. Using the analogy of a composite material, considering the primary dendrite axes as long fibers and interdendritic region as the matrix, the more there are fibers in the section of the sample, smaller is the value of steady state rates. Hence, for a same level of stress applied, the value of the steady state rate evolves as a power law expression regarding to the number of dendrite cores, as reported in the Eq. (1).
é=KN'l,oA,
withn = -5.7and K = 5.5 h-1
(1)
Under such creep conditions, the testing of 1.5 mm thick specimens at 1100 °C-100 MPa in air led to creep strain rates that were 17-50 times lower that those observed in ultrathin specimens (dotted curve in Figure 3). The propensity of ultrathin speci mens to be more sensitive to damage can be attributed to the analogy of long fibers for thick specimens and short fibers for ultrathin specimens. It can also be attributed to the number and size of defects initially presentin the material. The foundry porosity,
unavoidable to the elaboration process,
was found to have a deleterious effect on
creep resistance.
[l7l Several foundry pores
could be observed on the fracture surfaces of
ultrathin specimens. Nevertheless, such
porosities (formed during casting or after
homogenization heat treatment) are located
in interdendritic regions. These defects
weaken the "matrix" relatively to the "fibers"
at the mesoscopic scale. The density of pores
in the section of specimens is proportional to
the interdendritic region volume fraction,
thus inversely proportional to the fraction of
dendrite cores. Such a difference in DZ/IDZ
behavior is hidden by the repeatability of the
dendritic pattern for creep experiments on
thick specimens. However, this consideration
has to be taken into account when discussing
the modeling of airfoil blade.
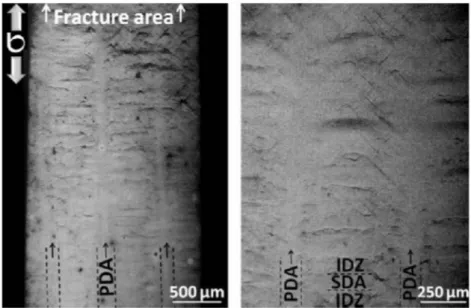
Fig. 4. Strain heterogeneity distribution observed on a creep-tested sample (optical microscopy): (a) LTD-LD observation of the entire width of the sample and (b) magnified image of area between two dendrite trunks.
The post-mortem topography of the
sample gauge length surface was analyzed
by optical microscopy and optical interferometer analyses to
reveal, if they existed, strain heterogeneities. An additional
creep experiment (1100 °C-140 MPa) was especially performed
to conduct further surface observations. Optical microscopy
observations of the surface showed that the variations in
thickness were periodically distributed (Figure 4). These levels
of roughness, which are indicative of the underlying
microstructure, suggest heterogeneities in mechanical
behavior between the dendrite core and the interdendritic
region. The dotted lines in Figure 4 highlight three stripes
with significantly lower roughness, corresponding to the PDA
(BSE-SEM). Moreover, the surface deformation also seems
to be periodically localized between these stripes whose period
corresponds to the secondary dendrite arms (SDA) distance,
i.e., approximately 130 µm.
The local topography of the specimen was investigated
2.5 mm away from the fracture area (Figure 5). The analyzed
zone was also observed by BSE-SEM to correlate the level of
roughness with the dendritic motif. The arithmetical roughness
measured was minimal along the PDA (Ra
PDA= 0.17 µm) and
maximal between them (Rasn
A-IZ = 0.62 µm). Using the height
of the primary dendrite axis as a reference, areas showing
valleys and peaks correspond, respectively, to the interden
dritic regions and SDA.
Such amplitude of the peak-to-valley variation is too high to
be attributed solely to differences in the thermal expansion
coefficient between DZ/IDZ. A similar conclusion can be
drawn with respect to the volume changes induced by
differences in the kinetics of 'Y' precipitate dissolution.
[l&-201Surface topography is therefore likely related to the heteroge
neity of creep behavior between DZ/IDZ. The interdendritic
phase exhibits a lower creep resistance than the dendrite core
or arms. The heterogeneous distribution of alloying elements
precipitate dissolution, is most likely the origin of this
phenomenon.
Microstructural heterogeneities, such as differences in
precipitate size, rafting decay, and misfit differences between
the two regions, have already been observed.
[4--7,21-241
Furthermore, the differences in precipitate sizes have been
observed following standard heat treatments. [
251Nathal and
Murakumo reported on the influence of the mean precipitate
size on the creep response. [
26'271All of these arguments point to
differences in mechanical behavior between both regions,
which were never demonstrated experimentally. This
"composite character" most likely gives rise to strength
redistribution during creep experiments. In this study,
the mechanical behavior of this heterogeneous material is
attributed to the direction of mechanical loading relative
to the microstructural elements composing the material. In
2µm
conclusion, such mechanical heterogeneities may be harmful to the in-service lifetime of thin-walled blades due to the associated size effect, which was taken into account from a mechanical and not an environmental point of view.
High-temperature creep tests were performed on thin specimens (50-200 µm) extracted from a single-crystal super alloy bar. These experiments revealed heterogeneities in creep behavior at a mesoscopic scale, attributed to differences in creep strength between dendrite cores and interdendritic regions. The results singled out the strengthening effect induced by PDA in the superalloy, which therefore behaves as a composite material. The ultrathin specimens were extremely sensitive to foundry defects, intrinsic of the elaboration process and the IDZ. This study demonstrates the need to introduce this mesoscopic scale of heterogeneity to describe the mechanical behavior of Ni-based SX superalloy.
1. Experimental
1.1. Preparation of Ultrathin Tensile Specimens
Creep tensile specimens (length of gauge zone of 20 mm and width of gauge zone of 2 mm) were machined by electric discharged machining (EDM) along the [001] axis of the rod. Two hundred micrometers of material was removed by grinding down to P4000 SiC paper each side and edge of the specimen to avoid any effect of the thermally affected zone due to EDM. A maximal disorientation of 2.1 ° relative to the [001] crystallographic direction and the loading direction was observed. The lateral faces of the specimens were machined parallel to the SDA. Samples were then thinned taking care of both the parallelism and uniform thickness of the specimens, down to 50-170 µm
±
2 µm, i.e., thinner than the period of the dendritic motif. Assuming that the sample thickness does not induce modifications in the MC2 Norton's law parameters, thickness variations lead to a maximal error of �30% in the steady-state creep rate.1.2. Mechanical Test Rig Dedicated for Ultrathin Specimens
Testing ultrathin specimens requires deadweight loading inside the sealed vessel. Specimen heating is performed using a 2-zone halogen lamp furnace. The temperature is measured by two S-type thermocouples welded onto thin Pt sheets located near the gauge zone. A 30 °C min-1 heating rate was used to reach the experimental temperature of 1100 °C. The strain was calculated based on the relative displacement of the specimen grips by using a contact-less LED/CCD optical micrometer. Creep deformation was assumed to begin once the dwell temperature was reached.
1.3. EPMA Analysis
The chemical homogeneity was quantified using a Cameca SX-50 Electron Probe Microanalyzer (EPMA). The analysis conditions (15 kV, 20 nA) allowed for the evaluation of the chemical composition with an accuracy of approximately 300 ppm. The analysis of each element was calibrated with real standards. Ta and W interactions were considered for
quantitative analysis. A dendritic motif was mapped using a square grid of measurements. Each analysed spot of 8 µm3
corresponds to about 100 -y' precipitates, which is large enough to be representative of the material in terms of volumetric fraction.
1.4. Interferometry Analysis
The local topography of the specimen was investigated using a ZygolO00 optical interferometer. The analyzed area, 2.5 mm away from the fracture area, covers 530 x 700 µm2
, with an out-of-plane z resolution of 10 nm.
[1] F. I. Versnyder, M. E. Shank,
Mater. Sei. Eng.
1970, 6,213. [2] P. Caron, T. Khan, J. L. Raffestin, in.Euromat' 89
(Eds: H. E. Exner, V. Schumacher), DGM Informationgesell schaft mbH, Aachen 1989, p. 333.[3] F. Diologent, P. Caron, T. Almeida, A. Jacques, P. Bastie,
Nucl. Instrum. Methods B
2003,200,
346.[4] H. Mughrabi,
Mater. Sei. Technol. Ser.
2009,25,
191. [5] U. Bruckner, A. Epishin, T. Link,Acta Mater.
1997,45,
5223.
[6] R. Volkl, U. Glatzel, M. Feller-Kniepmeier,
Acta Mater.
1998,
46,
4395.[7] T. Link, A. Epishin, U. Bruckner, P. Portella,
Acta Mater.
2000,
48,
1981.[8] R. Hüttner, J. Gabel, U. Glatzel, R. Volkl,
Mater. Sei. Eng.
A Struct.
2009,511,
307.[9] M. Bensch, E. Fleischmann, C. Konrad, R. Volkl, C. M. F. Rae, U. Glatzel, in.
Superalloys 2012
(Eds: S. Huron,R. C. Reed), Wiley, Warrendale 2012, p. 387.
[10] A. Srivastava, S. Gopagoni, A. Needleman, V. Seetharaman, A. Staroselsky, R. Banerjee,
Acta Mater.
2012,60,
5697.[11] S. Dryepondt, D. Monceau, F. Crabos, E. Andrieu,
Acta
Mater.
2005,53,
4199.[12] E. Fedorova, D. Monceau, D. Oquab,
Carros. Sei.
2010,52,
3932.
[13] M. Gungor,
Metall. Mater. Trans. A
1989,20,
2529. [14] M. S. A. Karunaratne, D. C. Cox, P. Carter, R. C. Reed, inSuperall
oys 2000
(Eds: T. Pollock, R. D. Kissinger), TMS,Warrendale 2000, p. 263.
[15] E. Caldwell, F. Fela, G. Fuchs,
JOM
-J. Miner. Met. Mater.
Soc.
2004,56,
44.[16] T. Pollock, S. Tin,
J.
Propul. Power
2006,22,
361.[17] J. B. Le Graverend, J. Cormier, S. Kruch, F. Gallemeau, J. Mendez,
Metall. Mater. Trans. A
2012,43,
3988. [18] J. Cormier, X. Milliet, J. Mendez,J.
Mater. Sei.
2007,42,
7780.
[19] C. Siret,
INPT Thesis,
2010, p. 217.[20] X. Milliet, M. Arnoux, J. Cormier, J. Mendez, C. Tromas,
Mater. Sei. Eng. A Struct.
2012,546,
139.[21] R. Volkl, M. Feller-Kniepmeier, U. Glatzel,