HAL Id: hal-01666696
https://hal.archives-ouvertes.fr/hal-01666696
Submitted on 15 Feb 2019
HAL is a multi-disciplinary open access
archive for the deposit and dissemination of
sci-entific research documents, whether they are
pub-lished or not. The documents may come from
teaching and research institutions in France or
abroad, or from public or private research centers.
L’archive ouverte pluridisciplinaire HAL, est
destinée au dépôt et à la diffusion de documents
scientifiques de niveau recherche, publiés ou non,
émanant des établissements d’enseignement et de
recherche français ou étrangers, des laboratoires
publics ou privés.
Topological and metric properties of microscopic crack
patterns: application to thermal fatigue of high
temperature tool steels
Sabine Le Roux, Farhad Rezai-Aria
To cite this version:
Sabine Le Roux, Farhad Rezai-Aria. Topological and metric properties of microscopic crack patterns:
application to thermal fatigue of high temperature tool steels. Journal of Physics D: Applied Physics,
IOP Publishing, 2013, 46 (29), �10.1088/0022-3727/46/29/295301�. �hal-01666696�
Topological and metric properties of
microscopic crack patterns: application
to thermal fatigue of high temperature
tool steels
S Le Roux and F R´eza¨ı-Aria
Universit´e de Toulouse; Mines Albi, ICA (Institut Cl´ement Ader); Campus Jarlard, F-81013 Albi cedex 09, France
E-mail:rezai@mines-albi.fr
Abstract
The topological properties of heat-checking patterns, produced on the oxidized surface of high temperature tool steels under thermal fatigue experiments, are investigated using image analysis methods. All crack networks are composed of polygonal cells with a mean number of sides close to 6. Whatever the thermal cycling conditions, the semi-empirical Aboav–Weaire’s and Lewis’ laws are quite well verified. The least-squares fit parameters of these laws are discussed and compared with values reported in the literature for other random cellular structures. It is shown that the heat-checking cells undergo a strong shrinkage and that the cellular organization is rather disordered at the beginning of the fragmentation process. The heat-checking networks evolve towards a more stable and ordered state upon cycling. Most disordered cellular networks are obtained at low maximal temperatures and low heating rates. The slope of Lewis’ law is mainly dependent on the maximum heat-flux density applied to the specimen during the heating period. Whatever the test conditions, the stabilized heat-checking networks obey a unique normalized Lewis’ law.
1. Introduction
When a brittle material (like an oxide film on a metallic substrate) is subjected to transient thermal gradients under thermal fatigue (TF), in-plane tensile stresses are generated during the cooling phase, due to thermal expansion mismatch between the layer and the substrate. According to their amplitude, these tensile stresses may be relieved by the formation of a multi-directional interconnected network of cracks on the surface [1]. Similar ‘cooling-induced’ or ‘shrinkage’ cracks patterns are produced in ceramics under thermal shock experiments [2,3], in the glaze of ceramics [4], in solidified basaltic lava flows [5], or in thin layers of desiccating mud or gel [4,6,7]. These networks partition the free surface of the material in a two-dimensional random tessellation of cells, comparable to that formed by grains in planar sections of polycrystalline materials, or by bubbles in soap froths [8].
The topological properties of natural cellular patterns have been studied for a long time, in many scientific fields (e.g. biology, metallurgy, geology, geography) and at widely different size scales (from m2 to µm2) [8]. Most
often, the universal Lantuejoul’s procedure [9], developed for polycrystalline ceramics and based on mathematical morphology, is used to determine the distribution of the number of first neighbours (or sides) of the cells. This method is applicable to all kind of networks, whatever the shape of polygons. However, the computation time can be very long for analysing a structure containing a large number of cells, due to the iterative nature of processing. Bandeira et al [10,11] proposed a multi-layer approach to increase the processing speed of the algorithm, since the spatial resolution of their remotely acquired images was very high. This improved algorithm reduces the computation time significantly, but its application is restricted to tri- and tetravalent networks. Bohn et al [12] investigated the dynamic evolution of the
topological structure of ‘hierarchical’ crack patterns, using the ‘genealogical tree’ of cell division. However, such an approach requires that the cracking phenomenon is observed in situ.
Some semi-empirical statistical rules are commonly used to relate topological and geometrical properties of the cells. The Aboav–Weaire’s law [13,14] states a linear relationship between the number of neighbours (or sides) of a cell, n, and the average number of neighbours (or sides) of its neighbouring cells, m(n):
m(n)= ⟨n⟩ − a + (⟨n⟩a + µ2)/n, (1)
which can otherwise be expressed as
nm(n)= (⟨n⟩ − a)n + µ2+ ⟨n⟩a, (2)
where ⟨n⟩ is the average number of sides (or neighbours) of the cells (⟨n⟩ = 6 in infinite cellular structures), a is a structural constant and µ2is the second moment (or variance)
of the probability distribution P (n) of cell sides (µ2 =
!
P (n)(n−⟨n⟩)2).
This structural equation of state (called ‘nearest-neighbours correlation’) is a quantitative expression of the empirical fact that in planar space-filling cellular structures, many-sided cells tend to be surrounded by few-sided cells, and vice versa. It describes a statistical equilibrium, assuming that there is no correlation in cell shape beyond the nearest neighbours [8]. Since then, some authors [15–17] have shown that Aboav–Weaire’s law can be generalized to more distant neighbours.
Studying the cellular structure of vegetal tissues, Lewis [18] found that the average area of a n-sided cell, ⟨A(n)⟩, was linearly related to n as
⟨A(n)⟩ = α(n − n0), (3)
where both α (slope) and n0 (intercept) depend on the
properties of the cellular structure.
This law reflects the tendency for many-sided cells to be larger, on average, than fewer-sided cells. Using the maximum-entropy principle, Rivier [8,20,21] showed that agreement to this equation of state means that the shaping of the network is governed only by mathematical constraints imposed by the need to completely fill the space without gaps. Furthermore, he defined λ (Lagrange multiplier related to the time) as an important structural parameter with a physical meaning, since it measures the topological ageing in a coarsening structure (like a soap froth or a polycrystalline aggregate). He demonstrated that λ is related both to the slope (α = λ⟨A⟩) and the intercept (n0 = 6 − 1/λ) of Lewis’ law
[20–22]. Equation (3) thus becomes:
⟨A(n)⟩ = ⟨A⟩ [1 + λ(n − 6)] , (4) where ⟨A⟩ is the average area of all cells in the network.
The above-mentioned author has also suggested in [21] that the average area of a cell is linearly dependent on the time, in agreement to Von Neumann’s law [23].
Differentiating Lewis’ law (3) with respect to time, the rate of change of the average area of the cells, d⟨A(n)⟩/dt,
can be expressed as a function of their local topology by the following relationship:
d⟨A(n)⟩/dt = γ (n − 6), (5) where γ is the diffusion constant of the system (γ > 0).
Concretely, this equation implies that, in average, the cells with less than six sides grow, those which have more than six sides shrink, whereas the area of 6-sided cells does not evolve over time. This ‘topological growth’ correlation, established by Von Neumann for soap bubble froths [23], is in fact applicable to any evolving cellular mosaic, such as biological tissues, soap froths and metallurgical grain structures [21].
Both Aboav–Weaire’s and Lewis’ laws have been empirically validated for a wide variety of random cellular systems [8,24], as biological and vegetable tissues [16,18,22,25–27], soap froths [13,28], polygonal convective structures [29], colloidal aggregations [30] and polygonal networks on the surface of stars [31,32]. However, experiments reported in soap foams [26,33] and polycrystalline materials [21,34–36] have shown that Lewis’ law is not always obeyed. For these structures, it is the cell perimeter (or radius), rather than the area, which depends linearly on n (as expressed by Desch’s law [21,37]). The failure of Lewis’ law has been attributed to particular constraints acting on the cellular network, other than strictly the mathematical and universal constraints of space-filling. These additional specific forces, which may be physical, biological or chemical, are linked to the energy carried by the cell interfaces (surface tension in soap froths, or grain boundary in metallurgical aggregates [22]), and associated with the mechanism driving the evolution towards statistical equilibrium [21,30].
In this paper, the topological properties of microscopic crack patterns, produced by TF laboratory experiments on the oxidized surface of a X38CrMoV5 tool steel, are investigated using image analysis and Lantuejoul’s algorithm [1]. Based on many experimental data, topological and metric correlations (such as Aboav–Weaire’s and Lewis’ laws) are verified and compared with other natural cellular structures. The effects of the number of cycles and of the conditions of the TF test are shown and discussed.
2. Experimental procedure
2.1. TF tests
TF experiments were carried out on X38CrMoV5 tool steel, heat-treated to achieve either 42 or 47 HRC hardness. The tubular cylindrical-shaped specimens present an external diameter of 30 mm with a polished surface, and a wall thickness of 10 mm in the central gauge area [38]. During the test, the external surface of the specimen was alternatively fast-heated using a high-frequency induction system, and air-cooled by natural convection. The inner wall was continuously cooled by a flow of water circulating through the central hole of the specimen, thus generating a high thermal gradient.
Several thermal cycles were investigated, with a minimal temperature (Tmin)always fixed to 100◦C, while the maximum
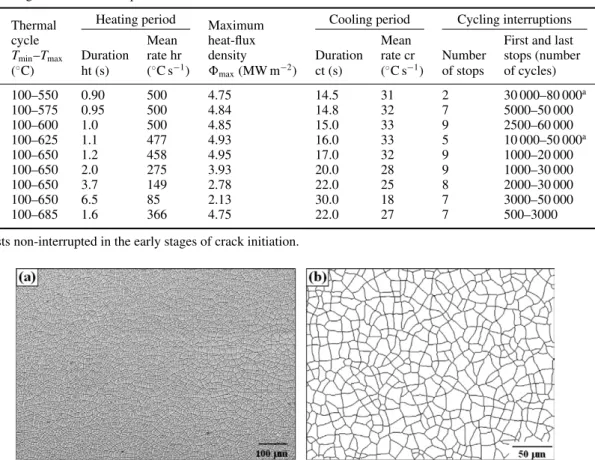
Table 1. Thermal fatigue test conditions performed on 42 and/or 47 HRC treated X38CrMoV5 steels.
Heating period Cooling period Cycling interruptions
Thermal Maximum
TF cycle Mean heat-flux Mean First and last
test Tmin–Tmax Duration rate hr density Duration rate cr Number stops (number N◦ (◦C) ht (s) (◦C s−1) $max(MW m−2) ct (s) (◦C s−1) of stops of cycles)
1 100–550 0.90 500 4.75 14.5 31 2 30 000–80 000a 2 100–575 0.95 500 4.84 14.8 32 7 5000–50 000 3 100–600 1.0 500 4.85 15.0 33 9 2500–60 000 4 100–625 1.1 477 4.93 16.0 33 5 10 000–50 000a 5 100–650 1.2 458 4.95 17.0 32 9 1000–20 000 6 100–650 2.0 275 3.93 20.0 28 9 1000–30 000 7 100–650 3.7 149 2.78 22.0 25 8 2000–30 000 8 100–650 6.5 85 2.13 30.0 18 7 3000–50 000 9 100–685 1.6 366 4.75 22.0 27 7 500–3000
aTests non-interrupted in the early stages of crack initiation.
Figure 1. (a) Typical SEM cartography of the microscopic crack pattern observed on the surface of the specimen; (b) enlarged binary image
of the skeletonised crack network (cracks in black and polygonal cells in white).
temperature (Tmax)was varied from 550 to 685◦C. For the tests
performed between 100 and 650◦C, various heating periods
(1.2 < ht < 6.5 s) were applied, leading to maximum heat-flux densities ($max)imposed on the specimen surface ranging
from 2.13 to 4.95 MW m−2 (table1). The experiments were
regularly stopped in order to investigate the crack pattern evolution, and determine the number of cycles to crack initiation and to achieve a stabilized crack density (see details in [38]). In table 1, for each TF test, the first interruption of cycling (corresponding to the number of cycles when the micro-cracks were detected first), and the last interruption are given (end of the test, when the crack density was fully stabilized).
2.2. Crack pattern analysis
After each cycling interruption, the surface of the TF specimen was observed with a scanning electron microscope and a back-scattered electron detector. By selecting a magnification of 250, an interconnected microscopic crack pattern (named ‘heat-checking’ [1]) was revealed on the superficial oxide layer covering the steel. A matrix of (3 × 3) images was acquired on a randomly chosen area of 0.825 mm2 in
the centre of the specimen. The nine SEM images were assembled to form a cartography sizing about (1740 × 1210) pixels2, with a spatial resolution of 0.5 µm/pixel (figure1(a)).
Using an image analysis algorithm [1] and the Aphelion®
software, the micro-cracks were segmented and skeletonized
(i.e. thinned to one pixel). An example of the resulting two-dimensional cellular network is illustrated in figure1(b). To analyse the topological features of the cellular structure, the cells touching the field border were eliminated, since their neighbourhood was incomplete. Within the ‘measuring mask’ consisting of the remaining cells, between 320 and 4750 cells (Nc)were counted in the 70 heat-checking maps
investigated for this study (table2). Despite their high number, an exhaustive analysis of all cells was systematically carried out, leading to large computation time (typically several hours for most of cartographies). On the other hand, a statistical reliable description of the cellular networks was achieved. A previous study [1] has revealed that the crack-junctions were predominantly tri-, tetra- and pentavalent, excluding the possibility to apply the algorithm developed by Bandeira
et al[11]. Therefore, the analysis was carried out following the procedure of Lantu´ejoul [9], considering that two cells are neighbours if they share at least one side. This method consists of five steps, as illustrated in figure 2: individual extraction of each cell in the measuring mask (a) ; dilatation of size 2 of the selected cell using a square structuring element, which provides markers both in the selected cell and its first neighbours (b); geodesic reconstruction of the cell and its neighbourhood, using image b as a ‘marker’ in the initial cellular mosaic (c); logical subtraction of the central cell (d); labelling and counting of the first neighbours of the central cell (e). These operations were iteratively applied to each cell of the network, leading to a labelled image wherein the cells are
Table 2. Range of variation of topological properties (minimum and maximum values between the first and last cycle interruptions)
calculated on the microscopic heat-checking cells produced under various TF test conditions on 47 HRC heat-treated specimens. Measuring mask Distribution of the number of cell neighbours (or sides) n
TF
test Total number Cell density
N◦ of cells Nc dc(mm−2) nmin nmax ⟨n⟩ µ2 P(6) !7 n=5P (n) 1 2812–3002 3705–4015 3 12–13 6.01–6.02 2.37–2.63 0.19–0.25 0.57–0.66 2 2495–3439 3311–4523 3 11–13 6.01–6.03 2.11–2.94 0.18–0.26 0.52–0.69 3 2256–3381 4109–4606 3 11–12 6.01–6.02 1.73–2.27 0.20–0.26 0.57–0.70 3a 2798–4468 3693–5502 3 11–14 5.98–6.03 1.80–2.96 0.15–0.25 0.53–0.71 4 3645–4133 4746–5370 3 11–12 6.03 1.74–2.20 0.20–0.22 0.58–0.61 5 1855–3509 2487–4593 3 10–13 5.99–6.03 1.27–3.12 0.27–0.32 0.69–0.80 5a 2038–3114 2726–4122 3 10–11 5.96–6.01 1.27–2.31 0.27–0.32 0.70–0.78 6 1567–2187 2322–2919 3 10–13 5.98–6.02 1.52–2.73 0.18–0.23 0.51–0.63 7 479–860 853–927 3 10–11 5.92–6.00 1.85–2.72 0.18–0.29 0.51–0.74 8 323–525 460–718 3 10–12 5.91–5.99 2.33–4.30 0.15–0.25 0.47–0.65 9 2820–3667 3755–4840 3 11–13 5.98–6.02 1.55–2.76 0.25–0.31 0.64–0.77 9a 2651–4749 3952–5294 3 11–12 6.01–6.02 1.75–2.22 0.19–0.22 0.56–0.60 aTest performed on a 42 HRC heat-treated specimen.
Figure 2. Procedure to determine the number of first neighbours (n) of the heat-checking cells [9]: (a) selection of a cell in the measuring mask; (b) dilatation of size 2 of the selected cell; (c) reconstruction of the cell and its neighbourhood; (d) subtraction of the central cell; (e) labelling and counting of its first neighbours; (f ) cellular mosaic in which the cells are classified with a grey level related to their number of neighbours; (g) histogram of frequency distribution P (n) (probability of finding a cell with n neighbours or sides).
classified with a grey level related to their topological class n (figure2(f )). The counting of the cells of each topological class n allowed determining the discrete probability function P (n), as shown in figure 2(g). To compute the average number of neighbours of second order m(n) (i.e. the average number of neighbours of the cells that are adjacent to n-neighboured cells), the previous procedure was repeated for each adjacent cell of the selected n-sided cells. According to Lantuejoul’s algorithm, in the particular case of two different cracks crossing at right angle, thus determining four adjacent cells, all these cells are considered as neighbours since they share a common point on their border (i.e. the intersection of the two cracks).
It should be emphasized that detailed investigations [39] have revealed that under the test conditions examined in this study, spalliation of the oxide layer did not occur in the central useful area of the specimen (although some spalled areas may appear at geometrical singularities such as corners or free edges, due to growth effects leading to high strains of the oxide on highly curved surfaces). However, for maximum temperatures (Tmax)of the thermal cycle lower than
550◦C, oxide scale spalling becomes a non-negligible damage
mechanism. The oxide layer then breaks preferentially by a buckling mechanism, and the heat-checking network is absent or very limited [39]. In such cases, the analysis procedure proposed here would not be appropriate.
3. Topological properties of the heat-checking
networks
3.1. Distribution of number of cell sides
Table2gives some topological descriptors, such as the density of cells in the heat-checking network (dc, i.e. the number of
cells Ncper mm2)and the statistical distribution of the number
of cell sides n (minimum nmin, maximum nmax, average ⟨n⟩,
variance µ2, fraction of 6-sided cells P (6) and cumulative
fraction of 5–6–7-sided cells!7n=5P (n)). These results show that the investigated cellular patterns are composed of polygons whose number of sides lies in the range from 3 to between 10 and 14. The average number ⟨n⟩ varies between 5.91 and 6.03, depending on the TF test. This is very close to the ergodic theoretical value of 6 expressed by Euler’s theorem [8,9,14], indicating that the polygonal cells are predominantly 6-sided
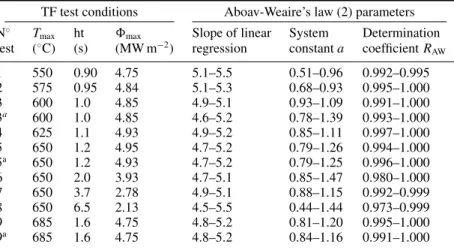
Table 3. Least-squares fit parameters of Aboav-Weaire’s law (minimum and maximum values between the first and last cycle stops)
calculated on the heat-checking networks produced under various TF test conditions on 47 HRC heat-treated specimens. TF test conditions Aboav-Weaire’s law (2) parameters
N◦ Tmax ht $max Slope of linear System Determination test (◦C) (s) (MW m−2) regression constant a coefficient RAW
1 550 0.90 4.75 5.1–5.5 0.51–0.96 0.992–0.995 2 575 0.95 4.84 5.1–5.3 0.68–0.93 0.995–1.000 3 600 1.0 4.85 4.9–5.1 0.93–1.09 0.991–1.000 3a 600 1.0 4.85 4.6–5.2 0.78–1.39 0.993–1.000 4 625 1.1 4.93 4.9–5.2 0.85–1.11 0.997–1.000 5 650 1.2 4.95 4.7–5.2 0.79–1.26 0.994–1.000 5a 650 1.2 4.93 4.7–5.2 0.79–1.25 0.996–1.000 6 650 2.0 3.93 4.7–5.1 0.85–1.47 0.980–1.000 7 650 3.7 2.78 4.9–5.1 0.88–1.15 0.992–0.999 8 650 6.5 2.13 4.5–5.5 0.44–1.44 0.973–0.999 9 685 1.6 4.75 4.8–5.2 0.81–1.20 0.995–1.000 9a 685 1.6 4.75 4.8–5.2 0.84–1.16 0.991–1.000
aTest performed on a 42 HRC heat-treated specimen.
(as in trivalent networks). In all heat-checking networks, the cells having 5, 6 or 7 sides represent 50–80% of the population. The contribution of 4-sided cells and 8-sided cells is minor, whereas cells with 3 sides and 9 sides or more are rarely observed. Rather comparable distributions of cell sides, mainly composed of a pentagonal–hexagonal–heptagonal mix, have also been reported for other cooling-induced crack networks (in thermal shocked ceramics [2] and basaltic lava flows [5]) as well as for many cellular systems (such as soap froths [8,13], polycrystalline materials [9,14,34], B´enard-Marangoni convective structures [29] or polygonal terrains on Mars [32]). On the other hand, shrinkage-crack patterns generated by desiccation (such as in thin layers of dried slurries [6,7] or in a ceramic glaze [4]) form an arrays of predominantly 4-sided polygons.
The variance µ2, which measures the spread in the
probability distribution of cell sides P (n), is a key indicator of the topological disorder which characterizes the deviation of the cellular structure with respect to the perfect hexagonal pattern [29]. The higher the µ2, the more the cells are randomly
distributed in the network and the probability of finding 4-sided cell and/or 8-sided cells is high. Delannay and Le Ca¨er [40] reported that µ2never exceeds 5 in natural cellular structures.
The values determined on the heat-checking patterns fall in the interval 1.27–4.30 (table2), with an average value close to 2.2. A rather comparable degree of disorder was measured in thermal shocked ceramics (where µ2 = 2.75 ± 0.07 [2]),
Al metal grains (µ2 = 2.90 ± 0.8 [34]) and polygonal
terrains on Mars (1.24 < µ2 < 3.46 [32]), despite the very
different size scales of these cellular networks (from µm2
to m2). However, lower values (µ
2 ! 1.5) were reported,
for example in biological cells, cork patterns and B´enard-Marangoni convective structures (see [41] and references therein).
3.2. Aboav–Weaire’s law
As indicated in table 3, all heat-checking networks satisfy the Aboav–Weaire’s law remarkably well. The slope of the regression line is close to 5, and the coefficient of determination
RAW is better than 0.99 in 97% of cases (the minimum RAW
is 0.97). The system-constant a (calculated from the slope (⟨n⟩ − a) of equation (2)) ranges from 0.44 to 1.47. These values are in agreement with those reported in [41] for most cellular networks (0.5 < a < 1.5). Different interpretations of this parameter are proposed in the literature. According to Zsoldos and Szasz [41], a is a numerical expression of the collectivity of the cellular pattern: the more the increase in a, the stronger the collectivity (with a maximum value of 2). A strong collectivity corresponds to the state of minimum energy for the system. It reflects the presence in the hexagonal structure of dipoles (or chains) of pentagonal and heptagonal cells, which can be regarded as ‘topological dislocations’ [8] (like the crystallographic defects or irregularities within the atomic structure of a crystalline material). These local ‘defects’ result from topological transformations (for example successive cell divisions) that change the number of sides of the cells involved. By considering the structure as an elastic solid, the topological dislocations constitute a local manifestation of plasticity [22]. In addition, Cerisier et al [29] have stated that a should be 1 when the cellular mosaic is evolutive, meaning that the cells can coalesce, divide or disappear (such as in polycrystallization processes [13], soap froths [28,42] or biological tissues [25]). In our experiments, the mean value of ais slightly less than 1. We can therefore consider that our heat-checking networks are non-equilibrium structures in which the collectivity is not very strong (the results presented next in section 4.2 will confirm that the cell organization evolves effectively upon cycling).
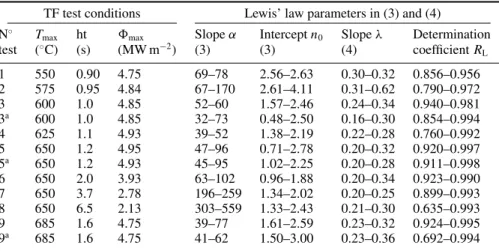
3.3. Lewis’ law
The linear Lewis’ law (3), relating the average area of the cells ⟨A(n)⟩ to their number of sides n, is broadly verified by all heat-checking networks (table4). Determination coefficients higher than 0.85 are found, except in four cases (0.635 < RL <
0.998). The slope α of the linear regression shows a wide variation between 32 and 559, indicating that the mean size of the heat-checking cells may vary considerably from one test to another and during cycling. Parallelly, the intercept n0ranges
Table 4. Least-squares fit parameters of Lewis’ law (minimum and maximum values between the first and last cycle stops) calculated on the
heat-checking networks produced under various TF test conditions on 47 HRC heat-treated specimens. TF test conditions Lewis’ law parameters in (3) and (4) N◦ Tmax ht $max Slope α Intercept n0 Slope λ Determination test (◦C) (s) (MW m−2) (3) (3) (4) coefficient RL 1 550 0.90 4.75 69–78 2.56–2.63 0.30–0.32 0.856–0.956 2 575 0.95 4.84 67–170 2.61–4.11 0.31–0.62 0.790–0.972 3 600 1.0 4.85 52–60 1.57–2.46 0.24–0.34 0.940–0.981 3a 600 1.0 4.85 32–73 0.48–2.50 0.16–0.30 0.854–0.994 4 625 1.1 4.93 39–52 1.38–2.19 0.22–0.28 0.760–0.992 5 650 1.2 4.95 47–96 0.71–2.78 0.20–0.32 0.920–0.997 5a 650 1.2 4.93 45–95 1.02–2.25 0.20–0.28 0.911–0.998 6 650 2.0 3.93 63–102 0.96–1.88 0.20–0.34 0.923–0.990 7 650 3.7 2.78 196–259 1.34–2.02 0.20–0.25 0.899–0.993 8 650 6.5 2.13 303–559 1.33–2.43 0.21–0.30 0.635–0.993 9 685 1.6 4.75 39–77 1.61–2.59 0.23–0.32 0.924–0.995 9a 685 1.6 4.75 41–62 1.50–3.00 0.23–0.36 0.692–0.994 aTest performed on a 42 HRC heat-treated specimen.
Figure 3. Relation between the average number of sides ⟨n⟩ of the
cells and their density dc in the stabilized heat-checking networks.
from about 0.5 to 4. In most cellular systems, n0 generally
stand between 2 and 2.5 [24,29], which is close to the average value found for the 70 heat-checking maps investigated here (n0 = 2.06+2.05−1.58). The parameter λ (calculated from (4), as
the slope of the normalized curve ⟨A(n)⟩/A versus n) lies in the interval from 0.16 to 0.62, with a mean value of 0.27. For comparison, values of the same order of magnitude were reported for B´enard–Marangoni convective structures (where λ= 0.23 in the steady regime [29]), and polygonal networks on Mars (0.26 < λ < 0.51 [32]).
4. Discussion
4.1. Relations between topological quantities
For the stabilized crack networks, the average number of cell sides ⟨n⟩ seems to be strongly linked to the cell density dc
(figure3), according to a power law with a high coefficient of determination (R = 0.936):
⟨n⟩ = 5.76dc0.0052. (6)
This relationship can be attributed to the fact that in finite cellular structure, ⟨n⟩ increases as the number of cells increases
Figure 4. Universality of Lemaˆıtre’s law: correlation between the
variance µ2and P (6) for the heat-checking networks investigated in this work and other cellular structures reported in the literature.
(as stated by Euler’s theorem: ⟨n⟩ ! 6 − 12/Nc [27,30]).
Such observation has also been reported in other cellular structures (two-dimensional soap froths [42], inflorescences of plants [27] and polygonal networks on Mars [32]). In our heat-checking networks, Ncvaries from 323 to 4749, meaning
that ⟨n⟩ should theorically vary between 5.96 and 6.00. In fact, the range of variation found experimentally is larger than expected (5.91! ⟨n⟩ ! 6.03), and values greater than 6.0 are even achieved, as also noted by Saraiva et al. Presumably, this could be explained by the large number of cells (much higher than in other studies) analysed in both cases.
Both the fraction of 6-sided cells P (6) and the topological variance µ2reflect the inhomogeneity of the cellular structure,
the first inversely and the second directly since it measures the topological disorder [30]. Figure 4, plotting the variation of the topological variance µ2 as a function of P (6), confirms
that these two thermodynamic variables are linked, despite the diversity of their origin. As can be seen, our data and those collected in the literature for others 2D cellular structures [2,18,29,31,32,34,35] lie on a single curve. This non-linear relationship between µ2and P (6) was first discovered
empirically by Lemaˆıtre et al in two-dimensional foams [43,44]. Lemaˆıtre’s law has been expressed by Le Ca¨er and
Figure 5. Linear relation between a (expressing the collectivity in
Aboav-Weaire’s law) and the variance µ2, for the heat-checking networks.
Delannay [45], and later by Rivier (based on maximum entropy analysis [46,47]), as
µ2·P (6)2= 1/(2π) = 0.159 (for 0.3 < P (6) < 0.7), (7.1)
and µ2= 1 − P (6) (for P (6) > 0.7). (7.2)
This structural equation of state, which is the equivalent of the virial equation of state in liquids and gases, is very robust for both experimental and simulated cellular systems [22,30,45]. The second expression (7.2) reflects an asymptotic behaviour for P (6) > 0.7. It corresponds to the case of a ‘topological gas’ (TG), which is an ideal model of uncorrelated arrangement of cells introduced by Fradkov [48]. Our experimental data obey (7.1) with good accuracy, confirming the universality of Lemaˆıtre’s law for cellular mosaics as a consequence of maximum entropy inference [46]. Figure4further shows the reliability of this equation in the interval 0.18 < P (6) < 0.3 (hitherto not reported in the literature), indicating that Lemaˆıtre’s law is also valid for highly disordered cellular networks with µ2" 3.
It seems that the parameters of Aboav–Weaire’s law (a and µ2)are interdependent [40,49]. Figure5shows that there
is a tendency for the decrease of the system-constant a when the variance µ2becomes larger:
a= −0.168µ2+ 1.3482. (8)
Even if the scattering is high (R = 0.335), it can be noted that the slope of the linear regression curve calculated from our data (s = −0.168) is very close to that reported by Vincze
et al (s′ = −1/6, with a coefficient of determination even
lower, R′= 0.21 [49]).
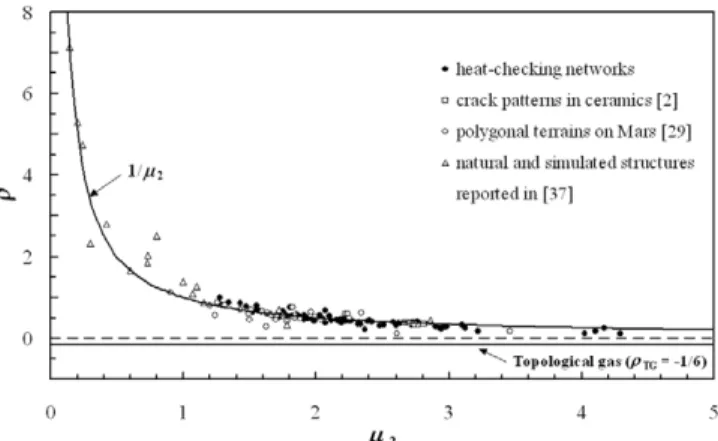
In figure6the variation of ρ (quotient a/µ2)as a function
of µ2(with µ2ranging from 0.14 to 4.3) is plotted, for various
natural structures including our crack networks. As already established by Delannay and Le Ca¨er [40], this figure reveals that ρ decreases quasi-universally according to a curve near 1/µ2, and approaches an asymptotic value equivalent to that
of a TG (ρTG = −1/6) for cellular structures with a high
disorder µ2.
Figure 6. Variation of ρ(= a/µ2)versus µ2for the heat-checking networks investigated in this work and other cellular structures reported in the literature.
4.2. Effect of the number of TF cycles
For most TF tests the topological properties of the heat-checking patterns were investigated in the early stages of cracking (for the first 500 or 1000 cycles, as indicated in table1). Figure7 shows that the frequency distributions of cell sides, P (n), are quasi-normal and centred on 6. However, it should be emphasized that for a low number of cycles (i.e. when the heat-checking density is not fully stabilized or saturated [1]), P (n) is slightly asymmetric and flattened, with a smaller proportion of 6-sided cells (figure7(a)) compared with larger numbers of cycles (figures7(b) and (c)). Whatever the number of cycles N, P (6) is always higher than P (5), and P (5) higher than P (7), as also reported for crack patterns formed in quenched ceramics [2] and basaltic lava flows [5], or for polygonal networks on Mars [32]. In addition, one can observe that the number of cells with 9 or more sides decreases or disappears with increasing N (figures7(a)–(c)).
With rare exceptions, the variance µ2 is less than 3
(table2). According to Stavans and Glazier [8,28,42], such value means that the spatial disorder is ‘long-lived in time’ and characteristic of a non-asymptotic behaviour. This statement is confirmed by figure8, plotting the evolution of µ2 versus
number of cycles N, which shows a decreasing trend and tends to a minimal value (µ2 < 2) when N increases, regardless
of Tmax. This figure suggests that the heat-checking pattern
evolves towards a more ordered geometry in the stabilized regime, without however achieving a markedly asymptotic behaviour. In soap froths, a somewhat different evolution was reported for µ2 versus time [42]: the initially ordered
cellular structure, composed mostly of hexagonal bubbles (with µ2 <0.5), widens to a maximum (µ2 = 2.65) before
narrowing to a steady intermediate value (µ2 = 1.5 ± 0.2)
at longer times. In their experiments, Stavans and Glazier observed the evolution of the soap bubbles in situ, while our TF tests must be periodically interrupted to check the crack initiation. Therefore, we are not sure that the very early stages of fragmentation were observed, and a behaviour similar to soap froths cannot be completely excluded.
Both Aboav–Weaire’s and Lewis’ laws are satisfied throughout the whole TF cycling, as shown for test 5 in
Figure 7. Frequency distributions P (n) of the number of cell sides at increasing number of cycles N (test 5): (a) N = 1000 cycles;
(b) N = 5000 cycles; (c) N = 20 000 cycles; (d) evolution of P (n) versus N, for n = 5 to 7. (⟨n⟩ is the average number of sides of the cells, and µ2is the variance of P (n)).
Figure 8. Evolution of the variance of µ2versus number of cycles, indicating a decreasing topological disorder in the heat-checking pattern.
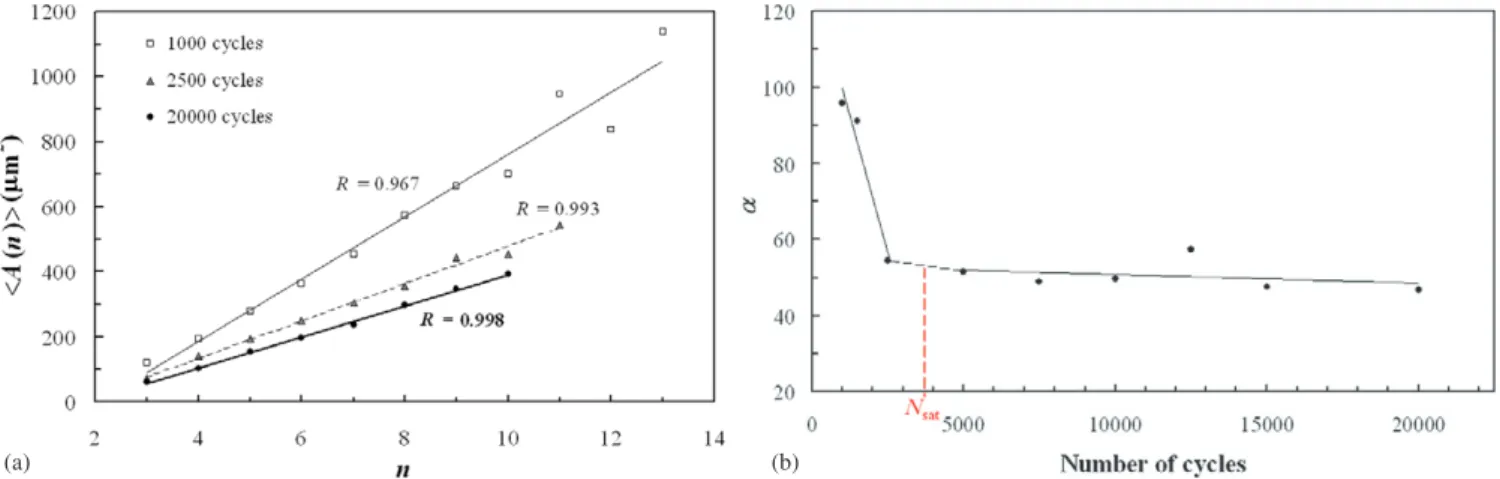
figures9and10(a), respectively. It should be emphasized that the coefficient of determination of both laws slightly increases with N. A higher deviation from the linear regression is, however, observed for many-sided cells (with n > 9), that can be explained by a lower number of data for this population. This is particularly true for Lewis’ law at low number of cycles, since the heat-checking cells have not yet completely reached their stabilized size [1]. Figure10(b), showing the evolution of the slope of Lewis’ law (α) as a function of the number of cycles N, indicates that α decreases to an asymptotic minimal value. It was previously shown [1,38] that the heat-checking density (which is inversely proportional to the mean cell size expressed here by α) follows a sigmoidal trend versus N, whatever the thermal cycling conditions. After an incubation period during which no crack is observed (since the oxide
Figure 9. Applicability of the Aboav-Weaire’s law (linear relation
relating the average number of sides of cells surrounding a n-sided cell, m(n), to (n), for test 5. The data are the mean values of n· m(n) calculated between the first (1000 cycles) and last (20 000 cycles) interruption of the test, and the error bars represent their minimum and maximum values.
layer is too thin and has not achieved a critical thickness to rupture), the crack network initiates and stabilizes rapidly to a saturated density. Figure 10(b), which shows a bi-linear dependence of α on N, reflects the same phenomenon. Thus, αdecreases strongly at the beginning of the cracking process (as shown by the first highly sloped linear portion of the curve), indicating that the heat-checking cells undergo rapidly a strong shrinking after successive cell divisions. Then, beyond a critical number of cycles (Nsat)which may change depending
on the test conditions [38], α remains quasi-constant when N increases (corresponding to the second linear part with a near-zero slope), meaning that the cells have reached their stabilized (or saturated) size.
(a) (b)
Figure 10. Applicability of Lewis’ law (test 5): (a) linear relation relating the average area ⟨A(n)⟩ of the cells to n, at different numbers of
cycles; (b) evolution of the slope α versus number of cycles.
(a) (b)
Figure 11. Application of the ‘modified’ Von Neumann’s law (9) to the heat-checking networks produced with test 5: (a) evolution of the
rate of change of the average area of the cells, d⟨A(n)⟩/dN, versus their topological class n, for various cycle intervals (the slope of the curve, k, expresses the shrinkage rate of the cells); (b) evolution of k versus number of cycles.
Thus, the heat-checking networks are non-equilibrium systems, whose topological and metric properties evolve with time. In figure11(a), the rate of change of the average area of the cells, d⟨A(n)⟩/dN, is plotted versus their topological class n, for different intervals of cycling (test 5). By excluding the cells with n > 9 (which are very few in the heat-checking network), a linear evolution is observed as a function of n, for each interval between two successive cycling stops:
d⟨A(n)⟩/dN = k(N) · n + b, (9) where k(N) is called the ‘rate constant’, which depends on the TF cycling interval and indicates either a growth (k > 0) or a shrinkage (k < 0) of the cells, and b is a constant.
This expression can be considered as a ‘modified’ Von Neumann’s law, by substituting the time t by the number of cycles N in (5) (it must be recalled that N is proportional to t for a given thermal cycle). At the beginning of the test (i.e. for low number of cycles, up to 2500 cycles in the case of test 5), a negative rate constant is observed (k < −2.10−2µm2/cycle), meaning that the heat-checking
cells shrink (due to their fragmentation). This behaviour is analogous to that of biological tissues (such as epidermis), where successive divisions occur under a microscopic process
called ‘mitosis’ [22]. It can be also noted that the linear regression curve predicts negative values of d⟨A(n)⟩/dN even for values of n higher than 6, in contradiction with Von Neumann’s law (which states a linear dependence of d⟨A(n)⟩/dt with (n − 6)). This is also in contradiction with experimental observations reported for bubbles in soap froths [28] and grains in polycrystalline aggregates [34,35], which may shrink or expand in agreement with Von Neumann’s law. However, even if the sign of d⟨A(n)⟩/dN does not change according to the topological class of the cells, many-sided cells have a higher ‘shrinkage rate’ than few-many-sided cells (figure 11(a)). In addition, the cells with n > 10 tend to disappear during the fragmentation process, as previously shown in the frequency distributions P (n) (figure 7(d)). Figure11(b) indicates that the rate constant k, which expresses the rate constant of the cell size variation (slope of equation (8)), varies according to the number of cycles N. It may be noted that this curve follows the opposite trend to that of α versus N (figure 10(b)). As explained above, the heat-checking cells globally shrink at the beginning of the fragmentation process, whatever their number of neighbours. Figure11(b) better shows that the rate of shrinkage k decreases rapidly between the beginning of the fragmentation process and the number of cycles to saturation Nsat(as k varies from
(a) (b)
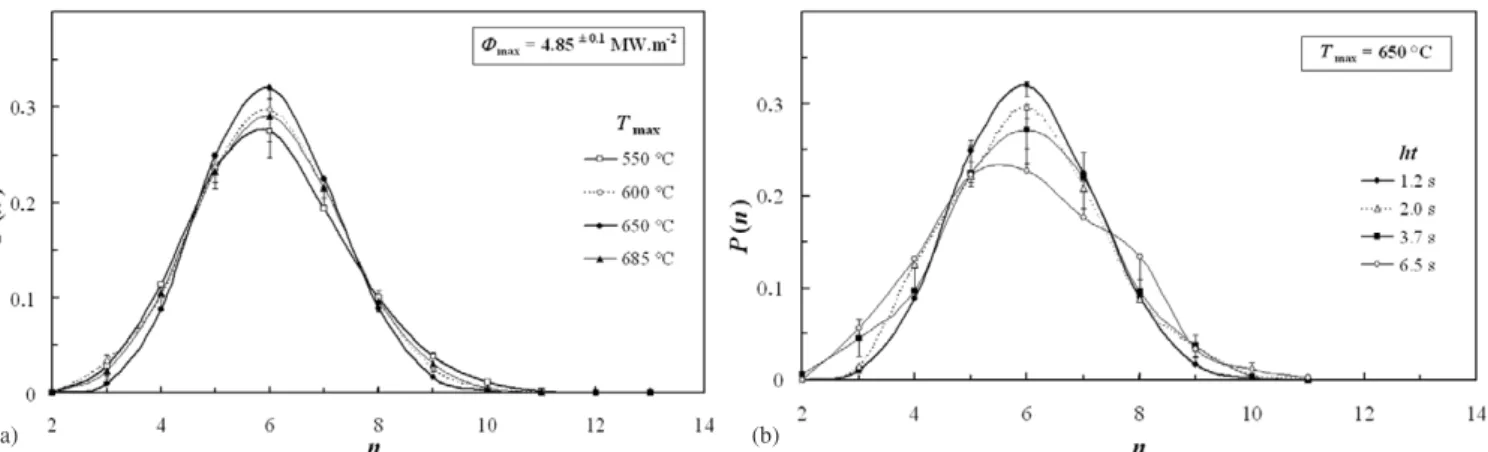
Figure 12. Frequency distributions of the number of cell sidesP (n) in the stabilized regime, for various maximum temperatures Tmax (a) and heating periods ht of the thermal cycle (b).
–0.041 to –0.0009 µm2/cycle). When the saturated regime is
achieved (i.e. before 5000 cycles), k stabilizes to a constant value near zero, indicating that the cell size no longer evolves under further cycles. Thus, this curve reflects the fact that the fragmentation process is time dependent. Even if the stabilization of the crack network is rapidly achieved, this is not an instantaneous phenomenon since it takes a few thousand cycles before the cells reach their saturated size. This time dependence of k (which is equivalent to γ in original Von Neumann’s law) was not observed in soap froths, where γ remains constant with time [28].
4.3. Effect of TF test conditions
Focusing on the saturated heat-checking networks (when the crack density is stabilized at a high number of cycles), the effects of TF test conditions (maximal temperature Tmaxand
heating period ht of the thermal cycle) on the topological properties are investigated. Whatever Tmax, a Gaussian
probability distribution of the number of cell sides P (n) is obtained, with a slightly more flattened shape when Tmax <
600◦C (figure 12(a)). In addition, figure12(b) shows that
the kurtosis of the distribution is lower when the heating rate hr decreases (i.e. ht increases), leading to a positively skewed distribution for the slowest thermal cycle (ht = 6.5 s). The average number of cell sides does not drastically change with neither Tmax (⟨n⟩ = 6.01 ± 0.2), nor ht (⟨n⟩ = 5.99+0.03−0.05).
However, it seems that a relationship exists between ⟨n⟩ and the maximum heat-flux density ($max)applied to the specimen
during the heating period of the TF test (figure13). It must be recalled that $maxdepends on the test conditions and especially
on the heating rate, as indicated in table1 (2.13 < $max <
4.95 MW m−2when 85 < hr < 458◦C s−1for the 100–650◦C
thermal cycle). In figure 13, data points are best-fitted by a power law (with R = 0.82):
⟨n⟩ = 5.915$0.0107max . (10)
This relationship can be related to the tendency of ⟨n⟩ to increase with the cell density dc, as previously shown in
figure 3. Indeed, the thermal cycles performed with a low $max produce heat-checking networks with fewer cells than
those performed with a high $max, and vice versa (table2).
Figure 13. Effect of the maximum heat-flux density $maxon the average number of cell sides ⟨n⟩, for the saturated heat-checking networks.
No very significant effect of the steel hardness and the TF test conditions is observed on Aboav–Weaire’s correlation, although the system-constant a appears to be lower when the test is performed at low Tmax(<600◦C) or at high ht (table3).
The topological disorder µ2exhibits greater variations. More
disordered cellular networks (with µ2>2) are obtained at low
Tmax, while the most ordered organization seems to be reached
at 650◦C (figure 14(a)). On the other hand, figure 14(b)
indicates that µ2 increases by increasing ht, meaning that
low heating rates tend to produce a greater deviation from geometric equilibrium, compared with fastest cycles.
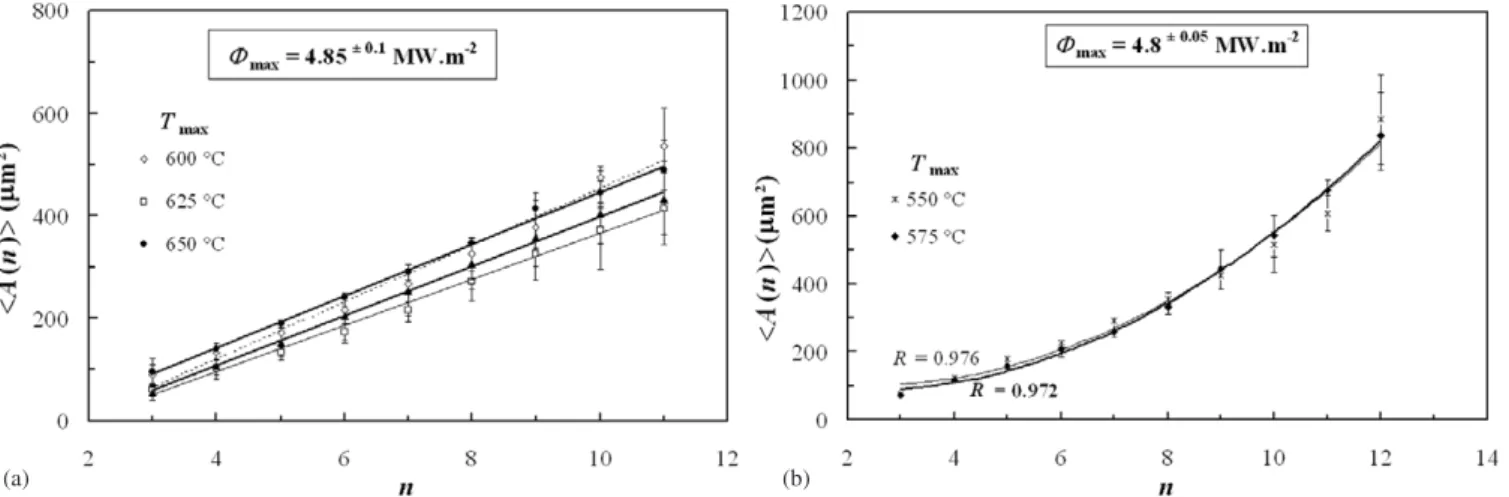
Figure15(a) shows the effect of Tmax on Lewis’ linear
correlation, whose slope α does not vary much in the saturated regime. However, it can be noted that when Tmax <600◦C
(tests 1 and 2), the dependence of ⟨A(n)⟩ upon n seems rather quadratic than linear (figure 15(b)), thus improving the average correlation coefficient from 0.91 to 0.97. The failure of Lewis’ law under these conditions would suggest that additional constraints to inescapable mathematical space-filling requirements are involved in shaping the heat-checking network [20–22]. In addition, figure 16 indicates that the slope of the linear regression, α, is drastically increased by increasing ht (i.e. decreasing the mean heating rate hr). The scattering from the linear regression is also larger by increasing ht, because the number of cells becomes lower (especially
(a) (b)
Figure 14. Effect of the maximal temperature Tmax(a) and of the heating period ht of the thermal cycle (b) on the variance µ2in the stabilized regime (µ2is an indicator of the topological disorder in the cellular network).
(a) (b)
Figure 15. Effect of Tmaxon the applicability of Lewis’ law in the stabilized regime: (a) classical linear variation of ⟨A(n)⟩ versus n, for Tmax! 600◦C; (b) quadratic variation of ⟨A(n)⟩ versus n, for Tmax<600◦C.
Figure 16. Effect of the heating period ht of the thermal cycle on
Lewis’ law in the stabilized regime (note that the slope α increases with increasing ht).
when ht " 3.7 s). In fact, figure17reveals that α, which is linked to the average cell area, decreases with $maxfollowing
a power law:
α= 2414$−2.362max . (11) This curve, which fits our experimental points with a remarkably high coefficient of determination (R = 0.95),
Figure 17. Effect of the maximum heat-flux density $maxon the slope of the Lewis’ law α, for the saturated heat-checking networks.
clearly shows that α reaches an asymptotic minimum when $max is greater than 4 MW m−2. It means that beyond this
value, the saturated heat-checking cells would have achieved their minimum size, and could not be more fragmented. A previous study [38] revealed that the saturated crack density ρsatis dependent on the input energy (applied at the specimen
surface during the heating period of the thermal cycle), which is itself linked to the maximum heat-flux density $max. Thus,
Figure 18. ‘Universal’ normalized Lewis’ law (⟨A(n)⟩/⟨A⟩ versus
n) applied to all the heat-checking networks produced with various test conditions (maximum temperature Tmaxand heating period ht).
ρsatincreases by increasing $max, and beyond a critical limit
of the transmitted energy per unit-area, ρsat remains
quasi-unchanged. Therefore, the stabilized size of the cells may vary in a wide range depending on the test conditions (and especially the heating rate of the thermal cycle). The higher the $max(and therefore the energy received by the specimen
surface, i.e. the oxide layer), the smaller the resulting cell size. With our test facility, the maximum heat-flux density that can be achieved (by adjusting the power of the generator to 100%) does not exceed 5 MW m−2, leading to heat-checking
networks with a minimum cell size of about 15–20 µm [38]. Once the heat-checking network is initiated and stabilized, increasing the number of thermal cycles leads to propagation of the micro-cracks of the oxide layer in the steel substrate. Under such conditions, the thermally induced mechanical energy is dissipated by the crack propagation inwards of the steel, rather than by subdividing the heat-checking cells [39]. The interaction between the thermal stresses and oxidation ahead of the crack tip modifies the oxidation diffusion paths. In fact, due to in-depth crack propagation, localized pit oxidation occurs preferentially to the formation of oxide on the surface of the specimen. Therefore, fewer driving forces are available to subdivide the existing cells.
By plotting the normalized area of the cells, ⟨A(n)⟩/⟨A⟩, versus their topological class n (normalized Lewis’ law) for all test conditions (figure18), all data points tend to cluster on a single curve, namely the linear law:
⟨A(n)⟩/⟨A⟩ = 0.267n − 0.574. (12) Despite a higher scattering for the many-sided cells (n > 8), a quite good coefficient of determination is obtained (R = 0.88). This result indicates that irrespective of the TF test conditions, the heat-checking networks are similar apart from a size scaling factor, suggesting that the same rules govern the shaping of the cellular structure in the stabilized state. However, as previously shown, the cell organization could be affected, under some test conditions, by additional forces to the inescapable space-filling constraints. Actually, during our TF experiment, the maximum heat-flux density imposed on the specimen generates thermo-mechanical loading by self-constraining [38]. This
thermo-physical constraint contributes to the shaping of the heat-checking network, under certain conditions (low Tmax and
low hr).
The steel grade investigated in this study is commonly used as a tool material in hot-forming processes, such as die-casting or forging. In service, the tools suffer from thermal and mechanical solicitations, which can be reproduced at a lower scale by our TF test [1,38]. In the run of industrial application, this work shows that by changing the test parameters (in particular the heat-flux density by modifying the heating rate of the thermal cycle), heat-checking networks with various cell sizes can be generated. It is well known that the TF life is considerably reduced when the superficial heat-checking network is denser, because these micro-cracks contribute to weakening the steel by accelerating the oxidation mechanisms and the initiation of macro-cracks that propagate through the tool material as a result of accumulated thermo-mechanical solicitations [39]. Therefore, better controlling the heat exchanges between the tool and the processed parts could be an interesting way to improve the life of hot-working tools in service [38].
5. Conclusions
This paper presents an experimental investigation on the topological properties of microscopic heat-checking patterns formed under thermal fatigue on the oxidized surface of a X38CrMoV5 steel specimen. 300 and 6000 cells were analysed in each polygonal crack network, leading to statistically relevant results. An average number of sides per cell very close to the ideal value expressed by Euler’s theorem is found (⟨n⟩ = 6.0+0.03
−0.09), indicating that the cellular networks
are pseudo-hexagonal. The applicability of general topological laws (such as Aboav–Weaire’s and Lewis’) is verified, meaning that geometric correlations do not extend beyond adjacent cells in the polygonal network, and that the shaping of the network is governed by space-filling constraints [8]. The topological properties of the microscopic heat-checking networks are broadly consistent with those reported in the literature for crack patterns in thermal shocked ceramics or for polygonal terrains on Mars, which suggests that these random cellular systems are governed by the same rules despite their very different scale. The universality of Lemaˆıtre’s law is confirmed, and its domain of validity extended to highly disordered structures.
It is shown that the heat-checking networks are non-equilibrium systems, as their topological and geometrical properties change with the number of cycles. The topological disorder, estimated by the variance of P (n), is rather high (µ2 = 2.22+2.08−0.95). It decreases when increasing the number
of cycles, and evolves towards a geometric equilibrium with µ2 < 2. A greater disorder is achieved for lower maximal
temperatures (Tmax < 600◦C) and lower heating rates. It is
shown that the heat-checking cells undergo a strong shrinkage at the beginning of the thermal cycling. A modified version of Von Neumann’s law is established, relating the rate of change of the average area of the cells to their topological class.
Whatever the number of cycles and the TF test conditions, the linear Aboav–Weaire’s law is satisfied with a correlation
coefficient always greater than 0.97. The system-constant is near 1 on average (a = 0.96 ± 0.52). The Lewis’ law, which states a linear relationship between the average area of the cells and their number of sides, is generally obeyed with a slope (32 < α < 559) mainly depending on the thermal cycling conditions (and especially the heating rate). However, better correlation coefficients are achieved when the heat-checking pattern is stabilized (for a high number of cycles), and at higher maximum temperatures (Tmax > 600◦C). Below this
Tmax, the best-fit correlation is quadratic rather than linear,
suggesting that physical forces (related to the maximum heat-flux density applied to the specimen surface) are involved in the fragmentation process. Neither the intercept (n0= 2.06+2.05−1.58)
nor the ‘ageing’ parameter (λ = 0.27+0.35
−0.11)of Lewis’ law
appears related to the test conditions. It is shown that for stabilized cracks networks, the maximum heat-flux density ($max) influences both the average number of sides (⟨n⟩)
and the average size of the heat-checking cells (i.e. the slope α of Lewis’ law). Whatever the test conditions, a unique normalized Lewis’ law is found, indicating that the stabilized cellular networks are indistinguishable apart from a scale factor (the average cell size).
Acknowledgments
The authors wish to thank Professor C Levaillant, former head of the research centre ‘ICA-Albi’, for the fruitful discussions and encouragement to undertake this investigation. Dr F Medjedoub is thanked for his contribution to thermal fatigue experimentations.
References
[1] Le Roux S, Medjedoub F, Dour G and R´eza¨ı-Aria F 2013 Micron44 347–58
[2] Korneta W, Mendiratta S K and Monteiro J 1998 Phys. Rev. E 57 3142–52
[3] Korneta W 2001 Phil. Mag. Lett.81 367–73
[4] Bohn S, Douady S and Couder Y 2005 Phys. Rev. Lett. 94 054503
[5] Jagla E A and Rojo A G 2002 Phys. Rev. E65 026203 [6] Shorlin K A, de Bruyn J R, Graham M and Morris S W 2000
Phys. Rev.E61 6950–7
[7] Pasricha K, Wad U, Pasricha R and Ogale S 2009 Physica A
288 1352–8
[8] Weaire D and Rivier N 1984 Contemp. Phys.25 59–99 [9] Lantu´ejoul C 1978 Prakt. Metallogr. 8 40–50
[10] Bandeira L, Pina P and Saraiva J 2008 Lect. Notes Comput. Sci.5197 398–405
[11] Bandeira L, Pina P and Saraiva J 2010 Pattern Recognit. Lett. 31 1175–83
[12] Bohn S, Pauchard L and Couder Y 2005 Phys. Rev. E
71 46214
[13] Aboav D A 1970 Metallography3 383–90 Aboav D A 1980 Metallography 13 43–58 [14] Weaire D 1974 Metallography7 157
[15] Peshkin M A, Stransburg K J and Rivier N 1991 Phys. Rev. Lett.67 1803–6
[16] Fortes M A and Pina P 1993 Phil. Mag. B67 263–76
[17] Dubertret B, Rivier N and Peshkin M A 1998 J. Phys. A: Math. Gen.31 879–900
[18] Lewis F T 1928 Anat. Rec.38 341–76 Lewis F T 1931 Anat. Rec. 50 235–65
[19] Rivier N and Lissowski A 1982 J. Phys. A: Math. Gen. 15 L143–8
[20] Rivier N 1983 Phil. Mag. B 472 L45–9 Rivier N 1985 Phil. Mag. B 52 795–819 [21] Rivier N 1986 Physica D23 129–37
[22] Rivier N, Schliecker G and Dubertret B 1995 Acta Biotheor 43 403–23
[23] Von Neumann J 1952 Discussion—shape of metal grains Metal Interfacesed C Herring (Cleveland, OH: American Society for Metals) pp 108–10
[24] Chiu S N 1995 Mater. Charact.34 149–65
[25] Mombach J C M, Vasconcellos M A Z and de Almeida R M C 1990 J. Phys. D: Appl. Phys.23 600
[26] Pina P and Fortes M A 1996 J. Phys. D: Appl. Phys.29 2507 [27] Jeune B and Barabe D 1998 Ann. Bot.82 577–86
[28] Glazier J A, Gross S P and Stavans J 1987 Phys. Rev. A 36 306–12
[29] Cerisier P, Rahal S and Rivier N 1996 Phys. Rev. E54 5086–94 [30] Earnshaw J C and Robinson D J 1994 Phys. Rev. Lett.72 3682 [31] Noever D A 1994 Astron. Astrophys. 282 252–61
[32] Saraiva J, Pina P, Bandeira L and Antunes J 2009 Phil. Mag. Lett.89 185–93
[33] Fortes M A and Teixeira P I C 2003 J. Phys. A: Math. Gen. 36 5161
[34] Fradkov V E, Kravchenko A S and Shvindlerman L S 1985 Scr. Metall.19 1291–6
[35] Fradkov V E, Shvindlerman L S and Udler D G 1987 Phil. Mag. Lett.55 289–94
[36] Ciupinski L, Kurzydlowski K J and Ralph B 1998 Mater. Charact.40 215–9
[37] Desch C H 1919 J. Inst. Met. 22 241
[38] Le Roux S, Medjedoub F, Dour G and R´eza¨ı-Aria F 2013 Int. J. Fatigue51 15–25
[39] Medjedoub F 2004 D´etermination des param`etres influant sur le ph´enom`ene d’endommagement par fatigue thermique des moules en fonderie sous pression d’aluminium PhD Thesis Ecole des Mines de Paris
[40] Delannay R and Le Ca¨er G 1994 Phys. Rev. Lett.73 1553–6 [41] Zsoldos I and Szasz A 1999 Comput. Mater. Sci.15 441–8 [42] Stavans J and Glazier J A 1989 Phys. Rev. Lett.62 1318 [43] Lemaˆıtre J, Troadec J P, Gervois A and Bideau D 1991
Europhys. Lett.14 77–83
[44] Lemaˆıtre J, Gervois A, Troadec J P, Rivier N, Ammi M, Oger L and Bideau D 1993 Phil. Mag. B67 347–63 [45] Le Ca¨er G and Delannay R 1993 J. Phys. A: Math. Gen.
26 3931
[46] Rivier N 1994 Maximum entropy for random cellular structures From Statistical Mechanics to Statistical Inference and Backed P Grassberger and J P Nadal (Dordrecht: Kluwer) pp 77–93
[47] Rivier N 1999 Statistical thermodynamics of foam Foams and Emulsionsed J F Sadoc and N Rivier (Dordrecht: Kluwer) pp 105–25
[48] Fradkov V E 1988 Phil. Mag. Lett. 58 271–5
[49] Vincze G, Zsoldos I and Szasz A 2004 Comput. Mater. Sci.
![Figure 2. Procedure to determine the number of first neighbours (n) of the heat-checking cells [9]: (a) selection of a cell in the measuring mask; (b) dilatation of size 2 of the selected cell; (c) reconstruction of the cell and its neighbourhood; (d) subt](https://thumb-eu.123doks.com/thumbv2/123doknet/11602819.299671/5.892.170.727.292.663/procedure-determine-neighbours-selection-measuring-dilatation-reconstruction-neighbourhood.webp)