HAL Id: hal-00958128
https://hal-mines-paristech.archives-ouvertes.fr/hal-00958128
Submitted on 4 Sep 2015HAL is a multi-disciplinary open access archive for the deposit and dissemination of sci-entific research documents, whether they are pub-lished or not. The documents may come from teaching and research institutions in France or abroad, or from public or private research centers.
L’archive ouverte pluridisciplinaire HAL, est destinée au dépôt et à la diffusion de documents scientifiques de niveau recherche, publiés ou non, émanant des établissements d’enseignement et de recherche français ou étrangers, des laboratoires publics ou privés.
Kinetics of lime/bentonite pozzolanic reactions at 20
and 50 °C: Batch tests and modeling
Laurent de Windt, Dimitri Deneele, Nicolas Maubec
To cite this version:
Laurent de Windt, Dimitri Deneele, Nicolas Maubec. Kinetics of lime/bentonite pozzolanic reactions at 20 and 50 °C: Batch tests and modeling. Cement and Concrete Research, Elsevier, 2014, 59, pp.34-42. �10.1016/j.cemconres.2014.01.024�. �hal-00958128�
Kinetics of lime/bentonite pozzolanic reactions at 20 and 50°C:
batch tests and modeling
Laurent De Windt
(1), Dimitri Deneele
(2,3), Nicolas Maubec
(2)(1) Mines-ParisTech (Ecole des Mines de Paris), Centre de Géosciences, 35 Rue St-Honoré, 77305 Fontainebleau Cedex (France)
(2) LUNAM, IFSTTAR, Institut Français des Sciences et des Technologies des Transports, de l’Aménagement et des Réseaux, BP 4129, route de Bouaye, 44332 Bouguenais (France)
(3) Institut des Matériaux Jean Rouxel (IMN), Université de Nantes, CNRS, 2 rue de la Houssinière, BP 32229, 44322 Nantes Cedex 3, (France)
* Corresponding author, Email = laurent.dewindt@mines-paristech.fr ; Tel = +33-1-64.69.49.42 ; Fax = +33-1-64.69.47.13
Abstract.
The effects of duration (1–100 days) and temperature (20 and 50°C) were assessed from batch tests for Ca-bentonite mixed with 10 wt.% lime. The pozzolanic processes were monitored over time by 29Si NMR (Cement Concr. Res. 42, 2012), TGA-DTA, XRD and chemical analysis. Modeling considered kinetics and thermodynamics of mineralogical transformations and cation exchange. Kinetic laws were dependent on pH and temperature (Arrhenius energy).
Lime hydration occurs within hours, modifying the bentonite exchangeable population and increasing the pH. These alkaline conditions initiate the pozzolanic reactions in a second stage. The rate-limiting step is the dissolution kinetics of the bentonite minerals, i.e. a relatively fast and total consumption of cristobalite in parallel to a long-term slower dissolution of montmorillonite. First C–S–H and then C–A–S–H are formed consequently. Temperature speeds up the pozzolanic reaction kinetics by a factor 5 from 20 to 50°C, corresponding to an apparent activation energy of 40–50 kJ/mol.
Keywords: calcium silicate hydrate, kinetics, pozzolan, temperature, thermodynamic
1. Introduction
Sustainable development in earthworks for railway and road constructions is marked by an increasing need of re-using the natural materials directly encountered in the environment, though their macroscopic behavior can be poor. In this context, lime stabilization is known to reduce the swelling of expansive soils, to improve their mechanical properties (load‐bearing capacity, compressive strength), and to develop their long‐term durability [1–4]. The underlying mechanisms are globally well-known for a long time [1,5,6], though still complex and not yet well understood in detail. They are based on a set of successive physico-chemical reactions: cation exchange, then flocculation, and eventually pozzolanic reactions. However, their kinetics and the specific effect of clay minerals are important factors that still require for specific investigations. The quantification of the kinetics of lime/clay interactions is, therefore, a key step to optimize soil stabilization but also to estimate their durability on the long term. To the authors’ knowledge, there are only a few studies on the kinetics of lime/clay pozzolanic reaction in the literature [4,7,8]. None of them considers modeling.
Geochemical modeling has several interesting features with this respect, and the relatively recent compilation of formation constants of cement phases over the last decade [9], allows for a fine description of pozzolanic reactivity at different temperatures. Modeling allows to couple different reaction processes: hydrolysis of oxides of lime and cement phases, cation exchange, dissolution of the constituent minerals of the soil, while respecting the mass fraction of each solid phases (e.g. a 5 wt.% lime addition to a soil composed of 35 wt.% smectite). Specific dissolution kinetics may be then allocated to each of these solid phases, facilitating a deconvolution of each process.
The effects of duration (1–100 days) and temperature (20 and 50°C) were assessed from batch tests for a natural Ca-bentonite (constituted of montmorillonite, 80 wt.%, calcite, cristobalite and K-Feldspar) mixed with lime at a content of 10 wt.%. The pozzolanic process was monitored over time by 29Si solid state nuclear magnetic resonance in a
previous study [10]. Additional thermogravimetric analysis, X-ray diffraction, and chemical analysis of the batch solutions are discussed in this paper. Modeling was performed with the geochemical code CHESS [11] considering the thermodynamics and kinetics of mineralogical transformations, cation exchange of clays, and aqueous chemistry. The kinetic rate law was dependent on both pH and temperature (activation
Arrhenius energy). Most of the kinetic parameters were selected from the literature, especially on aluminosilicate dissolution, and validated with the present set of experimental data.
2. Materials and batch tests
2.1 Bentonite and lime samples
The bentonite was provided by the company IBECO under the name AGROMONT. The major solid phase was a calcic montmorillonite with some accessory minerals: a potassium and sodium mixed feldspars (KAlSi3O8–NaAlSi3O8), cristobalite/opal (SiO2)
and calcite (CaCO3). The phase proportions estimated by 29Si NMR, X-ray diffraction
and bulk analysis were about 80 wt.% montmorillonite, 10 wt.% feldspars and 5 wt.% cristobalite. The intensities of the assigned 29Si NMR signals were normalized to the total amount of Si of the Ca-Bentonite assuming the mineral formulae of reference given in Sec. 3.1. The estimated amount of calcite was determined by calcimetry (2 wt.% approximately). The predominance of smectite involved a high cation exchange capacity (CEC), 56 meq/100 g. The cationic exchangeable population was dominated by calcium (70% in equivalent) and magnesium (20%) with the remainder being predominantly occupied by potassium and sodium.
The lime powder was provided by the LHOIST company. It was mainly composed of CaO (94 wt.%) and MgO (2 wt.%), with some trace amounts of K-NaO and calcite. The lime and bentonite proportions of the treated material were 10 and 90 wt.%, respectively.
2.2 Experimental set-up
Batch type experiments consisted in suspending 10 g of a mixture of lime and bentonite in 100 mL of ultrapure water (L/S = 10) in bottles of 125 mL (borosilicate glass sealed to avoid carbonation of lime). The granulometric fraction below 315 µm was used in the batch tests. The whole suspension was stirred using a magnetic stirrer throughout the batch test. The suspensions were maintained at 20 ± 2°C for periods ranging from 1 to 98 days. A second series of experiments was achieved by maintaining the suspension at 50 ± 2°C in an oven. The objective was to work at elevated temperature to accelerate the rate of reaction between the lime and clay materials. In the case of this series, measuring the pH of each term suspensions was also performed at 50°C.
2.3 Batch solution and solid analyses
At the end of each run, the pH of the suspensions was measured using a pH electrode specific to alkaline solutions. The solid phase was separated from the liquid phase by centrifugation and then lyophilized for 24 hours at -58°C and 0.03 mbar. Once dried, the solid was stored in a vacuum desiccator until their characterization. The liquid phase was, meanwhile, recovered and filtered to 0.45 microns, and analyzed by plasma emission spectroscopy (ICP-AES).
Mineralogical composition of the initial and final materials was identified by powder X-ray diffraction (XRD), performed on a Bruker AXS D8 Advance with Cu-Kα radiation. The analyses were carried out on randomly oriented powder samples. Additional analyses (limited to the 4-30°2θ range) were performed on oriented samples of the clay fraction (< 2 µm), separated by sedimentation and then deposited on glass slide and dried in a desiccator. Thermogravimetry analysis (TGA) and differential scanning calorimetry (DSC) were carried out with Setaram TG-DSC 111 apparatus from 25°C to 830°C with 5°C/min. Analyses were performed under argon atmosphere to avoid sample carbonation. Solid-state nuclear magnetic resonance (NMR) analyses of 27Al and 29Si were carried out on a Bruker Avance 500 MHz spectrometer (see [10] for all the details).
3. Modeling approach and parameters
3.1. Thermodynamic equilibrium and database
The geochemical code CHESS/HYTEC [11] takes into account all the chemical reactions in aqueous solution. In the present case, the relevant reactions are mainly acid/base reactions and ion complexation in solution, dissolution and precipitation of solid phases, cation exchange and surface complexation. The thermodynamic equilibrium is dependent on a set of mass balance equations, characterized by formation constants Ki depending on
temperature:
nAA + nBB ↔ nCC + nDD ; Ki T =
C nC D nD
A nA B nB (1)
The equilibrium state is numerically solved according to the basis component approach and an improved Newton-Raphson scheme. The empirical formula of the truncated
Davies model derived from the Debye-Huckel model of activity corrections of dissolved ions was used for this study. The model is applicable for low to moderately mineralized solutions (i.e. ionic strength ≤ 0.5 mol/kg).
Table 1 provides for the set of primary and secondary phases considered in the modeling. The primary phases correspond to the initial mineralogy of the bentonite and lime. The secondary phases were either explicitly identified by the analysis of the postmortem samples or possibly present according to the literature on cement/clay interactions [e.g. 12].
The thermodynamic database was built according to the recent literature on the phases present in cementitious stabilized soils, mainly from the database THERMODDEM [13,14; thermoddem.brgm.fr]. This comprehensive international database was consistent with this issue. In particular the thermodynamic equilibrium constants of cement and clay phases are defined in the temperature range 0–100°C. The stoichiometry and formation constants of the solid phases are given in Table 2. The values of the thermodynamic constants (logK) at 20 and 50°C (the experimental conditions) were interpolated from values given at 0, 25, 60 and 100°C in the database. Table 2 details the constants of reference at 25 and 60°C only (i.e. the closest to 20 and 50°C respectively) for the sake of simplicity.
The calcium silicate hydrates (C–S–H) were modeled by three discrete C–S–H phases of increasing Ca/Si ratio, i.e. 0.8, 1.2 and 1.6. These nanocrystalline phases, which are metastable with respect to crystalline C–S–H like tobermorite, were found to be more representative of the amorphous phases generated during pozzolanic reactions. There is presently no thermodynamic data in the literature to model C–A–S–H phases [9,15]. In a first approximation, as a surrogate, the thermodynamic data of strätlingite (Ca2Al2SiO2(OH)10:3H2O) was applied to simulate Al uptake by C–S–H phases.
Strätlingite is frequently found in Al2O3-CaO-SiO2 hydrated cements [15]. The
stoichiometry of the lime was set to Ca0.97Mg0.03O in the model in agreement with the
bulk chemical analysis.
[TABLES 1 & 2]
The Gaines-Thomas formalism (see [16] for further details), based on the concept of equivalent fraction, was used to model cation exchange by montmorillonite, where hydrated cations in the interlayer space of the clay structure can moved freely into solution to be exchanged for other cations. For instance, Na+ substitution by Ca2+ cations present in solution due to lime hydration writes as:
2 Na + Ca2+→ Ca + 2 Na+
(2)
where the upper bar stands for a cation of the interlayer space. The distribution of the cations between the solution and the clay is a given by a relation derived from the law of mass action:
K(Na/Ca) = fCa Na
+ 2
fNa2 Ca2+
(3)
assuming that the activity of the exchangeable cations can be modeled by an equivalent fraction fCa = Ca Ci i = Ca CEC (4)
where the bracket stands for the exchangeable cation concentration, usually given as meq/100g of clay, and CEC (cation exchange capacity) is the sum of all the exchangeable cation concentrations.
Acid–base neutralization reactions at interface between the solution and hydroxyl sites S-OH present at the surface of montmorillonite were also considered in the modeling:
S-OH +OH-→ S-O- + H2O (5)
that can be modeled as a mass action law, considering in addition electrostatic effects through the double layer model (see [16] for further details).
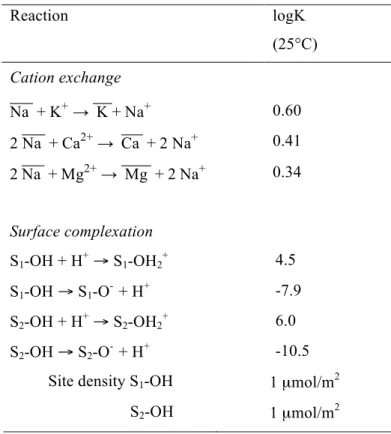
The thermodynamic constants of cation exchange and surface complexation reactions of montmorillonite are given in Table 3. They were selected from a bentonite of a similar mineralogical composition [17]. These thermodynamic equilibrium constants were known at 25°C only. The alkali uptake of C–S–H was not taken into account in the present geochemical model.
[TABLE 3]
The alteration of minerals like clays will partly be controlled by chemical kinetics. The following kinetic formulation is implemented in CHESS:
ri = ki Ai H+ pi Qi
Ki-1-1 (6)
where ki denotes the intrinsic rate constant far from equilibrium [mol/m2/s]. The term Ai
is the mineral surface area [m2/L]. The initial surface area A0 of a given solid phase is
derived from the specific surface of the mineral and its initial concentration C0. The
surface area A evolves as A0 !! !
! !
during the mineral dissolution. The term (H+) stands for the proton activity and pi is a power-constant, mechanistically-based or fitted to
experimental data. A positive power stands for a catalyzing effect of acidic pH (i.e. of protons H+), a negative power stands for a catalyzing effect of alkaline pH (i.e. of hydroxyl ions OH-). The term Qi
Ki-1-1 is the saturation state (Qi stands for the ion activity
product and Ki is the thermodynamic formation constant). If this term is greater than one
(oversaturation state), Eq. 6 corresponds to a precipitation reaction. If this term is smaller than one (undersaturation state), Eq. 6 corresponds to a dissolution reaction.
The accelerating effect of temperature on kinetics is introduced in the form of an Arrhenius law, according to the following equation:
log ki T2 = log ki T1 - EA 2.3R 1 T2 - 1 T1 (7)
where Ea is the activation energy [kJ/mol] and T the temperature [°K].
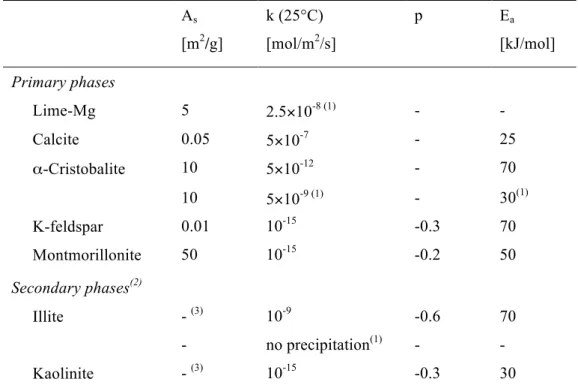
Kinetics of hydration or dissolution has been applied to all primary solid phases (Table 1), for both lime and bentonite, whereas the precipitation and dissolution of the secondary phases were modeled at thermodynamic equilibrium for simplicity. That is to say, the primary phases were assumed to be the limiting steps of the overall kinetics. The neoformation (precipitation) of the clayey phases kaolinite and illite made exception since these phases have a significantly slower kinetics than the other secondary phases. The kinetic parameters are specified in Table 4. The kinetic rate constants, the pH-dependent factor, the specific surface area and the activation energy of the soil minerals were selected from the literature reviews on kinetic rate constants [18,19]. The kinetic data of illite came from the study of Köhler and co-authors [20]. The variation of clay
reactivity with pH (Eq. 6) is a key factor to model the kinetics since the pH decreased by at least one order of magnitude during the experiments. No quantitative data was found for lime hydration. An estimation of the rate constant based on steel slag leaching [21] served as a starting point (k = 10-8 mol/m2/s) and was then slightly adjusted to the present batch experiments (k = 2.5×10⁻⁸ mol/m2/s). The specific surface of the bentonite (48 m2/g) and the lime powder (5 m2/g) was measured by BET analyzes. The specific surfaces of the bentonite minerals were estimated from the global BET value and the data found in the literature for similar natural materials [e.g. 22]: montmorillonite (50 m2/g),
feldspars (0.5 m2/g) and calcite (0.05 m2/g). The specific surface of cristobalite in the
bentonite was unknown but this silica phase can be present as small spongy particles in natural bentonites [23]. Furthermore, cristobalite reacted quickly in the batch tests. For these two reasons, the specific surface was set to 10 m2/g in the modeling.
[TABLE 4]
4. Modeling of the bentonite/lime interactions
The modeling rigorously took into account the temperature and L/S ratio of the batch tests, as well as the proportions of bentonite and lime minerals. The initial exchangeable cationic population of the bentonite was also set in the model.
4.1 Validation of kinetics on the 29Si NMR spectra
NMR is particularly well suited to the characterization of the evolution of cementitious phases (C–S–H, C–A–H) resulting from the pozzolanic reactions. The chemical environments of silicon (29Si) and aluminum (27Al), which are the major elements of clay minerals, are of particular interest for this study. The position of the resonance signal of aluminum is sensitive to the number of atoms coordinated to this element. Silicon is always tetra-coordinated in this study. However, the position of the signal varies depending on the degree of connectivity of silicon tetrahedral:
• Q4: tetrahedron in a three-dimensional structure (e.g. cristobalite in this study);
• Q3: tetrahedron in a two-dimensional structure (e.g. montmorillonite in this
study);
• Q2: tetrahedron within a chain, middle dreierketten sites (e.g. C–S–H high Ca/Si);
Fig. 1-A shows the evolution of mineralogy assessed by NMR spectra of different types of 29Si sites obtained by Pomakhina et al. [10]. These authors conducted a quantitative analysis of NMR spectra to determine the evolution with time of the solid phase contents, in order to estimate the duration of bentonite dissolution and pozzolanic reactions. These time dependence data were compared to the present geochemical model. The modeling profiles of Fig. 1-A were obtained with the kinetic parameters specified in Table 4. For the first batch test carried out at 20°C, a good agreement was obtained with the profiles derived from NMR.
The single calibration of the model concerned the kinetic rate constant of cristobalite dissolution, 5×10-12 mol/m2/s [18,24], which was increased by three orders of magnitude to fit the experimental evolution of the cristobalite content. Experimentally, the cristobalite content become fully depleted after 28 days (Fig. 1-A). The content in C–S–H increases accordingly. The high reactivity of cristobalite presents some clear analogy with the fast reactivity of siliceous fly ash and nanosilica during the hydration of blended cements [25,26]. However, the adjustment of the intrinsic rate constant has not been fully understood yet. It is possible that the cristobalite present in the bentonite was neither well-crystallized nor pure, that is to say mixed with amorphous opal as commonly found in bentonites [23,27]. The present XRD analysis confirmed the presence of both opal and cristobalite, as mentioned by Pomakhina an co-authors [10]. Amorphous glassy materials generally present a faster kinetics of dissolution than well-crystalized polymorphs. Both in the experimental and modeling results (Fig. 1-A), there is a constant dissolution of montmorillonite over the full duration of the experiment. The content in C–A–S–H increases accordingly. There was no evidence of distinct occurrences of H and C-S-A-H. Instead, there was a clear indication that aluminum was incorporated in the C-S-H structure from two weeks approximately. The potassic feldspar does not dissolve in the modeling, whereas a slight dissolution was noticed by NMR analysis. Modeling gives some complementary insights in the evolution of mineralogy (Fig. 1-B). The amount of calcite remains constant, whereas secondary Mg-phases growth with time (brucite in a first stage, then hydrotalcite). These processes are analyzed into detail in the next sections for the reference case studied by Pomakhina et al. [10], i.e. a lime content of 10 wt.% and a temperature of 20°C.
4.2 Short-term evolution (≤ 1 day)
Once the model has been compared to the global evolution of the system based on the NMR data, the early or short-term evolution of the geochemical system during the first moments of the experiment can be studied even in the absence of experimental data. There is a series of processes in a rather sequential scheme during the first few hours or days of the system evolution:
1. fast hydration of lime, leading to a sharp increase in the pH (from 7 to 13) of the batch solution by the addition of hydroxyl ions as well as a significant rise of the calcium concentration (Fig. 2-A)
CaO + H2O → Ca2+ + 2 OH- (8)
2. cation exchange occurs for montmorillonite, resulting in a saturation of the exchangeable population with calcium at the expense of all other cations (Fig. 2-B)
2 Na + Ca2+→ Ca + 2 Na+
(9)
3. precipitation of portlandite when the solution reaches a saturation state with respect to this mineral (Fig. 2-A)
Ca2+ + 2 OH- → Ca(OH)2 (10)
4. dissolution of the most reactive accessory minerals eventually begins, i.e. cristobalite reacts with portlandite to form the first C–S–H phases (not shown)
SiO2 + Ca(OH)2 → C–S–H (11)
These reactions originally take place in parallel, but become coupled within a few days. Reactions (8) and (9) are sometimes referred as the modification process, which is responsible for the flocculation of clay particles [1]. The dissolution of cristobalite releases silica in solution and so partly regulates the pH. The formation of portlandite and C–S–H decreases the calcium concentration of the batch solution. This is the very first step in the chronology of the pozzolanic process.
In the modeling, the pH at 1 day is close to 12.6; which corresponds to the equilibrium with portlandite. The experimental pH (pH = 13) is slightly higher, which may reflect a latent period of portlandite formation. A complementary modeling indicated that contribution of alkaline oxides (K-NaO) lime content was not sufficient to explain such a pH in the modeling, as it would be the case in the interstitial waters of Portland cement
(CEM I). This is due to the relatively high dilution induced by the L/S ratio of 10. The rapid decrease in the magnesium content of the exchangeable population of the bentonite in the modeling is due to both the influx of calcium in solution and brucite precipitation. The equilibrium with secondary brucite at high pH leads to a low Mg concentration in solution through the solubility product constraint Mg2+ OH- 2= Ksbrucite.
[FIGURE 2]
4.3 Medium-term evolution (1–30 days)
At a weekly to a monthly timescale, the following coupled processes take place:
1. further dissolution of cristobalite (Fig. 3-A) that still reacts with portlandite (or with Ca2+ ions promoting portlandite dissolution) that results to a permanent
formation of C–S–H
SiO2 + Ca(OH)2 → C–S–H (12)
2. continuous dissolution of montmorillonite leading to the formation of C–(A–)S– H in the experiment and C–S–H plus strätlingite in the model (Fig. 3-B)
Ca(OH)2 + Ca0.17Mg0.33Al1.68Si4O10(OH)2 → C–S–H +
Ca2Al2(SiO2)(OH)10:3H2O (13)
3. gradual pH decrease due to montmorillonite dissolution, yielding first portlandite consumption and then decalcification of C–S–H.
All those reactions consist in the core of the pozzolanic process, whose rate-limiting step is the constant rate of cristobalite dissolution and then montmorillonite dissolution. The dissolution of cristobalite is significantly faster, however, the dissolution of montmorillonite plays a leading role in the medium and long-term because of its greater mass amount relative to other minerals. In the modeling, the break in the slope of C–S–H growth is due to the complete depletion in cristobalite and the slight inflexion in the cristobalite content close to full depletion due to the reactive surface law (Eq. 6). Montmorillonite dissolution becomes the only source of silica after cristobalite consumption. This dissolution also provides aluminum ions in solution, which integrates the C–S–H structure to form C–A–S–H in the experiment but, as a surrogate, C–S–H plus strätlingite in the modeling. The slight contribution of aluminum versus silicon becomes
more significant after 15 days. This is clearly illustrates while comparing the C–S–H content profile and those summing C–S–H with additional strätlingite in Fig. 3-B. This is in good agreement with the NMR analyses that have shown that calcium silicate hydrate contained aluminum in tetrahedral position within its structure [10]. It is well-known that aluminum may substitute silicon in C–S–H [15], for instance during the pozzolanic reaction of fly ash cements [25,26] and silica fume cements [28]. It is worth noting that the precipitation of C3AH6 secondary compounds (e.g. hydrogarnet) was not established, both by XRD analysis and modeling. The precipitation of siliceous hydrogarnets seems to only take place above 50°C due to kinetic hindrance [25].
Fig. 4 demonstrates the sensitivity of the present pozzolanic model as a function of the initial amount of cristobalite (3 or 7 wt.%). Modeling indicates a competition between the formation of portlandite and the formation of C–S–H with respect to calcium. The more cristobalite provides silica, the less is the proportion of portlandite vs. C–S–H, and the more quickly calcium decreases in the batch solution. An initial content of cristobalite of 7 wt.% in the modeling is in better agreement with experiment.
Eventually, the precipitation of secondary illite was disabled at 50°C in the modeling to prevent a strong decrease of the potassium concentration in the batch solution. Illite precipitation and a very low potassium concentration were not consistent with the analyses of the aqueous and solid phases.
[FIGURES 3 & 4]
4.4 Longer-term evolution (> 30 days)
At a multi-month timescale, montmorillonite continues to react meanwhile the relative contribution of the aluminous C–A–S–H pole increases (Fig. 5-A). The progressive dissolution of montmorillonite reduces the pH of the batch solution and yields a decalcification of C–S–H. Their ratio Ca/Si gradually drops from 1.6 to 1.2, and finally 0.8 (Figs. 5-A and 5-B). This C–S–H evolution is clearly consistent with the 29Si NMR data [10]: reduction of the proportion of Q1 sites (i.e. a C–S–H of high Ca/Si and low
chain length) for the benefit of the Q2 sites (i.e. a C–S–H of low Ca/Si and great chain
length). The relationship between pH decrease and C–S–H decalcification is also in full agreement with the experimental data and models found in the literature [e.g. 13,29].
4.5 Evolution with time of the batch solution chemistry
Fig. 6 compares the modeling and experiment results for the pH and the concentrations of chemical elements in the batch solution. The model better captures the qualitative tendency over time than the quantitative data. However, the agreement is generally satisfactory considering element concentrations ranging over several orders of magnitude: relatively high concentrations for calcium, silicon and sodium from the one hand, relatively low concentrations for aluminum, potassium and magnesium from the other hand. As a general trend, the pH and calcium concentration decreases with time whereas aluminum and silica concentrations increase. These evolutions occur simultaneously and are clearly coupled to each other through the mineralogical evolutions.
For instance, the pH is initially at 12.6 (portlandite equilibrium), and then gradually decreases (Fig. 6-A). The long-term calculated pH is however too high compared to the measured value. Calcium concentration (Fig. 6-B) falls once portlandite is consumed by the pozzolanic reactions, albeit the long-term calculated values (controlled by calcite and C–S–H of decreasing Ca/Si ratio) are again too high with respect to the experimental data. The concentrations of aluminum, silica and potassium are more correctly estimated. In the model the temporal changes in the potassium concentration (Fig. 6-E) is directly linked to calcium concentration, which is controlled by mineral solubility, and K/Ca cation exchange in the bentonite. Omitting the latter process leads to a poor model/experiment agreement for potassium. The magnesium concentration (Fig. 6-F) is the lowest of all concentrations, both experimentally and in the calculations. Magnesium concentration is controlled by a solid phase of low solubility, i.e. hydrotalcite according to modeling, Fig. 1-B, and literature on Portland cements.
[FIGURE 6]
5.6 Temperature effect
When temperature increases from 20 to 50°C, this accelerates the kinetics of bentonite dissolution and pozzolanic reactions both in the modeling and the batch experiments. At 50°C, portlandite has not the time to form as a result of its competition with C–S–H formation (Fig. 7-A). Indeed, the faster dissolution of cristobalite and montmorillonite yield a consecutive fast supply of silica in the batch solution available for C–S–H. Fig. 7-B shows that decalcification of C–S–H, and thus the balance between maturation and degradation of the treated material, is also accelerated by temperature. C–S–H 0.8 is the
single C–S–H phase after 1 month at 50°C. The transformation of brucite into hydrotalcite also takes place earlier at 50°C.
Overall, as regards to the pozzolanic processes, an acceleration factor of 5 is estimated when temperature rises from 20 to 50°C. This would correspond to an apparent activation energy (Eq. 7) of 45 kJ/mol, similar to the activation energy of montmorillonite dissolution (Table 4). The applicability of the Arrhenius activation law was also demonstrated in the kinetics of lime/zeolite pozzolanic reactions [30].
Eventually it is worth noting that montmorillonite reaches a saturation (equilibrium) state with respect to the chemistry of the batch solution after 1 month at 50°C whereas montmorillonite remains strongly under-saturated after 3 months at 20°C. Consequently, the mineralogy does not significantly change in the modeling after 1 month at 50°C. Temperature also has an effect on the pH and the calcium concentrations in the batch solution. The pH is one order of magnitude lower at 50°C both in the experiment and the modeling (Fig. 6-A), partly due to the temperature-dependence of the water dissociation product (pKw = 14.17 and 13.26 at 20 and 50°C, respectively). The first pH values are
consistent with portlandite equilibrium whose pH is 12.65 at 20°C and 11.65 at 50°C. The increase of the pozzolanic kinetics implies a decrease in the calcium content that occurs significantly earlier in time both in the experiment and the modeling (Fig. 6-B). The temperature seems to have less influence on the other concentration profiles.
Al-Mukhtar et al. [8] also noted a significant acceleration of lime consumption, pozzolanic reactions and pH decrease when temperature rises from 20 to 50°C. A speeding factor of 5 over this temperature range can also be deduced from their experimental results of lime-treated clayey soils. Temperature enhanced in a similar manner the pozzolanic reaction of fly ash and silica fume cements [26,28], accelerating the change of C–S–H composition towards lower Ca/Si ratio and the change of pore solution towards lower pH and Ca concentration but higher Al and Si concentrations.
[FIGURE 7]
A multi-process chemical model, built on thermodynamic and kinetic data from the literature, has proved able to capture and study into details the reactive sequence of experiments dedicated to the reactivity of clay minerals in the presence of lime. The previous multi‐technique monitoring of batch tests, especially 29Si NMR analysis over time, provided for rather unique quantitative experimental data. Cation exchange, mineralogical transformations driven by pozzolanic reactions and, to a lesser extent, the chemistry of the batch solutions, have been correctly simulated; the first two processes being the most important in regard to soil stabilization and improvement of their geotechnical properties. Lime hydration occurs within a few hours, modifying the cation exchangeable population of the clay phases and increasing the pH of the batch solution. These alkaline conditions initiate the pozzolanic reactions in a second stage, whose rate-limiting step is controlled by the Si availability of the bentonite minerals (cristobalite vs. montmorillonite). There is a relatively fast and total consumption of cristobalite. A slower dissolution of montmorillonite takes place in parallel. The kinetic rate of the pozzolanic reaction increases by a factor 5 from 20 to 50°C (corresponding to an apparent activation energy of 45 kJ/mol). Cement-type phases, essentially calcium silicate hydrate (C–S–H, with a partial Si/Al substitution), are formed consequently to the dissolution of the primary phases. Their stoichiometry and relative proportions evolve with time and temperature. In particular the Ca/Si ratio of C–S–H decreases with time.
The lack of solid solution data to correctly model C–A–S–H formation has been a limitation and the model seems to overestimate the kinetics of bentonite/C–S–H interactions on the long-term. However, predictive studies can be considered using this model. Preliminary applications of the present model to consolidated samples and natural soils have given promising results [31]. This model should be also well suited to take into account the carbonation of pozzolanic phases that was not experimentally studied here. The present set of kinetic and thermodynamic data can be useful in other topics, such the alkaline plume effect of concrete on clay materials in radioactive waste disposals.
Acknowledgements
This work was supported by the French ANR project TERDOUEST. The constructive and detailed comments of an anonymous reviewer are greatly acknowledged, as well as
fruitful discussions with our colleagues Anne-Claire Gaillot and Michael Paris at IMN (Nantes, France).
References
[1] F.G. Bell, Lime stabilization of clay minerals and soils, Engineering Geology 42 (1996) 223-237.
[2] J. Locat, H. Tremblay, S. Leroueil, Mechanical and hydraulic behaviour of a soft inorganic clay treated with lime, Canadian Geotechnical Journal 33 (1996) 654-669.
[3] B. Le Runigo, O. Cuisinier, Y.J. Cui, D. Deneele, V. Ferber, Impact of the initial state on fabric and permeability of a lime treated silt under long term leaching, Can. Geotech. J. 46 (2009) 1243-1257.
[4] A. Eisazadeh, K. A. Kassim, H. Nur, Solid-state NMR and FTIR studies of lime stabilized montmorillonitic and lateritic clays, Applied Clay Science 67–68 (2012) 5-10.
[5] S. Diamond, E.B. Kinter, Mechanisms of soil-lime stabilization. An interpretive review, Highway Research Board Record 92 (1965) 83-102.
[6] R.N. Yong, V.R. Ouhadi, Experimental study on instability of bases on natural and lime/cement-stabilized clayey soils, Applied Clay Science 35 (2007) 238-249. [7] M. Al-Mukhtar, A. Lasledj, J.-F. Alcover, Behaviour and mineralogy changes in
lime-treated expansive soil at 20°C, Applied Clay Science 50 (2010) 191-198. [8] M. Al-Mukhtar, A. Lasledj, J.-F. Alcover, Behaviour and mineralogy changes in
lime-treated expansive soil at 50°C, Applied Clay Science 50 (2010) 199-203. [9] D. Damidot, B. Lothenbach, D. Herfort, F.P. Glasser, Thermodynamics and cement
science, Cement and Concrete Research 41 (2011) 679-695.
[10] E. Pomakhina, D. Deneele, A.C. Gaillot, M. Paris, G. Ouvrard, 29Si solid state NMR investigation of pozzolanic reaction occurring in lime-treated Ca-bentonite, Cement and Concrete Research 42 (2012) 626-632.
[11] J. van der Lee, L. De Windt, V. Lagneau, P. Goblet, Module-oriented modeling of reactive transport with HYTEC, Computers and Geosciences 29 (2003) 265-275.
[12] E. Gaucher, P. Blanc, Cement/clay interactions – a review: experiments, natural analogues and modeling, Waste Management 26 (2006) 776-788.
[13] Ph. Blanc, X. Bourbon, A. Lassin, E.C. Gaucher, Chemical model for cement-based materials: Temperature dependence of thermodynamic functions for nanocrystalline and crystalline C–S–H phases, Cement and Concrete Research 40 (2010) 851-866. [14] Ph. Blanc, X. Bourbon, A. Lassin, E.C. Gaucher, Chemical model for cement-based
materials: Thermodynamic data assessment for phases other than C–S–H, Cement and Concrete Research 40 (2010) 1360-1374.
[15] X. Pardal, I. Pochard, A. Nonat, Experimental study of Si–Al substitution in calcium-silicate-hydrate (C-S-H) prepared under equilibrium conditions, Cement and Concrete Research 39 (2009) 637-643.
[16] C.A.J. Appelo, D. Postma, Geochemistry, Groundwater and Pollution, Second Edition, CRC Press, 649 pages, 2005.
[17] P. Wersin, Geochemical modelling of bentonite porewater in high-level waste repositories, Journal of Contaminant Hydrology 61 (2003) 405-422.
[18] J.L. Palandri, Y.K. Kharaka, A compilation of rate parameters of water-mineral interaction kinetics for application to geochemical modeling. Techn. Rep. 2004-1068, Menlo Park : US Geological Survey, 64 pages, 2004.
[19] S.L. Brantley, J.D. Kubicki, A.F. White, Kinetics of water-rock interactions, Springer, New-York (USA), 833 pages, 2008.
[20] S.J. Köhler, F. Dufaud, E.H. Oelkers, An experimental study of illite dissolution kinetics as a function of pH from 1.4 to 12.4 and temperature from 5 to 50°C, Geochimica and Cosmochimica Acta 19 (2003) 3583-3594.
[21] L. De Windt, P. Chaurand, J. Rose, Kinetics of steel slag leaching: Batch tests and modeling, Waste Management 31 (2011) 225-235.
[22] T. Thoenen, B. Baeyens, M.H. Bradbury, Sorption data bases for generic Swiss argillaceous, crystalline and calcareous rock systems. Villigen, Switzerland: Paul Scherrer Institut PSI (2010) 104 p. PSI Bericht Nr. 10-03.
[23] J.H. Henderson, M.L. Lackson, J.K Syers, R.N. Clayton, R.W. Rex, Cristobalite authigenic origin in relation to montmorillonite and quartz origin in bentonite, Clays and Clay Minerals 19 (1971), 229–238.
[24] J.D. Rimstidt, H.L. Barnes, The kinetics of silica-water reactions, Geochimica et Cosmochimica Acta 44 (1980) 1683-1699.
[25] B. Lothenbach, G. Le Saout, M. Ben Haha, R. Figi, E. Wieland, Hydration of a low-alkali CEM III/B–SiO2 cement (LAC), Cement and Concrete Research 42
(2012) 410-423.
[26] F. Deschner, B. Lothenbach, F. Winnefeld, J. Neubauer, Effect of temperature on the hydration of Portland cement blended with siliceous fly ash, Cement and Concrete Research 52 (2013) 169-181.
[27] M. Önal, S. Kahraman, Y. Sarıkaya, Differentiation of α-cristobalite from opals in bentonites from Turkey, Applied Clay Science 35 (2007) 25-30.
[28] T.T.H. Bach, C. Cau Dit Coumes, I. Pochard, C. Mercier, B. Revel, A. Nonat, Influence of temperature on the hydration products of low pH cements, Cement and Concrete Research 42 (2012) 805-817.
[29] D. Sugiyama, T. Fujita, A thermodynamic model of dissolution and precipitation of calcium silicate hydrates, Cement and Concrete Research 36 (2006) 227-237. [30] R. Snellings, G. Mertens, S. Hertsens, J. Elsen, The zeolite–lime pozzolanic
reaction: Reaction kinetics and products by in situ synchrotron X-ray powder diffraction, Microporous and Mesoporous Materials 126 (2009) 40-49.
[31] K. Lemaire, Evolution of physico-chemical, microstructural and hydromechanical properties of silted soil treated with lime submitted to water circulation, Ph.D. thesis (in French), Ecole centrale de Nantes (France), 208 pages, 2012.
Table 1. Primary and secondary phases considered in the modeling. Primary phases - Lime: CaO and calcite
- Bentonite: calcite, cristobalite, K-feldspar, montmorillonite
Secondary phases - All the primary phases can precipitate - brucite, chalcedony, gibbsite, illite, kaolinite - C–S–H 0.8, C–S–H 1.2, C–S–H 1.6, strätlingite
Table 2. Thermodynamic equilibrium formation constants (mass balance equations) of the solid phases considered in the modeling.
Phase Formula Log K
(25°C) Log K (60°C) Brucite Mg2+ + 2H2O → Mg(OH)2 + 2H+ -17.10 -15.00 Calcite Ca2+ + CO 32- → CaCO3 8.48 8.68
Chalcedony H4SiO4 → SiO2 + 2H2O 3.73 3.23
Cristobalite(α) H4SiO4 → SiO2 + 2H2O 3.45 2.99
C–S–H 0.8 0.8Ca2+ + H 4SiO4 + 0.34H2O → Ca0.8SiO4.34H3.08 + 1.6H+ -11.05 -10.17 C–S–H 1.2 1.2Ca2+ + H 4SiO4 + 1.26H2O → Ca1.2SiO5.26H4.12 + 2.4H+ -19.30 -17.67
C–S–H 1.6 1.6Ca2+ + H4SiO4 + 2.18H2O → Ca1.6SiO6.18H5.16 +
3.2H+
-28.00 -25.55
C4AH13 2Al3+ + 4Ca2+ + 20H
2O → Ca4Al2O7:13H2O + 14H+ -103.65 -91.73
Gibbsite Al3++ 3H2O → Al(OH)3 + 3H+ -7.74 -5.85
Hydrogarnet 2Al3+ + 3Ca2+ + 12H
2O → Ca3Al2(OH)12 + 12H+ -80.32 -69.57
Hydrotalcite 2Al3+ + 4Mg2+ + 17H2O → Mg4Al2(OH)14:3H2O +
14H+
-73.74 -63.87
Illite 2.35Al3+ + 0.85K+ + 0.25Mg2+ + 3.4H4SiO4 →
1.6H2O + 8.4H+ + K0.85Mg0.25Al2.35Si3.4O10(OH)2
-10.25 -6.16
Kaolinite 2Al3+ + 2H4SiO4 + H2O → Al2Si2O5(OH)4 + 6H+ -6.47 -3.35
K-feldspar Al3+ + K+ + 3H
4SiO4 → KAlSi3O8 + 4H2O + 4H+ -0.05 0.99
Lime-Mg 0.97Ca2+ + 0.03Mg2+ + H
2O → Ca0.97Mg0.03O + 2H+ -32.70 -29.13
Monocarboaluminate 2Al3+ + 4Ca2+ + CO32- + 16.7H2O →
Ca4Al2CO3(OH)12:4.7H2O + 12H+
-70.30 -60.80
Montmorillonite-Ca 1.68Al3+ + 0.17Ca2+ + 0.33Mg2+ + 4H4SiO4 →
4H2O + 6H++ Ca0.17Mg0.33Al1.68Si4O10(OH)2
-5.07 -2.12
Portlandite Ca2+ + 2H2O → Ca(OH)2 + 2H+ -22.81 -20.42
Strätlingite 2Al3+ + 2Ca2+ + H
4SiO4 + 11H2O →
Ca2Al2(SiO2)(OH)10:3H2O + 10H+
Table 3. Selectivity constants of cationic exchange (Gaines-Thomas formalism) and constants of surface complexation reactions (double layer model).
Reaction logK (25°C) Cation exchange Na + K+ → K + Na+ 0.60 2 Na + Ca2+ → Ca + 2 Na+ 0.41 2 Na + Mg2+ → Mg + 2 Na+ 0.34 Surface complexation S1-OH + H+ → S1-OH2+ 4.5 S1-OH → S1-O- + H+ -7.9 S2-OH + H+ → S2-OH2+ 6.0 S2-OH → S2-O- + H+ -10.5
Site density S1-OH 1 µmol/m2
Table 4. Kinetic parameters for the dissolution and precipitation of the solid phases considered in the modeling (Eqs. 6 and 7).
As [m2/g] k (25°C) [mol/m2/s] p Ea [kJ/mol] Primary phases Lime-Mg 5 2.5×10⁻⁸ (1) - - Calcite 0.05 5×10⁻⁷ - 25 α-Cristobalite 10 5×10-12 - 70 10 5×10⁻⁹ (1) - 30(1) K-feldspar 0.01 10-15 -0.3 70 Montmorillonite 50 10-15 -0.2 50 Secondary phases(2) Illite - (3) 10-9 -0.6 70 - no precipitation(1) - - Kaolinite - (3) 10-15 -0.3 30
(1) Adjusted to fit the experimental data (see Secs. 4.1 and 4.2). (2) Considered for these clayey phases only; all the other secondary phases reported in Table 1 were modeled under thermodynamic equilibrium. (3) Constant surface fixed to 1 m2/L.
Figure captions.
Figure 1. Evolution with time of the primary phases of bentonite and the pozzolanic
phases obtained by modeling and 29Si NMR analysis at 20°C; symbols correspond to experimental data (square = montmorillonite, triangle = C(–A)–S–H, empty circle
¡ = K-feldspars and solid circle = cristobalite).
Figure 2. Short-term processes at 20°C: (A) concomitant evolutions of lime content,
portlandite content and pH; (B) re-organization of the exchangeable cation population; symbols correspond to experimental data (square = pH, empty circle ¡ = portlandite).
Figure 3. Medium-term processes at 20°C: concomitant evolutions of cristobalite,
montmorillonite, portlandite, C–S–H and strätlingite contents; symbols correspond to experimental data (solid circle = cristobalite, empty circle ¡ = portlandite, square = montmorillonite, triangle = C–S–H plus strätlingite.
Figure 4. Effect of the initial cristobalite content on the evolutions of the portlandite
content and the calcium aqueous concentration at 20°C; symbols correspond to experimental data (empty circle ¡ = portlandite, solid circle = Ca concentration).
Figure 5. Long-term processes, progressive decalcification C–S–H at 20°C: (A) C–S–H
and strätlingite contents, (B) modeling C/S ratio and 29Si NMR measurement of the Q1
and Q2 site ratio; the symbol (square ) corresponds to experimental data.
Figure 6. Evolution with time of the chemistry of the batch solution at 20 and 50°C;
symbols correspond to experimental data (square = 20°C, empty circle ¡ = 50°C).
Figure 7. Effect of temperature (20 → 50°C) on the portlandite content at short-term and
on the montmorillonite and C–S–H contents at medium-term; symbols correspond to experimental data (square = 20°C, empty circle ¡ = 50°C).
(A) (B)
(A) (B)
(A) (B)
(A) (B)
(A) (B)
(C) (D)
(E) (F)
(A) (B)