HAL Id: hal-02632094
https://hal.archives-ouvertes.fr/hal-02632094
Submitted on 9 Jul 2020
HAL is a multi-disciplinary open access
archive for the deposit and dissemination of
sci-entific research documents, whether they are
pub-lished or not. The documents may come from
teaching and research institutions in France or
abroad, or from public or private research centers.
L’archive ouverte pluridisciplinaire HAL, est
destinée au dépôt et à la diffusion de documents
scientifiques de niveau recherche, publiés ou non,
émanant des établissements d’enseignement et de
recherche français ou étrangers, des laboratoires
publics ou privés.
temperature : Cu6Sn5 as a case study
Nadia Soulmi, Ana Gabriela Porras Gutierrez, Cecile Rizzi, Juliette
Sirieix-plénet, Laurent Gaillon, Henri Groult, Anne-Laure Rollet, Evrim
Umut, Danuta Kruk, Mathieu Duttine, et al.
To cite this version:
Nadia Soulmi, Ana Gabriela Porras Gutierrez, Cecile Rizzi, Juliette Sirieix-plénet, Laurent Gaillon,
et al.. Sn-based alloys synthesized in an ionic liquid at room temperature : Cu6Sn5 as a case study.
ChemNanoMat, Wiley, 2020, 6 (4), pp.639-647. �10.1002/cnma.201900718�. �hal-02632094�
1
Sn-based alloys synthesized in room temperature ionic liquid:
Cu
6
Sn
5
as a case study
Nadia Soulmi,
[a],[b]Ana Gabriela Porras Gutierrez,
[a],[b]Cécile Rizzi,
[a],[b]Juliette Sirieix-Plénet,
[a],[b]Laurent Gaillon,
[a],[b]Henri Groult,
[a],[b]Anne-Laure Rollet,
[a],[b]Evrim Umut,
[c],[g]Danuta Kruk,
[c]Mathieu
Duttine,
[d]Olaf. J. Borkiewicz,
[e]Oleg I. Lebedev,
[f]and Damien Dambournet*
[a],[b][a] N. Soulmi,A G Porras Gutierrez, C. Rizzi,J. Sirieix-Plénet, L. Gaillon, H. Groult, A-L Rollet, D. Dambournet
Sorbonne Université, CNRS, Physico-chimie des électrolytes et nano-systèmes interfaciaux, PHENIX, F-75005 Paris, France E-mail: [email protected]
[b] N. Soulmi,A G Porras Gutierrez, C. Rizzi,J. Sirieix-Plénet, L. Gaillon, H. Groult, A-L Rollet, D. Dambournet Réseau sur le Stockage Electrochimique de l'Energie (RS2E), FR CNRS 3459, 80039 Amiens Cedex, France [c] E. Umut, D. Kruk
Faculty of Mathematics and Computer Science, University of Warmia and Mazury in Olsztyn, Słoneczna 54, 10710 Olsztyn, Poland [d] M. Duttine,
CNRS, Univ Bordeaux, ICMCB, UPR 9048, F-33600 Pessac, France [e] Olaf. J. Borkiewicz
X-ray Science Division, Advanced Photon Source, Argonne National Laboratory, Argonne, Illinois, USA [f] Oleg I. Lebedev,
Laboratoire CRISMAT, ENSICAEN, Université de Caen, CNRS, 6 Bd Maréchal Juin, F-14050 Caen, France [g] Dokuz Eylul University, Department of Medical Imaging Techniques, 35330, Izmir, Turkey
Supporting information for this article is given via a link at the end of the document.((Please delete this text if not appropriate))
Abstract: Sn-based alloys are increasingly investigated owing to possible electronic/structural modulations of interest for electrocatalysis and energy storage applications. Here, we report on the use of a chemical system consisting of an ionic liquid (1-ethyl-3- methylimidazolium bis(trifluoromethanesulfonyl)imide: [EMIm+][TFSI−]) and Sn-based precursor Sn(TFSI)
2 both featuring
similar anionic groups. This strategy enabled to increase the solubility of the cationic precursor in the IL and avoid the formation of side products during the precipitation of Sn-nanoparticles formed upon reaction with a reducing agent (NaBH4). Using NMR relaxometry, we
further established that these nanoparticles are stabilized by specific interactions with the cationic group of the IL. Targeting the composition Cu6Sn5, we further demonstrated that this approach can
be used to prepare Sn-based alloys which could not be prepared using conventional chloride-based precursors.
Introduction
Sn-based alloys are an interesting class of materials for applications spanning from catalysis to electrochemical energy storage. Alloying serves as a mean to tune the solid electronic properties[1] and can provide enhanced electrochemical
performances in lithium cells owing to the formation of an inert matrix[2]. The precise control of the atomic structure of alloys
appears, however, largely dependent on the synthesis method employed. Although ionic liquids are considered as suitable solvents to prepare unusual materials, the synthesis of binary alloys is more challenging. The resulting compound may not be alloys but core-shell like nanoparticles, fused clusters, or simply a mixture of the monometallic nanoparticles.[3] This diversity of
results is due to the numerous contributing factors that are the nature of the solvent, its compatibility with the metallic precursors, the reaction kinetics and metal surface interactions with the solvent.
Literature data dealing with the synthesis of Sn-based alloys in ionic liquid solvent mostly relied on the decomposition of metallic precursors. For example, Wegner et al reported the synthesis of ruthenium and tin metallic alloys using 1-Ethyl-3-methylimidazolium tetrafluoroborate [BMIm+][BF
4-], leading to the
formation of Ru2Sn alloys and a mixture of a Ru3Sn7 and α-Sn
phase.[4] Dietrich et al used PtCl
2, SnCl2 or Sn(acac)2 as metallic
precursors, methyltrioctylammonium bis(trifluoromethylsulfonyl)imide as the solvent and triethylborohydride as the reducing agent. Pt-Sn alloy nanoparticles were obtained without being able to strictly define the synthetized phase. According to x-ray diffraction analysis, the crystalline phase obtained were indexed with cubic metallic Pt, with diffraction peaks displaced to smaller Bragg angles, indicating the incorporation of Sn into the Pt lattice, and the possible formation of randomly alloyed nanoparticles. In addition, small SnO2 nanoparticles in close contact with alloyed
nanoparticles were observed by HRTEM.[5] This illustrates the
difficulty to control the composition of the alloyed phase. To control the chemical composition of Sn-based alloys, we proposed to use metallic precursors based on TFSI- counter ions
dissolved in an [EMIm+][TFSI−] ionic liquid. The use of common
anion for both metallic precursors and the ionic liquid was shown to be an effective approach to (i) increase the solubility of cations in ILs,[6,7] especially as compared to conventionally used halide
salts,[8] (ii) prevent impurities related to Cl- anions[7] and (iii) enable
the successful synthesis of nanosized metals[6,7,9,10]. We selected
the tin-copper system and particularly the Cu6Sn5 chemical
composition for its possible use as an anode for lithium-ion batteries. We compared the synthesis employing TFSI- based
precursors with conventionally used chloride salts.
2
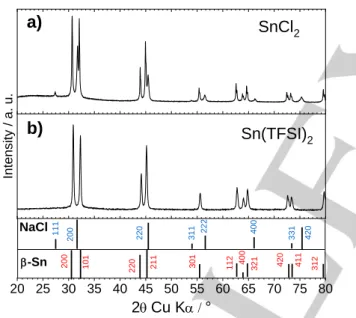
Synthesis of metallic Sn. The precipitation of metallic Sn synthetized using NaBH4 as the reducing agent in [EMIm+][TFSI−]
ionic liquid was investigated using two salts that are Sn(TFSI)2
and SnCl2. In both cases, the addition of the salt and the reducing
agent dissolved in [EMIm+][TFSI−] results in the formation of a
black precipitate. Figure 1a gathers the X-ray diffraction powder pattern of both samples recovered after the synthesis. As previously reported,[11] the use of SnCl
2 led to the formation of a
phase mixture consisting in -Sn and NaCl as an impurity. The use of Sn(TFSI)2 enabled to prepare single phase of -Sn without
any traces of impurity.
We further compared the particle size and polydispersity of the two samples. Sn(TFSI)2 precursor led to an average particle size
15 nm (Figure S1) which is larger than that observed for SnCl2
(7 nm). This increase of the particle size is accompanied by an increase of the size polydispersity going from 29 to 35%. Such differences suggest that the nature of the cationic precursor affects the nucleation/growth mechanism of metallic Sn. This can be tentatively explained by differences in metallic salt solubility. The low solubility of SnCl2 precursor might result in a continuous
supply of cations promoting growth of metal particles with a smaller size and a narrower distribution.[12,13]
Figure 1. X-ray diffraction powder patterns of the samples prepared using a)
SnCl2 and b) Sn(TFSI)2 as precursors.
NPs stabilization probed by NMR relaxometry. The chemical reactants used provides a versatile system to investigate the nature of the interactions between the ionic liquid and the surface of the nanoparticles. To do so, we explore the use of 1H and 19F
spin-lattice relaxation experiments performed on a solution containing freshly precipitated -Sn prepared using the TFSI-
precursor, in the frequency range of 10 kHz – 40 MHz (referring to the 1H resonance frequency).
“Classical” NMR relaxation experiments are performed at a single magnetic field while here, the magnetic field can be varied in a very broad range thanks to the concept of Fast Field Cycling[14,15],
a technique well suited to probe the interactions between a solvent and nanoparticle’s surfaces.[16] The great advantage of
this method is its ability to probe in a single experiment, molecular and ionic dynamical processes occurring on much different time scales.20,[19],24,25 The relaxation dispersion profiles (relaxation
rates plotted versus the resonance frequency) reveal specific effects (not observed in “classical” NMR relaxation studies) that can be treated as a fingerprint of the slowing down of ionic dynamics due to interaction with surfaces. Here, we used an original approach as the experiments were performed at the frozen state and exploit the modification of the 14N nuclear energy
levels induced by the presence of metallic nanoparticles. Indeed, the standard approach is to record relaxation dispersion profiles in the liquid state and to model the fluctuations of the dipolar interactions – source of relaxation – experienced by the nuclei.[18],[20] In other words, the goal in liquid is to model the
dynamics of the molecule: rotation, diffusion in the bulk, diffusion at the surface of the particles, etc.[18,21–25] In the present situation, it can be tricky to distinguish between the case of the cation (or anion) diffusing on the surface of the raw nanoparticles of diameter D and the case of nanoparticles covered by a layer of anion (or cation) leading to a diameter of D+d (d being approximately 20 times smaller than D). With [EMIm+][TFSI−], the
presence of 14N in both the anion and the cation can be a source
of relaxation enhancement at specific frequencies provided that the dynamic is slow. This effects is referred as Quadrupole Relaxation Enhancement (QRE).21,[29],33–35 The 1H (19F)
spin-lattice relaxation originates from several relaxation pathways between the 1H (19F) nuclei and other NMR active nuclei in the
neighborhood, especially 14N. As the spin quantum number of 14N
nuclei is larger than ½ (it is 1), the nuclei experience two kinds of interactions: Zeeman interaction and quadrupole coupling, i.e., a coupling with the electric field gradient tensor at its position. For slow dynamics, the energy level structure of 14N is determined by
a superposition of its Zeeman and quadrupole interactions. When the 1H resonance frequency (the transition frequency between the 1H energy levels) matches one of the 14N transition frequencies,
the 1H polarization can be taken over by 14N, as a result of the
mutual magnetic dipole-dipole coupling between the participating nuclei, leading to a frequency-specific enhancement of the 1H
spin-lattice relaxation rate referred to as QRE; the 1H spin-lattice
relaxation maxima are called quadrupole peaks. The positions of the quadrupole peaks depend on the quadrupole parameters which are determined by the electric field gradient tensor at the
14N position and appear when (as already pointed out) the
dynamic is sufficiently slow.[15,26–28] For 14N there are three
quadrupole peaks at the frequencies of 3 4⁄ aQ(1-⁄ ) , 3
3 4⁄ aQ(1+⁄ ) and 𝑎3 𝑄(⁄ ) where 𝑎2 𝑄 is the quadrupolar
coupling constant of 14N, and the asymmetry parameter of the
electric field gradient at the position of the 14N nucleus. The
positions of the quadrupole peaks can be treated as markers of the 14N chemical environment as 𝑎
𝑄 and values are sensitive to
the electric field gradient.
Figure 2 a and b display the 1H and 19F spin-lattice relaxation rate
profile for [EMIm+][TFSI−] at frozen state (T = -40 °C) where
motions are sufficiently slow to allow QRE peaks existence. At least six clear peaks (some may be overlapped) on 1H profile and
four peaks on 19F profile are observable. The mechanism of the 1H and 19F NMR relaxation is the dipole-dipole interaction that
decreases as r-3, r being the distance between the two dipoles,
i.e., 1H (or 19F) – 14N distance for the QRE peaks. To identify the
origin of the QRE peaks, we used the crystalline structure of the solid [EMIm+][TFSI−] solved by Choudhury et al[30], and listed the
20 25 30 35 40 45 50 55 60 65 70 75 80 331 -Sn
2
q
Cu K
a /
°
NaCl 111a)
200 220 311 222 400 420 Intensity / a. u. 200 101 220 211 301 112 400 321 420 411 312b)
Sn(TFSI)
2SnCl
23
different inter-atomic distances between 14N and 1H/19F close
neighbors (Table S1). On one hand, it appears that all the 14N
carried by both the cation and the anion, are close to 1H leading
to seven observable QRE peaks. On the other hand, 14N are far
from 19F except for the 14N carried by the anion[30] leading to a
lower number of QRE peaks in the 19F NMR relaxation profile.
Furthermore, by comparing both profiles, peaks II and III seems to be related to the 14N carried by the anion.
Similar experiment was then conducted on a [EMIm+][TFSI−]
solution of -Sn freshly prepared using TFSI- precursor. Figure 2
c and d show the 1H and 19F NMR relaxation profile for a frozen
(T=-40 °C) [EMIm+][TFSI−] solution of -Sn. The striking feature is
the strong modification of the QRE peaks at high frequencies on the 1H profile. Instead of the two narrow peaks at 2.7 and 3.2 MHz,
appears a broad and intense feature around 4.4 MHz. On the contrary, 19F profile is weakly modified by the presence of metallic
nanoparticles. The 1H and 19F NMR relaxation results suggest that
only the cationic groups [EMIm+] interact strongly with the surface
of the nanoparticles.
Furthermore, the same experiments were conducted on oxidized Sn nanoparticles dispersion in [EMIm+][TFSI−]. In this case, both
the 1H and 19F profiles for oxidized Sn nanoparticles dispersion
are superimposed to those of neat [EMIm+][TFSI−] (Figure S2).
First, this result confirms that the chemical nature of the nanoparticles - and not the possible chemical bonding with the surface - is responsible of the strong modification of 14N
properties. Second, it confirms that the nanoparticles are not oxidized in the ionic liquid.
Figure 2. Spin lattice relaxation rates, R1, as a function of the frequency for frozen (A) 1H and (B) 19F within neat [EMIm+][TFSI−] and (C) 1H and (D) 19F within -Sn
in [EMIm+][TFSI−].
Synthesis of Cu-Sn alloys. The synthesis of Cu-Sn alloy of nominal composition Cu6Sn5 was first attempted using chloride
precursors (see experimental section). The addition of the reducing agent led to the successive formation of a brownish precipitate followed by a black coloration (Figure S3). After powder recovery, XRD analysis (Figure 3) revealed the formation of a phase mixture of cubic metallic Cu and -Sn as well as NaCl as an impurity. The successive formation of monometallic
nanoparticles, without the formation of Sn-Cu alloys, might be due to a concomitant effect of the low solubility of chloride precursors and standard potentials gap between Cu2+/Cu (+0.34 V vs. SHE)
4
Figure 3. X-ray diffraction pattern of the sample prepared from chloride Sn-Cuprecursors.
To probe the reactivity of a [EMIm+][TFSI−] solution containing
Sn(TFSI)2 and Cu(TFSI)2 salts, we used cyclic voltammetry (CV)
performed on an inert Mo working electrode, Pt as counter electrode and Sn as the reference. Figure 4a gathers the CVs of [EMIm+][TFSI−] solutions containing 25 mM of Sn(TFSI)
2 or 25
mM of Cu(TFSI)2. The scan was performed at 0.05 V s-1 starting
from the open circuit potential (EOCP) toward cathodic and
reversed anodic sides. Concerning the solution of Sn2+, we
observed a cathodic peak at -0.17 V vs. Sn2+/Sn previously
assigned to the reduction of Sn2+ to Sn0 and a re-oxydation
occurring at +0.10 V.[7] In the case of a 25 mM Cu(TFSI) 2 in
[EMIm+][TFSI−], the voltammograms stabilized after several
cycles (Figure S4) indicating that side reactions occurred. Thereafter, the CV showed a reduction peak at -0.02 V vs. Sn2+/Sn, followed by an oxidation occurring at +0.53 V. Such a
cathodic peak value cannot be assigned based on standard potential due to the contribution of the solvation energy of copper ions in [EMIm+][TFSI−] solvent.[31] Subsequently, we performed
CVs on solutions of 25 mM of Sn(TFSI)2 where we introduced
copper with different Sn:Cu molar stoichiometries of 1.0:0.1, 1.0:0.5 and 1.0:1.2 (Figure 4b).
For Sn:Cu of 1.0:0.1, the CV present a cathodic peak at -0.15 V assigned to Sn2+ Sn0 and a small peak at -0.6V which might be
related to Sn-Cu alloy. The anodic scan features a first intense oxidation peak at 0.02V assigned to the oxidation of Sn0 and a
small peak at 0.38V tentatively assigned to the oxidation of Sn-Cu alloy. Upon increasing the copper concentration, we did not observed cathodic peaks characteristic of the reduction of Sn2+ or
Cu2+. For Sn:Cu of 1.0:0.5, a cathodic peak is observed at -0.39V
along with a broad shoulder centered at -0.77V. These two features can be assigned to the formation of Sn-Cu alloys with different Sn:Cu stoichiometries. In the anodic reverse scan, we observed three peaks at 0, 0.25 and 0.41V, assigned to the oxidation of Sn and two types of Sn-Cu alloys, respectively. For Sn:Cu of 1.0:1.2 that is the targeted nominal composition of Cu6Sn5, the cathodic scan displayed two broad peaks at around
+0.0 and -0.6V. The anodic scan showed the absence of the peak related to Sn at 0.0V and a broad peak at +0.54V related to the formation of different Cu-Sn alloys.
Cyclic voltammetry revealed that the electrochemical responses of a solution of copper and tin in [EMIm+][TFSI−] depends on the
Cu-Sn stoichiometry. In such a system, the measured redox potential is related to the Gibbs energy of the Sn-Cu alloy. The
richness of the Sn-Cu phase diagram is reflected by the numerous peaks observed by CV. This demonstrates that the use of TFSI-
precursor is a suitable approach for the control synthesis of alloys. It should be noted that attempts to measure CVs using chloride precursors failed which can be due to the low solubility of the salt.
Figure 4. Cyclic voltammograms of [EMIm+
][TFSI−] solution containing a) 25 mM Sn(TFSI)2 or Cu(TFSI)2 and b) 50 mM of Sn(TFSI)2 and different content of
Cu(TFSI)2.
In agreement with cyclic voltammetry measurements, the use of TFSI-based precursors resulted in a rapid and homogeneous precipitation upon reaction with NaBH4(Figure S3). The x-ray
diffraction pattern measured on the recovered powder (Figure 5) revealed the formation of Cu-Sn based alloy without any traces of monometallic phases. TEM micrographs (Figure S5) showed the formation of nanoparticles with an average size of 17 nm and a large dispersity of 30 %. For the targeted composition Cu6Sn5, two
types of polymorphs can be formed and are denoted and ’-Cu6Sn5. According to the binary diagram, ’-Cu6Sn5 corresponds
to the low-temperature phase.[32] This structure was previously
solved by Larsson et al,[33] who described it in a monoclinic system
(space group C2/c) presenting a NiAs-Ni2In superstructure. The
20 30 40 50 60 70 80 Cu 331 -Sn
2
q(°) Cu K
a NaCl 111 220 200 111 200 220 311 222 400 420I (a.u
)
200 101 220 211 301 112 400 321 420 411 312SnCl
2+ CuCl
2 -1.0 -0.8 -0.6 -0.4 -0.2 0.0 0.2 0.4 0.6 0.8 1.0 1.2 -500 -250 0 250 500 750 1000 1250 1500 i / µA E / V vs. Sn2+/Sn Sn(TFSI)2 Cu(TFSI)2 a) -0.02 V -0.17 V 0.08 V 0.54 V -1.2 -1.0 -0.8 -0.6 -0.4 -0.2 0.0 0.2 0.4 0.6 0.8 1.0 1.2 1.4 -1000 -500 0 500 1000 1500 2000 i / µA E / V vs. Sn2+/Sn Sn:Cu 1.0:0.1 Sn:Cu 1.0:0.5 Sn:Cu 1.0:1.0 Sn:Cu 1.0:1.2 b)5
high temperature modification -Cu6Sn5 crystallizes in a
hexagonal system (space group P63/mmc) and presents a
NiAs-type structure.[34] Attempts to index the XRD pattern did not allow
to distinct between the two and ’-Cu6Sn5 polymorphs because
of overlapping and broadness of the peaks.
Figure 5. X-ray diffraction pattern of the sample prepared from TFSI
Sn-Cu precursors.
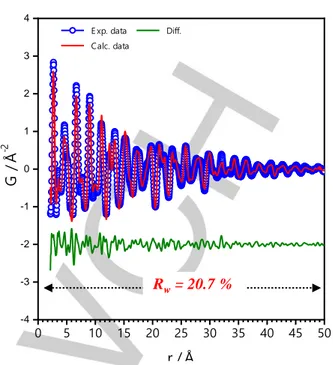
To study the atomic structure of the Cu-Sn alloy prepared using TFSI- based precursors, we used the pair distribution function,
G(r), particularly suited to investigate nanostructured/disordered materials.[35] The PDF gives the interatomic distance distribution
of finding atom separated from the distance r.[36] At the short
inter-atomic distance, we noted the presence of a small peak at around 1.91 Å characteristic of Sn-O bonds indicating the presence of oxides. Attempts to refine the PDF data were performed in the r-range of 2.1-50 Å based on structural models of and ’-Cu6Sn5
polymorphs. The quality of the refinement was quantified by the reliability factor weighted R-value, denoted Rw. The use of
-Cu6Sn5 as structural model fairly reproduced the PDF data with
an Rw value of 29.5% (Figure S6). Structural model based on
’-Cu6Sn5 polymorph improved the fit with an Rw value of 24.8%
(Figure S6). Finally, a two-phase refinement including both
polymorphs as structural models led to a better fit with an Rw value
of 20.7% (Figure 6). The refinement of the scale factor, however, indicated that the ’ polymorph was the dominant phase, i.e., the mass percents of the ’ and phases were 97 and 3%, respectively. The refinement included a size parameter to account for the finite size effect of the nanoparticles on the PDF with a refined value of 11 nm which agrees with TEM observations. The structural parameters of the dominant ’ phase extracted from the PDF refinement are gathered in Table 1 and compared with literature data. Attempts to refine the rate occupancy of Sn atoms improved the fit and revealed the presence of a large content of Sn vacancies. The chemical formula determined from the refinement yielded to Cu6Sn3.31.7 where represents
vacancy. Furthermore, the volume of the cell was slightly larger than the stoichiometric compound suggesting structural distortions which might be due to size effect and/or due to the presence of vacancies.
Figure 6. PDF refinement of the sample prepared from TFSI
Sn-Cu precursors.
Table 1. Structural parameters of the sample prepared from TFSI- precursors
extracted from the PDF refinement. Structural parameters of the reference compound ’-Cu6Sn5 were added for comparison purpose.
Parameters This work ’-Cu6Sn5
Unit cell parameters a (Å) b (Å) c (Å) beta V (Å3 ) Sn atomic occupancy Sn(1) – 8f Sn(2) – 8f Sn(3) – 4e 11.13(2) 7.38(1) 9.74(2) 98.84 792.32 0.53(8) 0.75(8) 0.75(9) 11.022(5) 7.282(4) 9.827(2) 98.84 779.37 1.0 1.0 1.0
The chemical composition of the phase was further investigated using high-angle annular dark-field (HAADF) imaging with a scanning transmission electron microscope (STEM) coupled with Energy-dispersive X-ray (EDX) spectroscopy. Figure 7a shows the HAADF-STEM image of an isolated particle presenting a core-shell morphology. The observation of lattice fringes (see Figure S7 for detailed view) in the core region suggested that it is crystallized. In contrast, the shell appeared amorphous. EDX measured on this individual particle yielded Cu2Sn1 composition
which was close to that found by PDF refinement, i.e., Cu2Sn1.1,
therefore supporting the presence of Sn vacancies. EDX elemental mapping showed that Cu atoms were essentially present in the core region of the particle (Figure 7b). Moreover, we noted the presence of oxygen and tin at the shell level suggesting that the amorphous part was related to an oxide layer formed during the washing step[11].
20 30 40 50 60 70 80 443 80-4 64-3 336 622 71 -1 530 24 -1 40 -2 113 31 -1 20 -2 021 11-3 132 510
'
212 300 203 004 211 202 103 112 210 201 200 102 110 002 101 2q (°) Cu Ka 100 I (a.u) 0 5 10 15 20 25 30 35 40 45 50 -4 -3 -2 -1 0 1 2 3 4 E xp. data Diff. Calc. dataG
/
Å
-2r / Å
R
w= 20.7 %
6
Figure 7. (a) HAADF-STEM image of an isolated particle. (b) EDX elementalmapping for Sn L, Cu K, and O K and overlay color image (right corner) on several nanoparticles. The sample was prepared from TFSI- Sn-Cu precursors.
The Mössbauer spectroscopy of 119Sn (NA: 8.6%) is a powerful
tool for characterizing the oxidation state and the local environment (coordination, chemical bonding, magnetic interactions, …) of tin atoms within crystalline, amorphous or intermetallic compounds. The 119Sn Mössbauer spectra recorded
at room temperature and 4.2 K (Figure 8) were reconstructed with three components corresponding to three different Sn oxidation states. These three subspectra may be associated with different Sn phases that may have different Debye temperatures and thus different Lamb-Mössbauer factors (f), which are related to the subspectrum absorption area. The value that the f factor tends towards as the temperature decreases is 1 then, at 4.2 K the subspectra relative areas (Table 2) correspond more accurately to the relative proportion of the three associated Sn phases. The refined Mössbauer hyperfine parameters (at 293 K) are consistent with crystalline η’-Cu6Sn5 for the Sn0 quadrupole
doublet with isomer shift δ = 2.09 mm.s-1 and a quadrupole
splitting parameter (Δ) around 0.70 mm.s-1,[37,38] amorphous
(disordered) SnO for the Sn2+ quadrupole doublet centered at
δ = 2.96 mm.s-1 with a high Δ value (~1.6 mm.s-1)[11,39] and
amorphous SnO2 for the Sn4+ quadrupole doublet characterized
by an isomer shift close to zero (δ = 0.06 mm.s-1).[11,37] A better fit
to the experimental data was achieved by considering both Sn0
and Sn4+ subspectra as the weighted sum of quadrupole doublets
with Lorentzian shape (line width 0.90 mm.s-1) and the same
isomer shift but different values of Δ, i.e., with a distribution of
quadrupole splitting values. The Δ distributions, which reflect some local disorder or heterogeneity in the tin electronic environment and/or the occurrence of several tin sites, are then characterized by their shape (mono- or multi-modal pattern and extent) and a mean value (labelled with the * sign in the Table 2). The Sn0 subspectrum exhibits a bimodal distribution of the
quadrupole splitting parameter with a contribution at low values (associated with symmetrical electronic environment) and a broad component centered at about 1.0 mm.s-1 (Figure 8). This may
reflect different environments for the tin nucleus depending on the distribution of tin and copper atoms in its surroundings, as expected in the η’-Cu6Sn5 crystalline network where three
different sites have been identified for tin.[33,38] Furthermore, for
copper-tin intermetallic compounds, the 119Sn isomer shifts
increase with the tin : metal ratio; for example, at room temperature, δ (Cu3Sn) = 1.71 mm.s-1 and
δ (Cu6Sn5) = 2.20 mm.s-1.[37,38] Thus, the Sn0 subspectrum
(Figure 8) may be attributed to a tin-copper alloy with a crystalline structure similar to η’-Cu6Sn5 but presenting tin vacancies, as
suggested by PDF refinement and EDX analysis. Hence, the
119Sn Mössbauer that the Sn-Cu NPs synthesized using TFSI-
precursors present a core of intermetallic tin-copper alloy (51%), and a shell containing SnO (10%) and SnO2 (39%) at the outer
surface in good agreement with the HAADF-STEM and EDS analyses.
Figure 8. 119Sn Mössbauer spectra recorded at room temperature (a) and 4.2 K
(b) of Sn-Cu alloy synthesized with TFSI- precursors. Dots represent the
observed experimental data and solid lines the calculated spectra with three distinct components associated with tin-copper intermetallic phase and tin(II) or tin(IV) oxide. Insets: distributions of the quadrupole splitting parameter.
Table 2. Refined 119
Sn Mössbauer hyperfine parameters of tin-copper alloy NPs synthesized in [EMIm+][TFSI-].
δ (mm.s -1) Δ (mm.s -1) Γ (mm.s -1) Rel. area (%) 293 K η’-Cu6Sn 5-xx SnO SnO2 2.09(2) 2.96(2) 0.06(2) 0.70* 1.55(5) 0.72* 0.90(-) 0.99(5) 0.90(-) 47(3) 7(3) 46(3) 4.2 K η’-Cuxx 6Sn 5-SnO SnO2 2.19(2) 3.07(3) 0.11(3) 0.76* 1.55(5) 0.66* 0.90(-) 0.96(3) 0.90(-) 51(3) 10(3) 39(3)
δ: isomer shift (rel. to BaSnO3) ; Δ: quadrupole splitting ; Γ: Lorentzian linewidth
; * mean value of the quadrupole splitting distribution
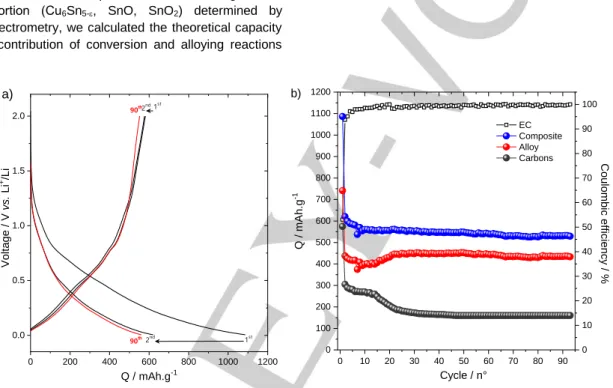
Concerning the electrochemical properties of Cu6Sn5, the
theoretical capacity associated with lithium insertion for the stoichiometric compound is 605 mAh.g-1. According to Larcher et
al[40], the electrochemical mechanism of bulk ’-Cu
6Sn5 proceeds
via three types of lithium insertion reactions related to (i) a solid solution behavior, (ii) a partial extrusion of Cu leading to Li2CuSn
7
and (iii) a complete extrusion of Cu ultimately leading to the lithium rich phase Li22Sn5. During the latter, Choi et al [41] showed that the
reaction was limited to the Li7Sn2 composition. In bulk phases,
steps (ii) and (iii) were associated to plateau region occurring at 0.4 and 0.1 V, respectively.
The electrochemical properties of Cu6Sn3.31.7 were assessed
using galvanostatic discharge/charge experiments (Figure 9a). The discharge/charge curves were obtained by cycling Cu6Sn3.31.7 electrode against metallic lithium under 100 mA.g-1
within the voltage range 0.05-2.0 V. The first discharge curve featured a sloping curve with a lack of plateau region and a capacity of 1086 mAh.g-1 largely exceeding the theoretical value.
These two aspects were commonly observed for nanosized Cu6Sn5 with the extra capacity assigned to an irreversible
conversion process of SnOx phases.[42–45] According to the
phase’s proportion (Cu6Sn5-, SnO, SnO2) determined by
Mössbauer spectrometry, we calculated the theoretical capacity including the contribution of conversion and alloying reactions
from SnOx phases. This led to a value of 967 mAh.g-1 close to that
found for the firstdischarge (Table S2). During the first charge, a capacity of 576 mAh.g-1 was obtained. Moreover, most of this
capacity was obtained within the low voltage region (<1V) which is characteristic of alloying processes, hence ruling out the contribution of conversion reactions in the overall lithiation mechanism.[46,47] Upon cycling, a stable capacity of 530 mAh.g-1
was maintained after 90 cycles. In the used electrode formulation, a large content of carbon was added that partially contributed to the overall capacity. To account for this contribution, we subtracted it leading to a capacity close to 400 mAh.g-1 (Figure
9b). This capacity value remained, however, lower than expected for a full utilization of the Sn matrix (Table S2) suggesting that some Sn were inactive probably those embedded in a Li2O matrix.
Figure 9. a) Galvanostatic discharge-charge curves of Cu6Sn3.31.7 electrodecycled vs. Li+/Li. b) Evolution of the capacity as a function of cycle number for
Cu6Sn3.31.7 electrode with and without the capacity contribution of carbon additive.
Conclusion
A direct synthesis of Sn and Sn-Cu alloy was developed by using metallic precursors and ionic liquid sharing the same anionic group that is TFSI-. This approach enabled to avoid side impurities
typically encountered using chloride precursors and allowed to stabilize alloys. NMR relaxometry of 1H (cation) and 19F (anion)
further showed that NPs are surrounded by a first shell of neighbor constituted by cations of the IL. Using TFSI- precursor,
we successfully prepared Sn-Cu alloy as opposed to the chloride-salt route which led to the precipitation of monometallic phases. This difference in reactivity was investigated by means of cyclic voltammetry measured on a solution containing different stoichiometries of Sn:Cu with the reduction potential (Gibbs energy) varying depending on the cation concentrations. The structure of the precipitated Sn-Cu alloy was investigated using PDF showing that it crystallized in the ’ polymorph with Sn deficiency, i.e., the composition determined by structural analysis was Cu6Sn3.31.7, which was further confirmed by EDX analysis.
Mössbauer spectrometry allowed us to assert the occurrence of
SnOx phases located at the outer shell of the nanoparticles. The
lithium insertion properties was assessed by galvanostatic cycling with a sloping voltage profile characteristic of NPs. The reversible capacity was explained by considering an alloying process. Overall, this study demonstrated that the chemical system used is an effective route for the preparation of alloys and can be certainly extended to other elements.
Experimental Section
The synthesis of Sn-based compounds was performed following a published protocol.[11,48] All operations were performed in a glove box filled
with argon (H2O and O2 content < 1 ppm). For the synthesis of metallic
Sn, a 40mM solution of SnCl2 (99%, Alfa Aesar) or Sn(TFSI)2 (Alfa Aesar)
was prepared by dissolving the salt in 1 mL of [EMIm+][TFSI−] (99.5%,
Solvionic). The reduction of Sn was initiated by mixing the Sn(II) solution and a 400 mM of NaBH4 in 1 mL of [EMIm+][TFSI−] solution. For the
synthesis of Cu-Sn alloy, a nominal composition of Cu6Sn5 was targeted.
A 40 mM solution of Sn(TFSI)2 and Cu(TFSI)2 (Alfa Aesar) was prepared
by dissolving cationic precursors in the targeted stoichiometry, in 1 mL of
0 200 400 600 800 1000 1200 0.0 0.5 1.0 1.5 2.0 2 nd1st V ol tage / V vs. Li +/Li Q / mAh.g-1 90th 90th2nd 1st a) 0 10 20 30 40 50 60 70 80 90 0 10 20 30 40 50 60 70 80 90 100 EC Composite Alloy Carbons C oul ombi c ef fici ency / % Q / m A h. g -1 Cycle / n° b) 0 100 200 300 400 500 600 700 800 900 1000 1100 1200
8
[EMIm+][TFSI−]. After the addition of a 400 mM of NaBH
4 in 1 mL of
[EMIm+][TFSI−] solution, the mixture was stirred at room temperature for
six hours. The powder was separated from the IL by centrifugation and then washed with acetone and water.
X-ray diffraction pattern were measured using a Rigaku Ultima IV X-ray diffractometer with a Cu Kα radiation (λ= 1.54059 Å) with a scan rate of 0.1°min-1 between 10° and 80° (2θ).
The measurements of the 1H and 19F nuclear magnetic resonance (NMR)
relaxation rates R1=1/ T1 have been carried out on a Stelar Spinmaster
Fast Field Cycling (FFC) relaxometer. In this case, only R1 has been
measured using a pre-polarized (PP) sequence from 10 kHz to 8 MHz and a non-polarized (NP) sequence from 10 MHz to 30 MHz.[49] The
parameters used for the experiments were the following: 90° RF pulse duration: 8.5 (9.5) µs, the acquisition frequency: 15.8 MHz, for 1H (19F)
relaxation measurements. The recycle delay between two consecutive acquisitions was set to fivefold the longest spin-lattice time at the highest relaxation field, the polarization time was set to fourfold the spin–lattice time at 25 MHz (referring to the 1H resonance frequency). Magnetization
values were recorded for 16 logarithmically spaced values of evolution times; in the whole frequency range, the evolution of magnetization was monoexponential within experimental error. The temperature value was set at 233K and checked before and after measurements to ensure a stability of ± 0.5 K.
The high-angle annular dark field scanning transmission electron microscopy (HAADF-STEM) and simultaneously acquired energy-dispersive X-ray spectroscopy (EDX) elemental mapping analysis was performed on a JEM ARM200F cold FEG probe and image aberration corrected electron microscope operated at 200 kV and equipped with a large solid-angle CENTURIO EDX detector. TEM sample was prepared by crushing of material in agate mortar, dispersed in ethanol and following transferring suspension to a Ni holey carbon grid.
Cyclic voltammetry (CV) curves were recorded at 0.5 Vs-1 in the
potential range of -0.6 and +0.4 V vs. Sn2+/Sn. All electrochemical
measurements were performed in a glove box filled with argon (H2O and
O2 content < 1 ppm). A three-electrode electrochemical cell controlled by
a potentiostat (PAR 273A) was used. Mo (A = 0.503 cm²) foils was used as working electrode. The counter electrode was a Pt wire and a Sn bar was used as reference electrode. For solutions containing tin and copper, a second compartment was used with a 10 mM solution of Sn(TFSI)2 to
ensure stable potential measurements.
High-energy X-ray data were collected at the 11-ID-B station at the Advanced Photon Source (Argonne National Laboratory) with an X-ray energy of 86.7 keV (λ=0.1430 Å). After corrections (background and Compton scattering), Pair Distribution Functions (PDFs), G(r) were extracted from the data using PDFgetX2 software.[50] Refinements of the
PDF data were performed using PDFgui,[51] with structural models from
ICSD (Inorganic crystal structure database) database.[52] Refined
parameters were the instrument parameters, the lattice parameters, the atomic positions, atoms rate occupancy and the scale factor. The coherence length was refined using the spherical particle size parameter (spdiameter). The difference between the experimental observation (data)
and the calculated values (model) correspond to the difference curve, which computes the quality of the refinement defined by the weighted R-factor noted Rw. The R-value describes the difference between the
experimental observation (data) and the calculated value (fit) for a single data point.
119Sn Mössbauer measurements were carried out using a constant
acceleration Halder-type spectrometer operating in transmission geometry with a room temperature 119mSn (CaSnO3) source (370 MBq). Thin
absorbers containing about 15 mg.cm-2 of Sn (119Sn natural abundance
8.59%) were placed into a liquid helium bath cryostat. Spectra were
recorded from room temperature down to 4.2 K, and the refinement of Mössbauer hyperfine parameters (δ isomer shift, Δ quadrupole splitting, Γ Lorentzian line width and relative areas) was performed using both homemade programs and the WinNormos software (Wissenschaftliche Elektronik GmbH).[53] The 119Sn isomer shifts are referenced to BaSnO
3 at
room temperature.
The electrochemical properties of Sn-based alloy were investigated against metallic lithium using CR2032-type coin cells. The electrode formulation, adapted from Kravchyk et al[54], was 30 wt.% of active
material, 45wt.% of carbon (1:1 mixture of Timcal®, super C-65), and 25 wt.% of carboxymethyl cellulose CMC (Aldrich, Mw = 250 000). The electrolyte was 1 M LiPF6 dissolved in a mixture of ethylene carbonate
(EC) and ethyl methyl carbonate (EMC) (1:1 vol. %) with 2%wt. of fluoroethylene carbonate (FEC). The cells were assembled in a glove box filled with argon (H2O and O2 content < 1 ppm) with lithium metal as the
anode and were cycled under 100 mA.g-1 in the voltage range of 2.0 – 0.05
V vs. Li+/Li.
Acknowledgements
This article is based upon work from COST Action CA15209 EURELAX ”European Network on NMR Relaxometry”, supported by COST (European Cooperation in Science and Technology). Labex Michem and labex Matisse are gratefully acknowledged for the financial support. The work done at the Advanced Photon Source, an Office of Science User Facility operated for the U.S. Department of Energy (DOE) Office of Science by Argonne National Laboratory, was supported by the U.S. DOE under Contract No. DE-AC02-06CH11357. The work done at the University of Warmia and Mazury in Olsztyn was financed by National Science Centre, Poland, grant number: UMO-2017/25/B/ST5/02348.
Keywords: Sn-Cu alloys, NMR relaxometry, cyclic voltammetry, ionic liquids nanoparticles, surface interactions, lithium-ion batteries
[1] X. Zheng, Y. Ji, J. Tang, J. Wang, B. Liu, H.-G. Steinrück, K. Lim, Y. Li, M. F. Toney, K. Chan, et al., Nature Catalysis 2019, 2, 55–61.
[2] K. D. Kepler, J. T. Vaughey, M. M. Thackeray, Journal of Power Sources
1999, 81–82, 383–387.
[3] M. H. G. Prechtl, P. S. Campbell, Nanotechnology Reviews 2013, 2, 577– 595.
[4] S. Wegner, M. Saito, J. Barthel, C. Janiak, Journal of Organometallic
Chemistry 2016, 821, 192–196.
[5] C. Dietrich, D. Schild, W. Wang, C. Kübel, S. Behrens, Zeitschrift für
anorganische und allgemeine Chemie 2017, 643, 120–129.
[6] M. Tułodziecki, J.-M. Tarascon, P. L. Taberna, C. Guéry, Electrochimica
Acta 2014, 134, 55–66.
[7] N. Soulmi, A.-G. Porras-Gutierrez, N. E. Mordvinova, O. I. Lebedev, C. Rizzi, J. Sirieix-Plénet, H. Groult, D. Dambournet, L. Gaillon, Inorg. Chem.
Front. 2019, 6, 248–256.
[8] B. C. M. Martindale, S. E. Ward Jones, R. G. Compton, Physical Chemistry
Chemical Physics 2010, 12, 1827–1833.
[9] L. L. Lazarus, C. T. Riche, B. C. Marin, M. Gupta, N. Malmstadt, R. L. Brutchey, ACS Appl. Mater. Interfaces 2012, 4, 3077–3083. [10] T. Liu, R. Vilar, S. Eugénio, J. Grondin, Y. Danten, J Appl Electrochem
2015, 45, 87–93.
[11] N. Soulmi, D. Dambournet, C. Rizzi, J. Sirieix-Plénet, M. Duttine, A. Wattiaux, J. Swiatowska, O. J. Borkiewicz, H. Groult, L. Gaillon, Inorg.
Chem. 2017, 56, 10099–10106.
[12] J. Polte, M. Herder, R. Erler, S. Rolf, A. Fischer, C. Würth, A.
F. Thünemann, R. Kraehnert, F. Emmerling, Nanoscale 2010, 2, 2463–2469. [13] E. V. Shevchenko, D. V. Talapin, A. L. Rogach, A. Kornowski, M. Haase, H.
Weller, J. Am. Chem. Soc. 2002, 124, 11480–11485.
[14] R. Kimmich, E. Anoardo, Progress in Nuclear Magnetic Resonance
9
[15] F. Fujara, D. Kruk, A. F. Privalov, Progress in Nuclear Magnetic Resonance
Spectroscopy 2014, 82, 39–69.
[16] Field-Cycling NMR Relaxometry, 2018.
[17] D. Kruk, A. Herrmann, E. A. Rössler, Progress in Nuclear Magnetic
Resonance Spectroscopy 2012, 63, 33–64.
[18] J.-P. Korb, Progress in Nuclear Magnetic Resonance Spectroscopy 2018,
104, 12–55.
[19] R. Kimmich, in NMR: Tomography, Diffusometry, Relaxometry (Ed.: R. Kimmich), Springer Berlin Heidelberg, Berlin, Heidelberg, 1997, pp. 125– 137.
[20] R. Kimmich, in NMR: Tomography, Diffusometry, Relaxometry (Ed.: R. Kimmich), Springer Berlin Heidelberg, Berlin, Heidelberg, 1997, pp. 102– 115.
[21] F. Martini, S. Borsacchi, M. Geppi, C. Forte, L. Calucci, J. Phys. Chem. C
2017, 121, 26851–26859.
[22] P. Levitz, M. Zinsmeister, P. Davidson, D. Constantin, O. Poncelet, Phys.
Rev. E 2008, 78, 030102.
[23] T. Zavada, R. Kimmich, J. Grandjean, A. Kobelkov, J. Chem. Phys. 1999,
110, 6977–6981.
[24] P. Levitz, Molecular Physics 2019, 117, 952–959.
[25] P. E. Levitz, Magnetic Resonance Imaging 2003, 21, 177–184. [26] F. Winter, R. Kimmich, Biophysical Journal 1985, 48, 331–335. [27] D. Kruk, E. Umut, E. Masiewicz, C. Sampl, R. Fischer, S. Spirk, C.
Goesweiner, H. Scharfetter, Phys. Chem. Chem. Phys. 2018, 20, 12710– 12718.
[28] P. H. Fries, E. Belorizky, J. Chem. Phys. 2015, 143, 044202.
[29] H. I. Mäkelä, O. H. J. Gröhn, M. I. Kettunen, R. A. Kauppinen, Biochemical
and Biophysical Research Communications 2001, 289, 813–818.
[30] A. R. Choudhury, N. Winterton, A. Steiner, A. I. Cooper, K. A. Johnson,
CrystEngComm 2006, 8, 742–745.
[31] P. K. Nayak, L. Yang, W. Brehm, P. Adelhelm, Angewandte Chemie
International Edition 2018, 57, 102–120.
[32] S. Fürtauer, D. Li, D. Cupid, H. Flandorfer, Intermetallics 2013, 34, 142–147. [33] A.-K. Larsson, L. Stenberg, S. Lidin, Acta Cryst B, Acta Cryst Sect B, Acta
Crystallogr B, Acta Crystallogr Sect B, Acta Crystallogr Struct Sci, Acta Crystallogr Sect B Struct Sci, Acta Crystallogr B Struct Sci Cryst Eng Mater
1994, 50, 636–643.
[34] A. Gangulee, G. C. Das, M. B. Bever, MT 1973, 4, 2063–2066. [35] S. J. L. Billinge, Physics 2010, 3.
[36] T. Egami, S. J. L. Billinge, Underneath the Bragg Peaks: Structural Analysis
of Complex Materials, Elsevier, 2003.
[37] E. Nordstrom, S. Sharma, E. Sjostedt, L. Fransson, L. Haggstrom, L. Nordstrom, K. Edstrom, Hyperfine Interact. 2001, 136, 555–560. [38] J. Silver, C. Mackay, J. Donaldson, J. Mater. Sci. 1976, 11, 836–842. [39] K. F. E. Williams, C. E. Johnson, J. A. Johnson, D. Holland, M. M. Karim, J.
Phys.: Condens. Matter 1995, 7, 9485–9497.
[40] D. Larcher, L. Y. Beaulieu, D. D. MacNeil, J. R. Dahn, J. Electrochem. Soc.
2000, 147, 1658–1662.
[41] W. Choi, J. Y. Lee, H. S. Lim, Electrochemistry Communications 2004, 6, 816–820.
[42] J. Wolfenstine, S. Campos, D. Foster, J. Read, W. K. Behl, Journal of Power
Sources 2002, 109, 230–233.
[43] S. Liu, Q. Li, Y. Chen, F. Zhang, Journal of Alloys and Compounds 2009,
478, 694–698.
[44] W. Cui, F. Li, H. Liu, C. Wang, Y. Xia, J. Mater. Chem. 2009, 19, 7202– 7207.
[45] R. Hu, G. H. Waller, Y. Wang, Y. Chen, C. Yang, W. Zhou, M. Zhu, M. Liu,
Nano Energy 2015, 18, 232–244.
[46] I. A. Courtney, J. S. Tse, O. Mao, J. Hafner, J. R. Dahn, Phys. Rev. B 1998,
58, 15583–15588.
[47] X. Liu, J. Zhang, W. Si, L. Xi, S. Oswald, C. Yan, O. G. Schmidt, Nanoscale
2014, 7, 282–288.
[48] S. L. Vot, D. Dambournet, H. Groult, A. Ngo, C. Petit, C. Rizzi, C. Salzemann, J. Sirieix-Plenet, O. J. Borkiewicz, E. Raymundo-Piñero, et al.,
Dalton Transactions 2014, 43, 18025–18034.
[49] E. Anoardo, G. Galli, G. Ferrante, Appl. Magn. Reson. 2001, 20, 365–404. [50] X. Qiu, J. W. Thompson, S. J. Billinge, Journal of Applied Crystallography
2004, 37, 678–678.
[51] S. Chaudhuri, P. Chupas, B. J. Morgan, P. A. Madden, C. P. Grey, Physical
Chemistry Chemical Physics 2006, 8, 5045–5055.
[52] F. Karlsruhe, URL http://icsd. fiz-karlsruhe. de. Acessed 2014, 12–12. [53] R. A. Brand, Universität Duisburg 2008.
[54] K. Kravchyk, L. Protesescu, M. I. Bodnarchuk, F. Krumeich, M. Yarema, M. Walter, C. Guntlin, M. V. Kovalenko, J. Am. Chem. Soc. 2013, 135, 4199– 4202.
10
Entry for the Table of Contents
The use of a chemical system consisting of an ionic liquid (IL: [EMIm+][TFSI−]) and metallic precursors based on TFSI- anionic groups
![Figure 2. Spin lattice relaxation rates, R1, as a function of the frequency for frozen (A) 1 H and (B) 19 F within neat [EMIm + ][TFSI − ] and (C) 1 H and (D) 19 F within -Sn in [EMIm + ][TFSI − ]](https://thumb-eu.123doks.com/thumbv2/123doknet/11559000.296879/4.892.131.784.374.954/figure-spin-lattice-relaxation-rates-function-frequency-frozen.webp)
![Figure 4. Cyclic voltammograms of [EMIm + ][TFSI − ] solution containing a) 25 mM Sn(TFSI) 2 or Cu(TFSI) 2 and b) 50 mM of Sn(TFSI) 2 and different content of Cu(TFSI) 2](https://thumb-eu.123doks.com/thumbv2/123doknet/11559000.296879/5.892.451.792.220.838/figure-cyclic-voltammograms-emim-solution-containing-different-content.webp)