EFFETS DE LA COMPÉTITION ET DE LA SAISONNALITÉ DES SÉCHERESSES SUR LA CROISSANCE RELATIVE DES SAPINS BAUMIERS
MÉMOIRE PRÉSENTÉ
COMME EXIGENCE PARTIELLE
DE LA MAÎTRISE EN SCIENCES DE L'ENVIRONNEMENT
PAR
ALEXANDA VILLIARD
UNIVERSITÉ DU QUÉBEC À MONTRÉAL Service des bibliothèques
Avertissement
La diffusion de ce mémoire se fait dans le respect des droits de son auteur, qui a signé le formulaire Autorisation de reproduire et de diffuser un travail de recherche de cycles supérieurs (SDU-522 – Rév.07-2011). Cette autorisation stipule que «conformément à l’article 11 du Règlement no 8 des études de cycles supérieurs, [l’auteur] concède à l’Université du Québec à Montréal une licence non exclusive d’utilisation et de publication de la totalité ou d’une partie importante de [son] travail de recherche pour des fins pédagogiques et non commerciales. Plus précisément, [l’auteur] autorise l’Université du Québec à Montréal à reproduire, diffuser, prêter, distribuer ou vendre des copies de [son] travail de recherche à des fins non commerciales sur quelque support que ce soit, y compris l’Internet. Cette licence et cette autorisation n’entraînent pas une renonciation de [la] part [de l’auteur] à [ses] droits moraux ni à [ses] droits de propriété intellectuelle. Sauf entente contraire, [l’auteur] conserve la liberté de diffuser et de commercialiser ou non ce travail dont [il] possède un exemplaire.»
J'aimerais d'abord remercier mon directeur Daniel Kneeshaw de m'avoir si bien guidé tout au long de cette aventure, de m'avoir poussé dans mes réflexions, mais aussi pour ton attitude positive et toujours encourageante.
J'aimerais remercier mon codirecteur Loïc D'Orangeville de m'avoir accordé autant de temps et d'aide d'abord dans mon apprentissage. de R, mais surtout avec mes analyses. Merci aussi de m'avoir accueilli à l'Université du New Brunswick, ce fut une expérience très enrichissante.
Merci à Daniel Houle et Louis Duchesne pour vos précieux conseils, ce fut grandement apprécié.
Un gros merci à mes assistants de terrain et de laboratoire Philippe Lepage Fortin, César Gabillot et Julia Meyer pour votre travail rigoureux et les longues journées. Je n'aurais pas pu demander mieux, vous avez été exceptionnel. ·
Merci à tous les membres du labo Kneeshaw présents au quotidien Chantal Moulin Vézina, Pierce McNie, Geneviève Lajoie, David Héon-Grenier, Marylou Meyer, Marion Germain et tous les autres pour vos conseils, votre écoute, mais surtout pour votre support moral extraordinaire. Vous êtes les meilleurs!
Merci aux professionnels du CEF, Mélanie Desrochers, Daniel Lesieur, Alain Leduc, Luc Lauzon et François Rousseu pour votre aide tout au long de mon parcours.
Merci à ma famille, ami(e)s et particulièrement à mes parents pour m'avoir toujours encouragé.
Un dernier remerciement spécial pour à la personne la plus importante de ma vie, Chloé Siân Mayer d'avoir été mon plus grand pilier dans toute cette aventure. Je suis extrêmement reconnaissante de ton support au quotidien. Je n'y serais pas arrivé sans toi.
LISTE DES FIGURES ... vi
LISTE DES TABLEAUX ... vii
LISTE DES ABRÉVIATIONS, DES SIGLES ET DES ACRONYMES ... viii
RÉSUMÉ ... ix
INTRODUCTION.~··· 1
0.1 Changements climatiques récents et prévisions futures ... 1
0.2 La sécheresse ... 1
0.3 Impacts du climat et des sécheresses sur les forêts ... 2
0.4 Importance de la forêt boréale ... 4
0.5 Le sapin baumier ... 4 0.6 Effet de la compétition ... 5 O. 7 Effet de décalage ... ... 8 0.8 But de l'étude ... 8 0.9 Objectif···'.··· 9 0.10 Hypothèses ... 9
CHAPITRE I STAND DENSITY, TREE SIZE AND TREE SOCIAL ST A TUS MODULATE BALSAM FIR'S GROWTH REDUCTION TO PREVIOUS YEAR'S DROUGHTS ... 10 1.1 Abstract ... 11. 1.2 Introduction ... 12 1.3 Methods ... 15 1.3.1 Study site ... 15 1.3.2 Sampling ... 15 1.3.3 Competition measurements ... 16
1.3.4 Dendrochronology ... ... 17
1.3.5 Drought Index ... 18
1.3.6 Statistical analysis ... 20
1.4 Results ... 22
1.4.1 Influence of the seasonality of droughts ... 22
1.4.2 Influence ofbiotic factors measured at the tree and stand level ... 24
1.5 Discussion ... 27
1.6 Conclusion ... ... 30
CONCLUSION ... 31
2.1 Rappel des objectifs et résultats importants ... 31
2.2 Limitations et améliorations ... 32
2.3 Recommandations ... 34
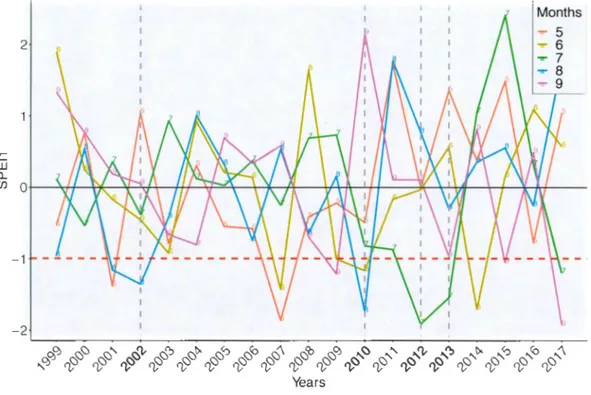
ANNEXE A Standardized Precipitation Evapotranspiration Index (SPEI) ... 35
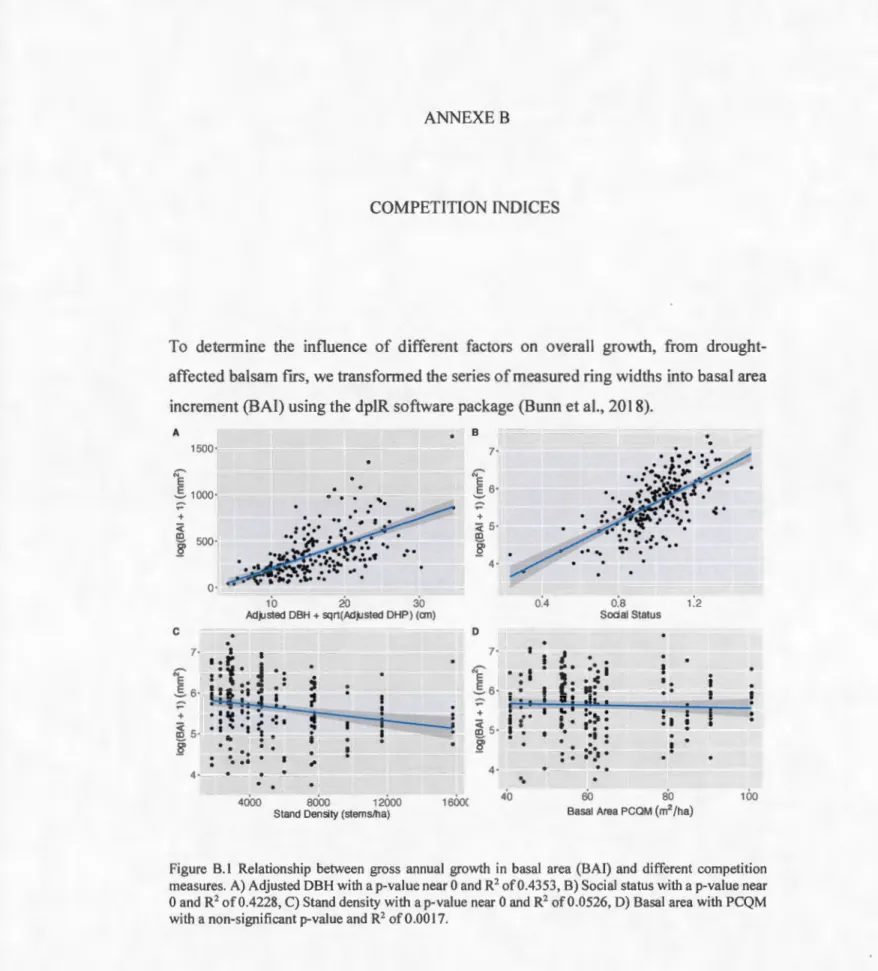
ANNEXE B Competiti.on indices ... 3 7 ANNEXE C Models considered ... 39
Figure Page
1. 1 Master chronology of standardized radial growths (RWI) by years.~... 18 1.2 Standardized Stream Flow Index values for all summer months (colored
lines) for the period of 1999 to 2017. ... ... ... ... 20 1.3 Prediction of standardized growth models by drought months. ... 24 1.4 Prediction of the R WI model according A) the social status, obtained by
dividing the height of a study tree by the average of all study tree heights from the same stand, where negative number are suppressed trees and positive number are dominant trees B) the adjusted DBH and C) the stand density, in post-drought years... 25 1.5 Predictions of the R WI model according to stand density and adjusted
DBH while considering the previous year's droughts A)°Natural stands B) PCTs ... 26 A.1 SPEI values for all summer months (colored lines) according to years ... 36 B.1 Relationship between gross annual growth in basal area (BAI) and
different competition measures... 37 B.2 Autocorrelations between certain competition measures ... 38 C.1 Quantile-q1:1antile diagram of the chosen model A) explaining growth of
Tableau Page
1.1 Linear mixed model parameter estima tes to exp Iain R WI variation in years of drought and the year following drought. ... ... ... 23 C.1 Potential linear mixed models tested with their respective AIC according
to whether they explain growth of the ·current year or the growth of the following year ... 40
ABA Acide abscissique
BAI Basal area increment (Accroissement surface terrière)
DHP Diamètre à hauteur de poitrine
EPC Éclaircie précommerciale
PET Potential evapotranspiration (Évapotranspiration potentielle)
R WI Ring width indices (Indice de croissance)
SPEI Standardized Precipitation Evapotranspiration Index (Indice de précipitations et d' évapotranspiration normalisé)
SPI Standardized Precipitation Index (Indice de précipitations normalisé)
Au cours des prochaines décennies, on anticipe que la forêt boréale canadienne sera encline à subir une perte de productivité et une augmentation du taux de mortalité en raison d'une hausse de température prévue, d'une baisse de contenu en eau du sol, mais surtout, d'une augmentation de la fréquence et de l'intensité des sécheresses. Malgré la littérature accessible à ce sujet, il reste encore beaucoup d'incertitude quant à la réponse des arbres à de tels événements climatiques en termes de croissance. Plus précisément, en quoi des facteurs biotiques comme le diamètre des arbres, leur statut social et la densité du peuplement, ainsi que des caractéristiques des sécheresses comme le moment où elles surviennent peuvent moduler cette réponse? En ce sens, l'objectif du présent mémoire est de déterminer l'influence des facteurs mentionnés sur la croissance relative des arbres, plus précisément du sapin baumier (Abies balsamea [L.] Mill.) face aux sécheresses. Le choix de l'espèce étudiée s'explique par son abondance, son importance commerciale, mais aussi par le fait qu'elle est particulièrement sensible aux sécheresses. Le site d'étude se situe dans le domaine bioclimatique de la sapinière à bouleau blanc, où plusieurs sécheresses sont survenues au cours des deux dernières décennies. Des sapins ont été carottés dans des peuplements présentant différentes intensités de compétition ( densité mesurée à l'échelle du peuplement). Les cernes de croissance ont été utilisés pour générer un indice de croissance relative permettant de quantifier la sensibilité des arbres aux moments où se produisent les sécheresses ainsi que sous différentes intensités de compétition'. Les résultats de l'étude indiquent que les sécheresses, surtout celles du mois d'août occasionnent une baisse de croissance relative des arbres l'année post sécheresse, ce qui témoigne d'un effet de décalage d'une saison entre le stress climatique et la réponse des sapins. Ce phénomène pourrait être dû aux sécheresses survenant lors de la formation des bourgeons. En considérant cet effet de décalage, la vulnérabilité des arbres diminue avec le statut social, mais augmente avec le diamètre des arbres ainsi qu'avec la densité du peuplement. De ce fait, malgré que les arbres soient tout de même vulnérables aux sécheresses dans des peuplements à faible densité, une réduction manuelle de la compétition via des traitements sylvicoles tels que l'éclaircie précommerciale pourrait favoriser une meilleure résistance aux sécheresses. Nous recommandons toutefois de futures études portant sur l'influence des éclaircies sur la vulnérabilité des arbres aux sécheresses et qui multiplieraient les sites et couvriraient de plus longues échelles de temps.
0.1 Changements climatiques récents et prévisions futures
En raison de la forte augmentation de gaz à effet de serre dans l'atmosphère depuis l'ère industrielle, la température moyenne en surface de la planète a augmenté de 0.85°C entre 1880 et 2012 (IPCC, 2013). À l'échelle mondiale, les prévisions d'augmentation de température d'ici la :fin du 21 e siècle varient entre 1.5 et 4.8 °C selon
les modèles (IPCC, 2013). Au Québec, les prévisions pour l'horizon 2090 consistent en des changements médians de températures moyennes en hiver et en été, respectivement de 5°C à 9°C et de 2°C à 3.5°C (Logan et al., 2011). Pour le même horizon, une augmentation des précipitations est aussi attendue de 25 à 45% en hiver et de O à 15% en été (Logan et al., 2011). Durant la saison de croissance, une très faible augmentation des précipitations, voir aucune, auquel ont ajoute une hausse marquée des températures, pourrait faire en sorte de réduire le contenu en eau du sol en raison d'une plus forte évapotranspiration (Houle et al., 2012). Plus précisément, une baisse de 20 à 40% du contenu en eau du sol durant l'été en forêt boréale est attendue en forêt boréale (Houle et al., 2012). En ce sens, une augmentation de la fréquence et de l'intensité des sécheresses est pressentie (Dai, 2011 ).
0.2 La sécheresse
De façon générale, une sécheresse se définit comme un événement climatique extrême durant lequel il y a un manque soutenu de précipitations sur une période de temps prolongée (Dai, 2011; Trenberth et al., 2014). Toutefois, la définition varie selon le
domaine de recherche, on peut retrouver les sécheresses météorologiques, les sécheresses agricoles et les sécheresses hydrologiques (Dai, 2011; Trenberth et al., 2014). En écologie forestière,· les concepts de sécheresses météorologiques et hydrologiques sont souvent utilisés, car la première considère directement le manque de précipitations souvent accompagnées de hausses de température et l'autre considère le débit de l'eau des rivières, qui lui dépend non seulement des précipitations et des températures, mais aussi du stockage en eau et de l' évapotranspiration des milieux forestiers (Dai, 2011; Trenberth et al., 2014 ). Pour quantifier l'intensité des sécheresses, il existe plusieurs indices (Svoboda and Fuchs, 2016). Certains d'entre eux comme le
Standardized Precipitation Evapotranspiration Index (SPEI), dans le cas des
sécheresses météorologiques, ou encore le Standardized Stream Flow Index (SSFI), dans le cas des sécheresses hydrologiques~ transforment les données en écart-type par rapport à la moyenne historique. Les plus forts écarts-types négatifs représentent les anomalies indicatrices de périodes de sécheresse par rapport à la moyenne historique.
0.3 Impacts du climat et des sécheresses sur les forêts
Le climat contribue à une multitude de phénomènes physiologiques et phénologiques chez les arbres. Par exemple, il influence directement la durée de la saison de croissance, la production de cellules annuelles, le début du bourgeonnement, etc. (Logan et al., 2011 ). Toutefois, lorsque surviennent des sécheresses, la croissance des arbres peut être négativement impactée selon deux mécanismes soit la défaillance hydraulique et le manque soutenu de carbohydrates (McDowell et al., 2006). D'abord, la défaillance hydraulique survient lorsqu'une augmentation de température entraîne une plus grande demande d' évapotranspiration des arbres (McDowell et al., 2006). L'évapotranspiration a pour effet d'augmenter la tension dans les colonnes d'eau du xylème, en tirant l'eau du sol jusqu'aux feuilles. Cependant, lorsque l'eau dans le sol est limitée, il arrive que la tension excessive engendre l'infiltration de bulles d'air dans les conduits du xylème. Cela crée des embolies qui limitent le transport de l'eau vers
les feuilles, ce qui engendre la dessiccation des cellules (McDowell et al., 2006). Pour se protéger de la défaillance hydraulique, certains arbres adoptent l' isohydrie comme mécanisme de défense. Certaines d'études on.t répertorié un comportement isohydrique chez des espèces de la forêt boréale comme le sapin baumier (Abies balsamea [L.] Mill.), l'aulne rugueux (A/nus rugosa (DuRoi) Spreng), le peuplier faux-tremble (Populus tremuloides Michx) (Ewers et al., 2007) ainsi que chez le mélèze d'Amérique (Larix laricina (Du Roi) K. Koch) (Pappas et al., 2018). L'isohydrie réfère aux arbres qui maintiennent le potentiel hydrique des feuilles lors de baisses de contenu en eau du sol ou sécheresses atmosphériques en fermant leurs stomates (Ewers et al., 2007). En fermant leurs stomates, les arbres isohydriques sont toutefois plus susceptibles au manque soutenu de carbohydrate (Allen et al., 201 0; Tardif et al., 2001; W alker et al., 2015). Ceci s'explique par une limitation des échanges gazeux ce qui réduit la photosynthèse et ainsi, l'assimilation de carbone (McDowell et al., 2006). À l'inverse, d'autres arbres adoptent l'anisohydrie comme une stratégie de défense contre le manque soutenu de carbohydrate et non la défaillance hydraulique. Un exemple d'espèce de la forêt boréale qui a adopté ce comportement est l'épinette noire (Picea Mariana (Mill.) B.S.P) (Pappas et al., 2018). L'anisohydrie réfère aux arbres qui ne. maintiennent pas leur potentiel hydrique des feuilles, en gardant leurs stomates ouverts (Ewers et al., 2007). Cette stratégie permet le maintien des activités photosynthétiques ainsi que l'accumulation des réserves de carbohydrates. Toutefois, garder les stomates ouverts lors de sécheresse rend les arbres anisohydriques plus susceptibles à la défaillance hydraulique (Allen et al., 2010). Donc chacune des stratégies présente un avantage pour une menace, mais également un désavantage pour l'autre. Ces deux stratégies de défenses n'étant pas donc infaillibles, dans les cas de sécheresses plus fréquentes ou soutenues, les désavantages ment~onnés peuvent nuire considérablement à la croissance des arbres et même mener jusqu'à leur mort (Allen et al., 2010; McDowell et al., 2008).
0.4 Importance de la forêt boréale
La forêt boréale est une des régions qui subira le plus grand changement de température au cours du prochain siècle (!PCC, 2013). Le Canada renferme 28% de la zone boréale mondiale qui comprend 307 millions d'hectares de forêts et de régions boisées (Gouvernement du Canada, 2017). Cela représente 75% de toutes les forêts et régions boisées du pays (Gouvernement du Canada, 2017). Ce biome contribue de façon significative à plusieurs services écosystémiques incluant le stockage de carbone, la purification de l'air et de l'eau ainsi que la régulation du climat (Gouvernement du Canada, 2017). En termes de maintien de la biodiversité, l'importance· de cette région est non négligeable, car elle sert d'habitat pour environ 20 espèces d'arbres, plus de 300 espèces d'oiseaux, 85 espèces de mammifères, 32 000 espèces d'insectes, 130 espèces de poissons, etc. (Fédération canadienne de la faune, 2006). D'un point de vue économique, l'industrie forestière canadienne, pour qui la forêt boréale constitue une source d'approvisionnement majeure, représentait 25.2 milliards de dollars ou 1.3% du PIB réel du Canada en 2016 (Ressources naturelles Canada, 2017).
0.5 . Le sapin baumier
Au Québec, une espèce abondante et économiquement importante de la forêt boréale est le sapin baumier. Elle est connue comme étant bien adaptée aux milieux froids et très humides (Burns and Honkala, 1990). En effet, la croissance optimale de cette espèce se produit dans des conditions où la température moyenne annuelle est entre 2°C et 4°C, les précipitations annuelles moyennes sont entre 760mm et.l lO0mm et où le nombre de jours de gel est en moyenne de 110 jours (Burns and Honkala, 1990). Toutefois, les conditions climatiques que l'on retrouve sur l'ensemble de l'aire de distribution de l'espèce peuvent être variables (Burns and Honkala, 1990). La température annuelle moyenne peut varier entre -4 °C et 7°C, alors que les
précipitations annuelles peuvent être entre 390mm et 1400mm sur toute la saison, ce qui signifie entre 150mm et 620mm lors de la saison de croissance (Burns and Honkala, 1990). Il s'agirait toutefois d'une espèce particulièrement sensible aux sécheresses en comparaison avec d'autres espèces arborescentes de la forêt boréale, comme par exemple l'épinette noire (Picea mariana (Mill.) (D'Orangeville et al., 2013).
0.6 Effet de la compétition
En période de sécheresse, plusieurs études ont observé que la compétition jouait un rôle majeur quant à la réponse des arbres au stress hydrique. En effet, une forte compétition lors de ce type d'événement climatique extrême aurait pour effet de réduire la croissance (Klos et al., 2009; Linares et al., 2009; Vilà-Cabrera et al., 2011) et dans certains cas, pourrait mener jusqu'à la mort des arbres (Bravo-Oviedo et al., 2006; Das et al., 2008; Galiano et al., 2010). La compétition entre les arbres peut être mesurée à deux échelles, soit à l'échelle du peuplement et à l'échelle de l'individu.
À l'échelle du peuplement, si l'on considère un milieu ouvert, où aucune resso~rce n'est limitante, un arbre va croître à son plein potentiel. Toutefois, dans un peuplement, les ressources sont partagées entre les individus. Le partage des ressources est modulé par la taille des arbres et la densité du peuplement (Bréda et al., 1995). Cette dernière change dans le temps et principalement lors d'un des stades de développements des peuplements,.soit le stade d'exclusion des tiges (Oliver et al., 1996).
Sùite à une perturbation majeure, Oliver et al. (1996) décrient quatre stades de développement soit, le stade d'initiation, d'exclusion des tiges, de réinitiation du sous-étage et de vieille forêt (Oliver et al., 1996). C'est au stade d'exclusion des tiges que l'on retrouve un vaste gradient de densité, où la densité diminue dans le temps. D'abord, ce stade commence au moment où la canopée se ferme (Oliver et al., 1996; Peet and Christensen, 1987). À ce moment, tout l'espace est occupé ce qui fait que de nouveaux
arbres ne peuvent s'établir. À la moindre petite perturbation, les arbres les plus vigoureux vont empiéter sur l'espace des plus faibles et s'accaparer les ressources telles que l'eau, les nutriments et la lumière (Oliver et al., 1996). Ceci fait qu'avec le temps, les arbres moins vigoureux finissent par mourir alors que les plus vigoureux continuent à s'établir et deviennent plus grands et plus gros (Oliver et al., 1996). L'éclaircissement naturel persiste ainsi en réduisant la densité du peuplement jusqu'à ce que les arbres ayant gagné la compétition deviennent matures (Oliver et al., 1996). Aussi, pour une hauteur donnée, une plus grande densité implique une plus grande surface foliaire associée au peuplement et à un plus grand volume de cime ce qui aurait pour effet d'augmenter l'évapotranspiration en période de sécheresse. Cette forte évapotranspiration diminuant le contenu en eau du sol ferait en sorte que moins d'eau est disponible pour les arbres dans ces peuplements (Bréda et al., 1995).
Dans un contexte de sylviculture, certains traitements sont utilisés pour réduire manuellement la densité et ainsi réduire la compétition à l'échelle du peuplement (McDowell et al., 2003; Puettmann, 2,011). L'application des traitements d'éclaircie se fait généralement au stade d'exclusion des tiges en sélectionnant les espèces d'intérêt commercial ainsi que les arbres qui semblent les plus vigoureux et en coupant les autres (Ministère des Forêts de la Faune et des Parcs, 2002). Cela a pour effet de laisser plus de place aux arbres restant pour croître. Dans le monde de l'industrie forestière québécoise, un des traitements utilisés est l'éclaircie précommerciale (EPC). Ce type d'intervention a déjà été utilisé dans le passé pour tenter de mitiger l'effet des changements climatiques sur les arbres. En effet, certaines études ont noté une diminution de la vulnérabilité des arbres (Brooks and Mitchell, 2011; Cescatti and Piutti, 1998; Giuggiola et al., 2013; Kohler et al., 2010; Le Goff and Ottorini, 1993; McDowell et al., 2007; Sohn et al., 2013), alors que d'autres n'ont constaté aucun effet (Trouvé et al., 2017). Il pourrait être opportun d'utiliser ce type de traitement à l'intérieur d'un design expérimental pour obtenir des gradients de densité qui
permettrait d'observer l'effet de la compétition sur la croissance des arbres en période de sécheresse.
À l'échelle de l'individu, chaque arbre entre en compétition avec leurs voisins immédiats pour les ressources telles que l'eau, les nutriments et la lumière. Le statut social d'un arbre par rapport à ses voisins peut être utilisé comme une mesure de compétition (Linares et al., 2009; Peet and Christensen, 1987). Ce statut social peut être caractérisé par la hauteur relative entre un arbre et ses voisins par exemple (Biging and Dobbertin, 1992; Ministère des Forêts de la Faune et des Parcs, 2015). À cette échelle, ceux qui sont opprimés subissant déjà le stress de la compétition et si en plus l'eau est limitée dû aux sécheresses, ces arbres subissent donc potentiellement un double stress.
Un~ autre façon d'évaluer la compétition à l'échelle de l'individu est via le diamètre des arbres. De façon générale, plus un arbre est gros, plus il aura une large couronne, ce qui augmente sa surface foliaire, sa capacité photosynthétique et son assimilation de carbone. Toutefois, avoir une large couronne implique aussi une plus grande structure à supporter et plus de ressources nécessaires pour le métabolisme. Avec la taille de l'arbre, augmente aussi la distance que l'eau doit parcourir pour se rendre jusqu'aux feuilles (Ryan and Y oder, 1997). À l'inverse, en termes de croissance, les petits arbres seraient désavantagés par une plus petite couronne et un plus petit système racinaire. Dans un contexte où l'eau est limitée, les résultats de certaines de ces études sont en opposition à savoir lesquels entre les gros (Martin-Benito et al., 2008; Merlin et al., 2015) et les petits arbres (Zang et al., 2012) sont les plus sensibles aux événements climatiques extrêmes que sont les sécheresses.
0.7 Effet de décalage
Üne absence de cohérence entre ces résultats face l'effet de la compétition sur la réponse des arbres aux sécheresses serait potentiellement due à la période d'observation relative à la saisonnalité des sécheresses. En effet, certaines études (Anderegg et al., 2013; Anderegg et al., 2015; Babst et al., 2012; Granier et al., 2007; Peltier et al., 2016) ont constaté un effet de décalage entre le moment où surviennent les sécheresses et la réponse associée des arbres en termes de croissance. À titre d'exemple, l'étude de Granier et al. (2007) porte sur la réponse de plusieurs espèces d'arbres à la sécheresse de 2003 en Europe. En étudiant la croissance des cernes, ils ont constaté une plus grande perte de croissance en 2004 comparée à 2003. Les études ayant documenté cet effet de décalage ont émis plusieurs hypothèses pour tenter d'expliquer ce phénomène concernant la saisonnalité des sécheresses, l'épuisement des réserves en carbohydrates ou encore, une défoliation potentielle (Anderegg et al., 2013; Bréda et al., 2006). Donc dans un contexte où l'on veut évaluer l'impact de la compétition sur la croissance des arbres face aux sécheresses, nous concevons qu'il est primordial de considérer la réponse des arbres l'année des sécheresses, mais également la réponse de l'année suivante.
0.8 But de l'étude
Le premier objectif de cette étude est d'abord de déterminer l'influence de la compétition sur réponse d'une espèce d'arbre très abondante au Québec, le sapin baumier, aux sécheresses récentes. Plus précisément, la compétition est mesurée à l'échelle du peuplement via la densité des tiges et à l'échelle de l'individu via le diamètre des arbres et leur statut social. Ensuite, de cibler l'influence de la saisonnalité de ce type d'événement climatique extrême sur la croissance radiale annuelle relative du sapin. Pour ce faire, des peuplements ont été sélectionnés selon un gradient de
densité à la forêt Montmorency. Le diamètre à hauteur de poitrine (DHP) des arbres études ainsi que leur hauteur et la densité du peuplement ont été mesurés. Les arbres études ont été échantillonnés dans le but de mesurer et d'analyser les cernes de croissance. Les données de débit à l'exutoire, entre 1999 et 2017, d'un bassin versant sur le site de la forêt ont été utilisées afin de générer un indice de sécheresse. Cette étude est importante, car elle permet de mieux comprendre la réponse du sapin à un type événement climatique extrême dont l'intensité et la fréquence ne vont qu'augmenter. De plus, elle informe davantage sur l'opportunité d'utiliser un traitement sylvicole comme l'EPC pour tenter de mitiger l'impact des changements futurs sur la forêt boréale.
0.9 Objectif
Dans un contexte de changements climati_ques, l'objectif est de déterminer comment la compétition ainsi le moment où se produit une sécheresse influencent la réponse du sapi~ baumier aux sécheresses. Nous posons donc la question: quelle est l'influence de la compétition mesurée à l'échelle de l'individu et du peuplement ainsi que de la saisonnalité sur leur vulnérabilité aux sécheresses?
0.10 Hypothèses
D'abord, nous pensons que les arbres ayant un plus petit DHP seront plus vulnérables aux sécheresses et que cette vulnérabilité augmentera avec la densité du peuplement. En ce sens, nous pensons que l'utilisation des EPC, en réduisant la compétition, pourrait rendre les arbres plus résistants aux sécheresses. Ensuite, nous pensons que les sécheresses, principalement celles en fin de saison estivale, vont avoir un effet négatif sur la croissance de l'année suivante et que cette réponse sera d'autant plus importante chez les arbres opprimés.
STAND DENSITY, TREE SIZE AND TREE SOCIAL STATUS MODULATE BALSAM FIR'S GROWTHREDUCTION TO PREVIOUS YEAR'S
DROUGHTS
1 2 1 3 4
Alexandra VILLIARD , Loïc D'ORANGEVILLE , Daniel HOULE • • , Louis DUCHESNE4 et Daniel KNEESHA W 1
1Département des sciences biologiques et Centre d'étude de la forêt, Université du
Québec à Montr~al, Montréal, H2X 3Y7, Canada
2 Faculty ofForestry and Environmental Management, University of New Brunswick,
Fredericton, E3B 5A3, Canada
3Ouranos, Consortium sur le réchauffement climatique, Montréal. HJA 1B9, Canada
1.1 Abstract
The boreal forest represents 75% of Canada's woodland and will experience the greatest warming of all forest ecosystems, along with a marked increase in the frequency and intensity of drought. Tree vulnerability to such events is expected to vary according to many parameters related to droughts characteristics, stand factors and tree attributes. However, we still lack sufficient knowledge on the relative importance of each of these factors, specifically the stand density, tree diameter and their position in the canopy and the timing of droughts. The objective of this study is to determine the influence of each of these factors on the vulnerability of a boreal species considered intolerant to drought, balsam fir (Abies balsamea [L.] Mill.). This study was conducted in a wet boreal forest of Eastern Canada, where several drought anomalies have been observed over the last two decades. W e assessed individual tree growth response to recent drought events across a large gradient of stand densities using a dendrochronological approach. The largest growth declines WGre related to drought events occurring in August of the prior-year. Through this lag effect, we observed decreased resistance to drought in suppressed trees and in larger trees in dense stands. In this sense, although it is not a one-size fits all solution, density reductions through sylvicultural treatments like thinning, while considering the position in the canopy, could help reduce the vulnerability of large trees to droughts by increasing resource availability.
1.2 Introduction
Climate warming is expected to decrease soil moisture by 20-40% in boreal forests of Eastern Canada by the end the century (Houle et al., 2012). These predictions are consistent with an expected increase in the frequency and intensity of droughts (Dai, 2011 ). This type of extreme event will inevitably have major consequences on tree productivity, such as a potential decline in southern boreal forests (D'Orangeville et al., 2016).
Amongst the complex set of factors influencing tree vulnerability, competition has been identified as having a potentially significant role in tree response to droughts, where high competition during drought has been widely linked to growth reductions (Klos et al., 2009; Linares et al., 2009; Vilà-Cabrera et al., 2011 ), and in extreme cases to mortality (Bravo-Oviedo et al., 2006; Das et al., 2008; Galiano et al., 2010). Despite many studies showing a drought-competition relationship, Floyd et al. (2009) did not observe an interaction. Generally, higher stand density implies a higher leaf area index and evapotranspirative demand. This causes a decrease in the water content in soil and increases the risk of a water deficit (Bréda et al., 1995).
Sorne studies have used silvicultural treatments to manually reduce stand density, thereby reducing competition and increasing the access of the remaining trees to resources including water, nutrients and light (McDowell et al., 2003; Puettmann, 2011 ). Although, results showing mitigation of the impact of droughts through this type of silvicultural treatment are common (Brooks and Mitchell, 2011; Cescatti and Piutti, 1998; Giuggiola et al., 2013; Kohler et al., 2010; Le Goff and Ottorini, 1993; McDowell et al., 2007; Sohn et al., 2013), they are not unequivocal (D'Amato et al., 2013; Lagergren et al., 2008; Trouvé et al., 2017). D'Amato et al. (2013)'s results suggest that density reduction promotes resistance and resilience of trees to droughts
but endangers large trees due to greater physiological needs which makes them more vulnerable.
In this sense, the social status of a tree, in terms of its position in the canopy, can modulate its growth response in the context of drought where each tree competes against its neighbors for ~esources (Linares et al., 2009; Peet and Christensen, 1987). However, the influence of tree's social status on its vulnerability to droughts is still unclear as Liu and Muller (1993) observed. a higher vulnerability in dominant and codominant trees, potentially due to the vertical microenvironment, whereas Pichler and Oberhuber (2007) noted that suppressed trees were more vulnerable. The effect of tree diameter on growth during drought has also been observed in several studies (Martin-Benito et al., 2008; Merlin et al., 2015). These studies demonstrate that bigger Scots pine (Pinus sylvestris (L.)) and black pine (Pinus nigra (Am)) trees were more vulnerable to drought, possibly due to hydraulic limitation (Ryan et Yoder, 1997). In large trees, for water to be transported to the leaves, it must travel a greater distance than in smaller trees. Due to the increase in resistance, there is greater tension in the water columns of the xylem and this causes a greater risk of cavitation and thus a greater risk of hydraulic failure. In contrast, the study of Zang et al. (2012) on Norway spruce (Picea abies (L.)) and Scot pine concluded that small trees are more vulnerable, potentially due to a smaller root system and to greater impacts of intraspecific competition. Finally, also working on Norway spruce and Scots Pine, Mérian and Le bourgeois (2011) did not observe any effect of tree diameter on tree growth during drought.
The lack of consistent observation of growth response to drought as a fonction of competition may in part be due to the period of observation relative to the timing of the mo isture stress. ln this sense, D' Orangeville et al. (2018) o bserved, in northeastern North America, a negative effect of drought on tree growth of the same year, mainly
when droughts occur at the beginning of the growing season. However, when droughts occur towards the end of the growing season, this tends to reduce growth the following year (Babst et al., 2012; D'Orangeville et al., 2018; Kannenberg et al., 2019). This phenomenon was also observed by D'Orangeville et al. (2013) in a cold-humid boreal forest which are con'sidered to be just as sensitive to droughts as drier forests (Choat et al., 2012). ln this sense, Fritts (1978) states that if the drought occurs during bud formation, towards the end of the summer, this could lead to a reduction in the number of needles contained in the buds. This would reduce photosynthetic activity and thus reduce carbon uptake and water exchange, which would result in a xylem with a smaller demand for resources during the post-drought year (Bréda et al., 2006). Therefore, to evaluate growth response to drought as a fonction of competition, we argue that is critical to consider both current year and lagged responses.
ln summary, there are reasons to believe that stand density, tree social status, diameter and the timing of droughts all contribute to tree vulnerability to droughts. However, the equivocal nature of the observations on the influence of these factors highlights our limited knowledge on how tree growth 1s modulated by biotic factors following drought. ln the context of climate change, forest management could contribute to mitigating threats to the boreal forest (Gauthier et al., 2015). A better understanding of which factors could be optimized during silvicultural interventions, such as thinning, is needed to reduce the vulnerability of trees to droughts. The objectives of this study are 1) to determine the effect of stand density, tree social status and diameter on the sensitivity of balsam fir's radial growth to drought, 2) to determine the effects of drought timing on the reduction in tree growth. First, we expect that vulnerability to drought will be greater for smaller trees as stand density increases. Secondly, we expect that droughts occurring at the end of the growing season will negatively impact on radial growth the following year and this response will be greatest in small, suppressed trees in dense stands.
1.3 Methods 1.3.1 Study site
The study was conducted in the Montmorency Forest, located approximately 70 km north of Quebec City (47°19'41 "N, 71 °07'37" W, 771-864m above sea level). This forest is dominated by balsam fir with some white spruce (Picea glauca (Moench) Voss) and white birch (Betula papyrifera Marsh. ). The soil drainage of these forest stands is usually mesic or subhydric. Characterized by a continental subarctic climate, the average annual temperature in the forest hetween 1966 and 2017 was 0.4°C, while the average maximum temperature in summer was l 7.5°C. The annual average precipitation forthis same period was 1484 mm, while it was 644.4 mm in the summer. At the same location, Isabelle et al. (2020) observed-that precipitations was not the factor limiting evapoiranspiration. In fact, the quantity of precipitations is approximately three times the amount of evapotranspiration. In addition, over the last two decades, the summers of 2002, 2010, 2012 and 2013 were listed as the driest between 1960 and 2013 (Houle et al., 2016).
1.3.2 Sampling
To evaluate the effect of stand density on tree response to drought, we selected 19 stands along a density gradient, from stands with low density (1800 stems/ha) to high density stands (15778 stems/ha). 14 stands were natural, while 5 had a densio/ modified by precommercial thinning (PCT). The latter is a silvicultural treatment that aims to reduce stand density and to conserve species of commercial interest (Ministère des Forêts de la Faune et des Parcs, 2003). The thinning took place in 1989, 1992, 1995, 1997 and 2000. This helps to see if. a manual reduction in density has the same effect on trees as an equivalent natural density.
To isolate the effect of competition, specifically stand_ density, tree diameter and tree · social status, we sought to control for other non-biotic factors such as slope and soil type. The stands were selected using ecoforest maps and validated in the field. The criteria used during the survey were the density class, the age of the stands, where the approximate age varies between 30 and 70 years, as well as a mesic drainage.
Sixteen of the 19 stands were sampled using three plots, while the remaining 3 stands had two because of a lack of density homogeneity. Between the plots, a minimum of 20 meters was established. In terms of size, plots in dense stands were 5 meters by 15 meters (75 m2), whereas those in less dense stands were 5 meters by 20 meters (100 m2). Smaller plots in dense stands would minimize stems counting errors. At the tree level, in each plot we systematically selected seven living firs taking into account the total number of firs. Trees less than 2.5 meters were considered as seedling and saplings. Since this study is focusing on mature trees, we rejected non mature trees from the count. For each target tree, the diameter at breast height (DBH) Çat 1.3m height from the ground) was measured using a DBH ribbon. The total height of each study tree was also measured with
a
Vertex.1.3.3 Competition measurements
In terms of competition, social status of study trees referring to their position in the canopy, diameter of study trees and stand density were used. More specifically, we considered the height of a study tree divided by the average of all study tree heights from the same stand as a measure that reflect the tree social status. This procedure determines the dominance of a study tree compared to other study trees from the same stand (Biging and Dobbertin, 1992; Ministère des Forêts de la Faune et des Parcs, 2015). Trees with a negative height ratio are considered as suppressed, whereas those with a positive height ratio are considered as dominant. Although there is a potential correlation betwèen DBH and tree social status, some suppressed trees can have bigger DHB than other, since the social status of a tree reflects its access to light and its
potential vigor, whereas DHB may be a reflection of a tree's overall resource use and evapotranspirative structures. Therefore, they do not evaluate the same thing. Finally, the density at the stand scale is the number of living trees per plot transformed into stem numbers per hectare and averaged at the stand. All measurements were collected in 2018. Note that initially, we·considered the use of other indices of competition such as at the stand level. To sample and calculate the basal area at the stand level, we used Mitchell (2010)' s Point Centered Quarter Method (PCQM). When collecting data, we considered neighboring trees <9.1 cm ofDBH which invalidated our data (Figure B.1 E).
1.3.4 Dendrochronology .
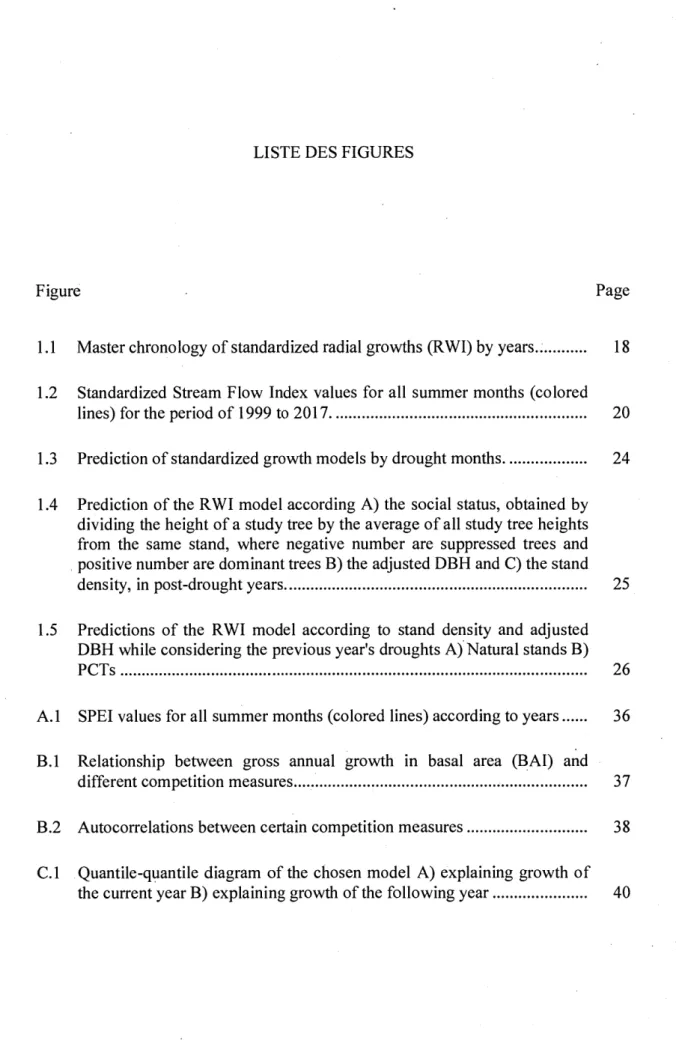
To reconstruct the historical annual growth of the trees, cores were taken using a Pressier auger. Two cores in opposite directions (north-south) were taken for each study tree at breast height. For trees with a very small diameter, a disk was eut at stump height (0.3m high from the ground). For these samples, two radii with à minimum of 90° between them were selected. The samples were dried and then the cores were glued on moldings as support. AU samples were sanded to clearly see the growth rings. They were then scanned to obtain high resolution photos. Using CoRecorder software, ring widths were measured. The crossdating of series of measurements for the years 1999 to 2017 was first performed visually and then validated using COFECHA software (Holmes, 1983). Growth series that could not be verified were discarded. In the end, the growth series of 24 7 trees were kept. For each tree, an · average was calculated between the growth ring widths of the same year to have only one series. To determine the influence of the various factors on the variation in the growth of balsam fir subjected to droughts from 1999 to 2017, it was necessary to con vert the sets of absolute ring widths into series of ring width indices (RWI), which led us to build our master chronology (Figure 1.1 ). The RWI is a dimensionless index that indicates the change in annual growth in relation to the average growth over the time period studied. To obtain this index, we standardized the ring widths with a spline, as this method
removes the long-term signais of age-related growth and competition (Bunn et al., 20 18). 1.2 3: a:
j1.ot----~
..c 'o Ol Ca:
0.8 YearsFigure 1.1 Master chronology of standardi zed radial growths (R WI) by years. The red line is the average of ail seri es, the grey ribbon represent the standard deviation and the dashed gray lines represent the years of drought previously identified by Houle et al.(20 16). Even though there is a considerable growth decline in 2006, it has been attributed to a short heat stress episode (Duchesne and Hou le, 20 11 ).
l.3.5 Drought
r
ndexWe used several indices to determine years of drought, including the Standardized Stream Flow Index (SSFI) and the Standardized Precipitation Evapotranspiration Index (SPEI) (Figure A. I ). SSFI was introduced by Modarres (2007) and developed by Telesca et al. (2012). Jt is an index that considers stream flow data at the outlet of a watershed, whereas SPEI considers precipitations and potential evapotranspiration (PET). Both indices can give monthly drought va lues, but the advantage of the SSFI is
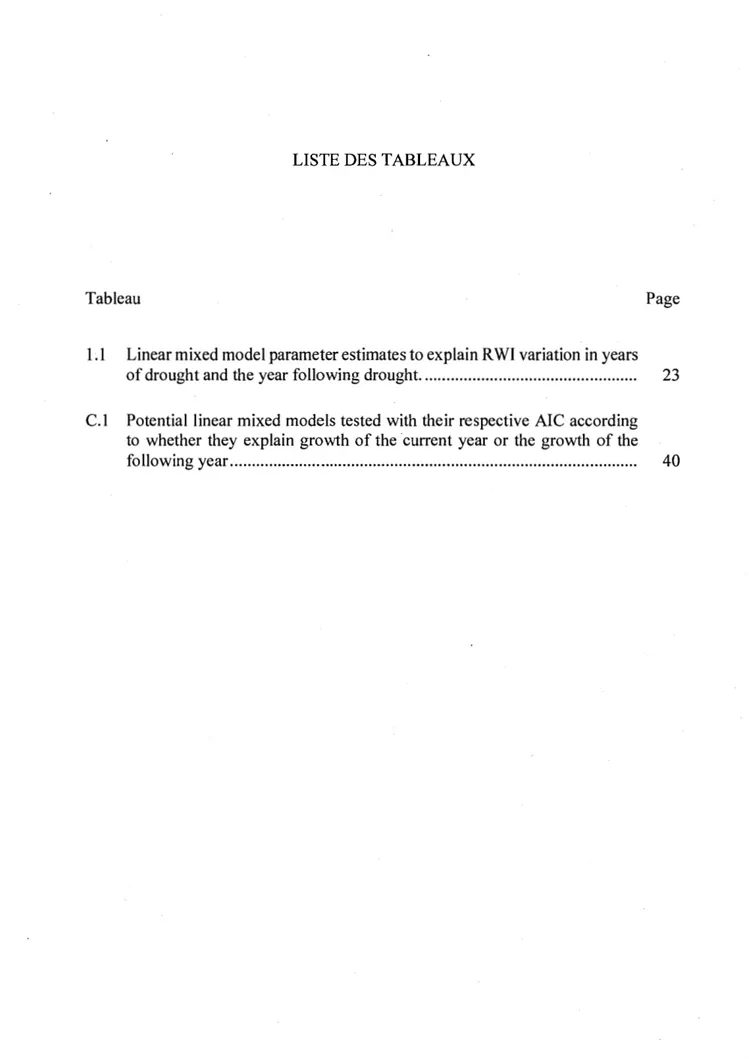
that it considers the whole system, the hydrological balance of all water contributions (rain, snow, melt), minus everything that cornes out of the watershed (evaporation and transpiration) (Livingston and Kenefic, 2018) .. This index was calculated from the algorithm used to calculate the Standardized Precipitation Index (SPI), using daily stream flows instead ofprecipitations (National Drought Mitigation Center, 2019). The algorithm adds up daily data for each month and then standardizes it. The latter is the standard deviation from the historical monthly average. Being associated with a 1-month time scale, the SSFI shows the effect ofunusually drier than average 1-months on tree growth. Only months with SSFI values less than or equal to -1 were considered as droughts and were used in the analysis to-explain growth (Figure 1.2). For example, all years with a drought in August with a value less than or equal to -1 are considered. Finally, we mainly focused on droughts occurring during the growing season between May and August, which could have a negative impact on the growth of the same year (Duchesne et al., 2012). The impact of previous year's droughts on growth, were evaluated using SSFI values from June to September. In this study, stream flow data from Laflamme Lake watershed located inside the Montmorency Forest was used and the study period is from 1999 to 2017.
lL (/) X (1) "'Cl E :!: 0 u:::: E Cil êï5 "'Cl (1) N 2
'ê
-1 (1) "'Cl C Cil êï5 -2 Years Months 5 May) .... 6 June) ..,.. 7 July) ..,.. 8 August) 9 September)Figure 1.2 Standardized Stream Flow Index va lues for ail summer months (colored lines) for the period of 1999 to 20 17. The red dashed line represents a drought threshold of -1 , whi le the dashed gray fin es represent the years of drought previously identified by Houle et al. (20 16).
1.3.6 Statistica l ana lysis
ln an attempt to determine the effect of stand density, tree position in the canopy and diameter on the sens itivity of balsam fir' s rad ial growth to drought, we fitted linear-mixed models using the lme4 package (Bates et al., 20 19). To consider the potential lag effect as it cou ld influence our observations of the effect of competition on tree response, we created two models, one to explain standardized gro.wth in the same year as the drought, the second , to exp lai n standardized growth of the year fo llowing the drought. As fixed variab les acco unting for competition, we integrated the socia l status of study trees, their DBH, stand density and stand type (PCTs or natural stands). DBH was measured in the field in 20 1 8, but DBH fo r earlier years was reconstructed by subtracting diameter growth (the doubled an nuai rad ia l ring width) for each individual.
DBH and stand density were transformed into normal distributions with square root and natural logarithm transformations respectively. Then, all fixed numerical factors were scaled, by subtracting the mean of the values and dividing by the standard deviation, to allow comparison between the factors in the model. The integration of PCT into the model evaluates whether this intervention affects stands other than by reducing the stand density and thus competition. This allows us to test whether it is the treatment or the density of the stand which influences growth. To integrate the timing of drought and its intensity in the models, we used SSFI, the chosen drought index, and the months the index values are associated with. Only droughts that occurred between May and August were chosen for the model of growth of the current year because they correspond to the growing season in our study area (Duchesne et al., 2012). For the growth model of the following year, only droughts that occurred between June and September were kept because we wanted to test the potential lag effect on growth associated with late droughts. We also tested our models with SPEI and as they gave similar results only SSFI is presented.
W e considered several models with the factors mentioned above while testing for various interactions based on the knowledge of ecological processes and physiological mechanisms involved. Each one was tested to explain the effect of drought on growth of the current year and the following year. Finally, we used AIC (Bumham and Anderson, 2002) to select the most appropriate model explaining the effect of drought on growth of the current year and used the same one to explain the effect of drought on growth of the following year (Table 1 appendix). The model is the following:
Where RWI is the radius increment of the current year, SSFII is the drought index for the current year, Month is a qualitative variable indicating the month of drought, Adjusted DBH is the adjusted diameter of each tree-study, Dens is the stand de'nsity, PCT is a binary variable indicating whether the stand was pre-commercially thinned or not, Social status is the relative position of the tree in the canopy. The model also included a random term associated with the tree (ID variable), nested in the stand (Stand variable).
1.4 Results
1.4.1 Influence of the seasonality of droughts
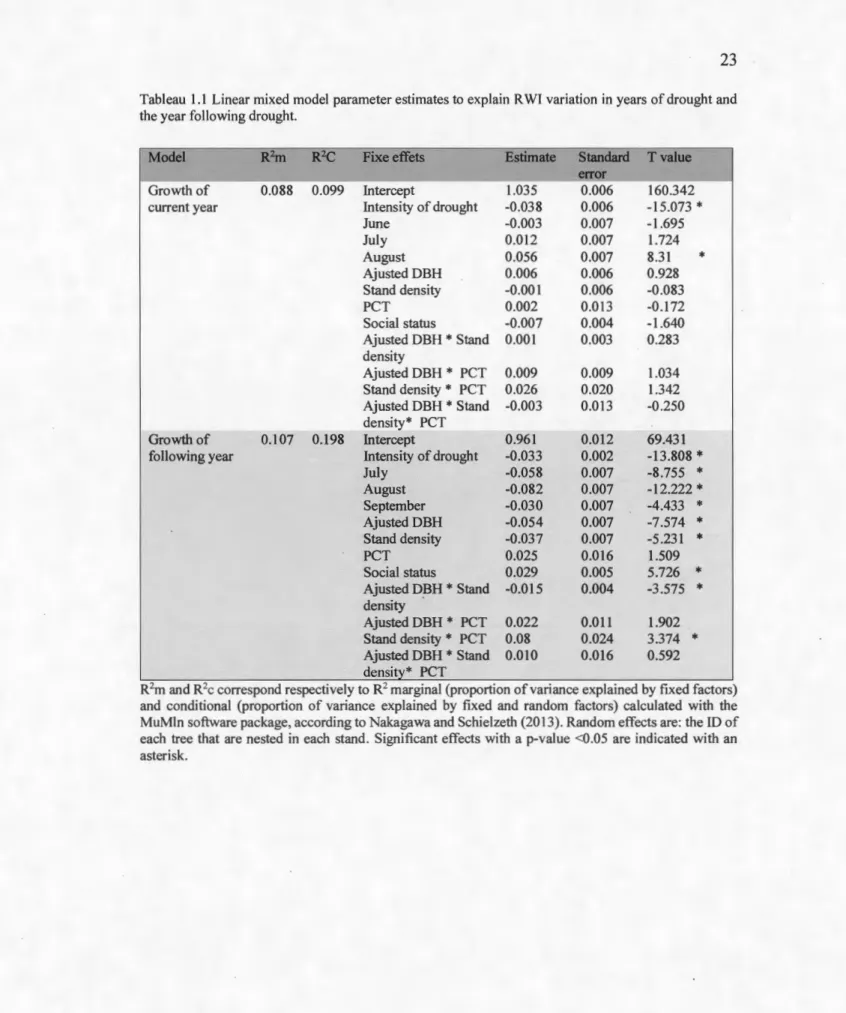
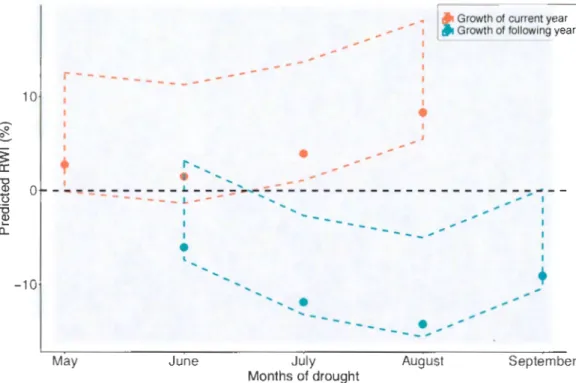
Considering the impacts of the current year, droughts occuring in May, June and July did not significantly influence relative radial growth, while droughts occurring in August resulted in a relative increase in current year growth of 8.3% (Table 1.1, Figure 1.3 A). In comparison, droughts occurring in June, July, August and September of the previous year decreased relative growth in the following year (Table 1. 1 ). In fact, droughts occurring in August led to the largest decline (14.2%) in relative growth, while droughts in June, July and September resulted in relative growth decreases of 6.1 %, 11.9% and 9.1 %, respectively (Figure 1.3 B).
Tableau 1.1 Linear mixed mode! parameter estimates to exp Iain R WI variation in years of drought and the year following drought.
Model R2m R2C Fixe effets Estimate Standard Tvalue
error
Growth of 0.088 0.099 Intercept 1.035 0.006 160.342
current year Intensity of drought -0.038 0.006 -15.073 *
June -0.003 0.007 -1.695 July 0.012 0.007 1.724 August 0.056 0.007 8.31 * Ajusted DBH 0.006 0.006 0.928 Stand density -0.001 0.006 -0.083 PCT 0.002 0.013 -0.172 Social status -0.007 0.004 -1.640 Ajusted DBH * Stand 0.001 0.003 0.283 density Ajusted DBH * PCT 0.009 0.009 1 .034 Stand density * PCT 0.026 0.020 1.342 Ajusted DBH * Stand -0.003 0.013 -0.250 density* PCT .. - -Growth of 0.107 0.198 Intercept 0.961 0.012 69.431
following year Intensity of drought -0.033 0.002 -13.808 *
July -0.058 0.007 -8.755 * August -0.082 0.007 -12.222 * September -0.030 0.007 -4.433 * AjustedDBH -0.054 0.007 -7.574 * Stand density -0.037 0.007 -5.231 * PCT 0.025 0.016 1.509 Social status 0.029 0.005 5.726 * Ajusted D~H
*
Stand -0.015 0.004 -3.575 * density Ajusted DBH * PCT 0.022 0.011 1.902 Stand density*
PCT 0.08 0.024 3.374 * Ajusted DBH * Stand 0.010 0.016 0.592 density* PCTR2m and R2c correspond respectively to R2 marginal (proportion of variance explained by fixed factors)
and conditional (proportion of variance explained by fixed and random factors) calculated with the MuMln software package, according to Nakagawa and Schielzeth (2013). Random effects are: the ID of each tree that are nested in each stand. Significant effects with a p-value <0.05 are indicated with an asterisk.
a: "al t3 o..
r---10 1 r-''•
1•
Growth of current year Growth of following year
.
' 'Or- ~~:~=::::: ~::=~~
-- ::
__________________
~-
--- 10 May 1•
June-
--'.
July Months of drought+
•
----_.,,,.
August SeptemberFig ure 1 .3 Prediction of standardized growth models by drought months. The colored dots represent the predicted growth when the Standardized Stream Flow Index (SSFI) value is fixed at the median. The dashed ri bbon represents the range of pred icted growth when the SSFI values are fi xed at the maximum and minimum values. The dashed line represents the average standardi zed growth fo r the period between 1999 et 20 17. Asterisks indicate growth s ignificantly di fferent from 0%.
1.4.2 Influence of biotic factors measured at the tree and stand level
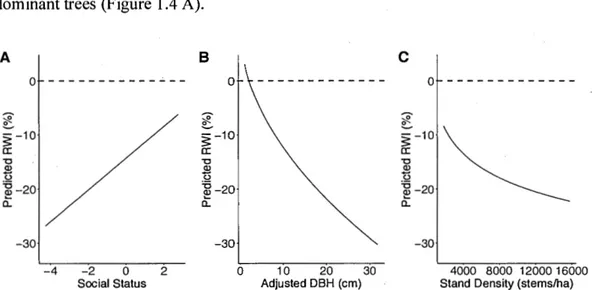
Comparing the two mode ls, we observed that biotic factors had no significant influence on relati ve growth that occurred du ring the year of the drought, whereas these factors signiticantly influenced RWI in post-d rought years. We thus focus on results of the model expla ining growth the year fo llowing the droughts in subsequent analyses. Tree social status was o bserved to influence growth in drought years as fo llows: fo r suppressed trees with a small re lative height, the ir gro wth was observed to be up to 26.8% lower in the post-drought year than the ir annual average. ln comparison, dominant trees, with a high relati ve height, underwent a growth dec line in the post-drought year, which was about fo ur times less, ie 6.2%. This indicates that fo r the same
DBH and same stand density, suppressed trees are more vulnerable to drought than dominant trees (Figure 1.4 A).
A B C 0.1- - - .;. - - 0
0+---l
-10 a: "O °fil-20a:
~30 ê ~-10 a: "O °fil-20a:
-30 -10 a: "O .!!? _g °fil-20a:
-30 -4 -2 0 2 0 1 0 20 30 4000 8000 12000 16000Social Status Adjusted DBH (cm) Stand Density (stems/ha)
Figure 1.4 Prediction of the R WI model according A) the social status, obtained by dividing the height of a study tree by the average of ail study tree heights from the same stand, where negative number are suppressed trees and positive number are dominant trees B) the adjusted DBH and C) the stand density, in post-drought years. The black lines represent the predictions and the dashed lines represent the average of the standardized growths for the period between 1999 et 2017.
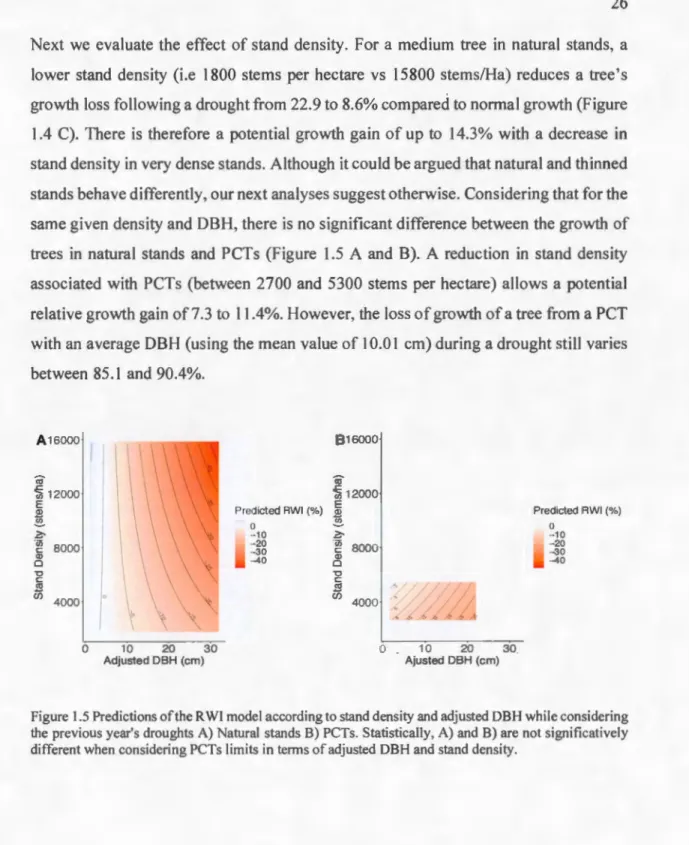
By fixing the social status factor in the model, we observe that trees witli a larger DBH undergo a greater growth loss during the post-drought year (Figure 1.4 B). In natural stands, this decline in growth in large DBH trees following drought is amplified in denser stands by a reduction ofup to a 48.0% that of normal growth. In contrast, smaller
. .
trees benefit from the previous year's droughts with an increase in growth ofup to 5.4% (Figure 1.5 A). However, this does not allow the smallest tree, with a DBH of 3. 7 cm, to perform as muchas the largest tree, with a DBH of 33.0 cm, in terms of total growth. In this sense, the smallest tree can grow up to an average of 43.07 mm2 per year, while
the largest tree bas an average growth of 1624.11 mm2 per year (Figure B. l A). Thus,
despite a considerable decline in the growth of large trees in the post-drought year, the fact remains that their overall growth is still greater than that of small-diameter trees.
Next we eva luate the effect of sta nd density. For a med ium tree in natural stands, a lower stand density (i.e 1800 stems per hectare vs 15800 stems/Ha) reduces a tree's growth loss fo llowing a drought from 22.9 to 8.6% compared to normal growth (F igure 1.4 C). There is therefore a potential growth ga in of up to 14.3% with a decrease in stand density in very dense stands. Although it cou Id be argued that natural and thinned stands be have d ifferently, our next analyses suggest otherwise. Considering that fo r the same given density and DBH , there is no significant difference between the growth of trees in natural stands and PCTs (F igure 1.5 A and B). A reduction in stand density associated with PCTs (between 2700 and 5300 stems per hectare) allows a potential re lative growth gain of 7.3 to 11 .4%. However, the loss of growth of a tree from a PCT with an average DBH (using the mean va lue of 10.0 1 cm) during a drought still varies between 85.1 and 90.4%. A 16000
"'
\
\
\\\~
12000 E Q) }?;, -~ 8000 Q) 0 "O C m êii 40oolr
1 1\
\'i'
\, <: 0 10 20 30 Adjusted DBH (cm)Pred icted RWI {%) 0 - 10 1.r 20 -30 -40 B 16000
"'
12000 E }?;, -~ 8000 Q) 0 "O C m êii 4000 ' ,,...'4 0 10 20 30 Ajusted DBH (cm) Predicted RWI (%) 0 - 10 -20 -30 -40Figure 1.5 Predictions of the RWI model according to stand density and adjusted DBH whi le considering the previous year's droughts A) Natural stands B) PCTs. Statistically, A) and B) are not significatively different when considering PCTs limits in ternis of adjusted DBH and stand density.
1.5 Discussion
The RWI of balsam fir was not negatively influenced by a drought occurring in May, June, July or August of the same year as the growth measurement which is contrary to the results observed by D 'Orangeville et al. (2018) on conifer and deciduous trees. This could be explained by the study site, where the Montmorency Forest is a particularly wet environment with heavy snow accumulation and late snowmelt. This could mean that despite a lower water flow than the average for some years in early summer, that is not enough to induce water stress in trees. On the contrary, trees could potentially benefit from drier soil during waterlogged spring months. It is also possible that trees may have used accumulated carbohydrate reserves irt pre-drought years to maintain similar growth to the overall average. The adverse effects of drought, however, were observed in the relative radial growth of the following year, specially, when droughts occurred in August. These results are consistent with our hypothesis and the results of Anderegg et al. (2013); Anderegg et al. (2015); Babst et al. (2012); D'Orangeville et al. (2013); Peltier et al. (2016) reporting a lag in the impacts of droughts, possibly when they occurred late in the summer, during bud formation (Bréda et al., 2006; Fritts,
1978).
Despite some limitations of this study, described below, we still observed the effects of stand density, tree diameter and its social status on the relative growth of trees through a lag effect modulated by the seasonality of droughts. In this study, due to the small size of the young trees studied, we only considered droughts that occurred between 1999 and 201 7, which means that the number of droughts and years of growth studied is limited. Potentially due to the short-time period evaluated, we may not have been able to validate the results of Itter et al. (2019) on the negative effects of long-term drought on growth. Furthermore, our studied forests occurred in a wet region (this site is at the limit of the spectrum of climatic conditions, in terms of precipitation in
which balsam firs generally grow) which may have tempered the effects of droughts. Although balsam firs seem well adapted to this environment, it is possible that other populations of this species growing in drier environments would respond differently to droughts. Finally, since competition at the stand and tree scale were not measured over the entire period for which we measured growth we had to assume that the values measured in 2018 are representative of the competition of earlier years. W e acknowledge that the density of natural stands decreases over time when they are in the natural self-thinning stage (Oliver et al., 1996), it is possible tliat density and thus competition measured at the stand scale in 2018 is slightly lower than density at the beginning of the study period. Although we used stand density, we recognize basal area, which is unavailable, could have been a more meaningful measure of competition. ·
Nonetheless, the analyzed biotic factors only influenced the growth of the year following a drought, thus demonstrating the importance of the period of observation relative to the timing of the moisture stress. Thus, considering the lag effect, predictions of the growth of the following year's model indicate that for the same social status, tree DBH is the factor that most influences RWI during drought. Trees with larger DBHs undergo a greater decline in growth compared to smaller ones. These results are consistent with those of Martin-Benito et al. (2008); Merlin et al. (2015) and have been explained by the hydraulic limitation hypothesis suggesting that for trees of the same social status, those with a larger DBH would possibly have a wider, deeper crowns, which could lead to greater transpiration. This would lead to greater evapotranspiration and it also would increase the distance traveled by water to reach all extremities of the tree (Ryan and Y oder, 1997). This mechanism would make larger trees more vulnerable to cavitation of water columns in the xylem, thereby reducing relative growth.
Stand density, in addition to having a significant negative effect on relative growth in post-drought years, also modulates the effect of DBH on tree response. In fact, in denser stands, the decline in growth is greater when trees are under water stress. This
negative impact increases as the DBH of the trees increases. This refutes our hypothesis on competition measured at the stand level. Instead, an increase in stand density results in a higher leaf area index and more evapotranspiration, which reduces soil water content. Greater vulnerability of large trees to drought could be problematic on a larger scale considering their economic importance, their greater ability to _ fix carbon (Stephenson et al., 2014) and their important role in ecosystems in terms of habitat for wildlife (Lutz et al., 2012).
Considering the potential relative growth gain in post-drought years associated with a decrease in density and thus competition, this supports the use of a silvicultural treatments such as precommercial thinning to reduce, even minimally, the vulnerability of trees to droughts (Brooks and Mitchell, 2011; Cescatti and Piutti, 1998; Giuggiola et al., 2013; Kohler et al., 201 O; Le Goff and Ottorini, 1993; McDowell et al., 2007; Sohn et al., 2013). However, despite a reduction in competition for water our observations from these wet environments still show that growth in the post-drought year, is 15.6 to 11.5% lower than the average. Trees in thinned stands are thus still vulnerable to drought despite lower stand densities. Density reduction is therefore not an ultimate fix to reduce the vulnerability of trees to future water stress.
However, in order to reduce the vulnerability of large trees to droughts, thinning may be optimized by considering tree social status. Indeed, according to predictions from the drought effect model explaining growth of the following year, tree social status as measured by canopy position has a significant positive effect on relative growth, where suppressed trees were observed to suffer a greater loss in relative growth than dominant trees. The greater growth reduction in suppressed trees during drought may be due to limited access to resources such as light, smaller crowns, and shallower roots (Trouvé et al., 2017). This could result in suppressed trees having lower carbohydrate reserves than dominant trees (Trouvé et al., 2017). By ad ding hydrie stress to the . stress of competition, suppressed trees may thus have low carbon reserves, leading to greater
growth reductions compared to dominant trees. In this sense, prioritizing the removal of suppressed trees during thinning could promote a certain resistance and resilience of large and dominant trees up to a limit, which is the hydraulic limitation associated with tree size.
1.6 Conclusion
In this study, we measured the vulnerability of balsam tirs to recent droughts in terms of growth, while considering for stand density, tree social status and their diameter and the timing of droughts. Our results validated our hypothesis that there is a significant lag effect of one year between droughts, mainly those in August, and the response of balsam tirs in terms of annual radial growth in comparison with average growth. Through this lag effect, we noted a strong effect of DBH on radial growth during droughts, which is modulated by stand density. Therefore, the use ofthinning to reduce density and thus competition reduces the vulnerability of trees to droughts, even though, the use of this type of treatment is not the ultimate answer to mitigating the effects of future changes on trees because they remain vulnerable to water stress even in low density stands. However, focusing on cutting suppressed trees while thinning could optimize the performance of this type of treatment and benefit larger trees before the hydraulic limitation becomes a higher threat.
2.1 Rappel des objectifs et résultats importants
La sécheresse constitue un événement climatique extrême où l'eau disponible pour les plantes est réduite pour une durée prolongée. Les objectifs de cette étude étaient de déterminer l'influence de la saisonnalité des sécheresses sur la croissance des sapins baumiers, mais aussi de déterminer comment la compétition mesurée à l'échelle de l'individu et du peuplement influence la réponse des sapins aux sécheresses en termes de croissance. Nos résultats montrent que les sécheresses survenant en mai, juin, juillet et août n'ont pas d'influence négative sur la croissance annuelle des cernes de la même année, possiblement en raison des fontes de neiges tardives. Toutefois, les sécheresses et particulièrement celles du mois d'août réduisent considérablement la croissance relative l'année suivante. Ceci indique qu'il y a un effet de décalage entre le stress hydrique et la réponse des arbres en termes de croissance et que la saisonnalité du stress est un facteur non négligeable. Ce phénomène peut être expliqué par les sécheresses survenant lors de la formation des bourgeons. En effet, à l'échelle du Québec par exemple, une croissance réduite lors des années post sécheresses et possiblement à plus long terme pourrait représenter des P,ertes en termes de volume de bois considérable pour l'industrie forestière. C'est pourquoi considérer ce phénomène pourrait aider à améliorer les prévisions de production futures. De plus, en considérant cet effet de décalage, nos résultats montrent que les arbres opprimés sont plus sensibles aux sécheresses que les arbres dominants d'un même peuplement, possiblement à cause d'un accès limité aux ressources. Par ailleurs, pour une même hauteur, les arbres ayant de plus gros DHP subissent une plus grande baisse de croissance relative que les petits.
Ce résultat pourrait être expliqué par une plus grande vulnérabilité de ces arbres à la cavitation. Ceci pourrait être problématique considérant la valeur économique des gros arbres, leur capacité à fixer le carbone et leur rôle d'habitat pour la faune. Finalement, face aux sécheresses, la vulnérabilité des arbres augmente avec la densité, possiblement en raison d'une plus forte évapotranspiration. En ce sens, l'utilisation des EPC pour réduire cette densité et donc la compétition, en mettant l'emphase sur la coupe des arbres opprimés, peut permettre aux sapins, surtout les gros, d'être légèrement moins sensibles à de tels événements climatiques.
2.2 Limitations et améliorations
Une des limites de cette étude est qu'elle ne considère que les sécheresses récentes, soit de 1999 à 201 7. Ceci implique donc que l'effet de décalage des sécheresses n'a été étudié que sur cette période, malgré qu'il soit possible d'imaginer que ce phénomène se soit aussi produit dans le passé. Il reste que le nombre de sécheresses et d'années de croissance étudiées est limité. De plus, les années ayant des sécheresses étant rapprochées dans le temps, notre étude ne permettait pas d'observer l'impact à plus long terme d'une sécheresse sur la croissance des sapins. En ce sens, nos résultats ne permettent pas d'appuyer ceux ltter et al. (2019) montrant que les sécheresses peuvènt influencer négativement la croissance des arbres de 3 à 6 ans suivant l'événement climatique. Dans le futur, davantage d'études permettant de quantifier le temps de résilience des arbres suite aux sécheresses pourraient contribuer à améliorer les modèles de prédictions du cycle du carbone dans un contexte de changement climatique. Du côté de la compétition à l'échelle de l'arbre et du peuplement, nous n'avions que les données récoltées en 2018. De ce fait, pour voir effet de ces facteurs en période de sécheresse sur la croissance, nous avons dû assumer que la compétition entre 1999 et 2017 était la même qu'en 2018. Malgré que la densité des peuplements ait possiblement diminué avec le temps par auto éclaircissement naturel, nous avons tout de même