Science Arts & Métiers (SAM)
is an open access repository that collects the work of Arts et Métiers Institute of
Technology researchers and makes it freely available over the web where possible.
This is an author-deposited version published in:
https://sam.ensam.eu
Handle ID: .
http://hdl.handle.net/10985/14637
To cite this version :
Maxime SAGNARD, Romain ECAULT, Laurent BERTHE, Kay BRUNE - Development of the
symmetrical laser shock test for weak bond inspection - Optics and Laser Technology - Vol. 111,
p.644-652 - 2019
Any correspondence concerning this service should be sent to the repository
Administrator :
[email protected]
Full length article
Development of the symmetrical laser shock test for weak bond inspection
M. Sagnard
a,⁎, R. Ecault
b, F. Touchard
c, M. Boustie
c, L. Berthe
aaPIMM, UMR8006, ENSAM, CNRS, CNAM, 151 bd de l’Hôpital, 75013 Paris, France
bAirbus Operation S.A.S– ESCMN1, 316, route de Bayonne – B.P. D4101, 31060 Toulouse Cedex 9, France
cPPRIME Institute, CNRS-ENSMA-Université de Poitiers, Département Physique et Mécanique des Matériaux, ENSMA, 1, Av. Clément Ader, B.P 40109, 86961
Futuroscope Cedex, France
H I G H L I G H T S
•
Laser induced shockwave to certify bonded assembly.•
No NDT currently available to assess bonded CFRP structures integrity.•
Detection capabilities of the S-LASAT to assess bond integrity of contaminated lab samples.•
Behaviour of both healthy and contaminated bonded CFRP under laser shock.•
Demonstration of the S-LASAT detection capabilities on real aircraft parts. A R T I C L E I N F O Keywords: Non-destructive testing Adhesion Assembly Polymer-matrix composites Carbonfibre reinforced compositeA B S T R A C T
This study aims to assess the capability of the LAser Shock Adhesion Test to detect weak bonds in assemblies made of carbonfibre reinforced polymer laminates as well as understand the behaviour of different bonded composite structure under a shock load. A specific setup based on symmetrical laser shocks has been used. After each test, ultrasounds are used to determine if the bond has been damaged or not. Atfirst, samples with two contaminants - de-icingfluid and finger prints - were studied. Then, the bond quality of two partially con-taminated aircraft parts were investigated. These original results demonstrate the efficiency of the symmetrical laser shocks method as a Non-Destructive Test for bonded carbonfibre reinforced polymer assemblies.
1. Introduction
The reduction of carbon dioxide emissions is one of today’s greatest challenges for the aeronautic industry. Today, numerous directives such as the European Emissions Trading Scheme or organisations such as the International Air Transportation Association (IATA), aim to neutralise the CO2 emission growth[1,2].
Lee[3]showed, through a short analysis of current and forthcoming technologies, that a plethora of solutions already exist (alternative fuels, changing cruises altitudes,…). Nowadays, reducing the weight of aeronautic structures is considered as one of the most promising lead for the reduction of CO2 emissions. One outcome of this weight re-duction is the wide use of composite structures, because of their good strength-to-weight ratio [4]. However, while the materials have evolved, the assembly process did not evolve along with them. Com-posite materials are currently assembled using rivets or bolts, which implies drilling holes in the panel. As experimentally demonstrated by Di Franco [5], this type of mechanical bonding creates high local
stresses inside composite structures and their use should be limited. To overcome these problems, parts are usually oversized, thus neutralizing composite’s advantages on the structure weight.
Assembling composite structures using epoxy bonds has been seen as a good option to avoid drilling holes. The mechanical strength of such assembly is comparable if not better to that achieved with bolting or riveting[6]and removes their major drawbacks: oversized parts. If current aircrafts, such as the A350, were to be built only using this technique, the total weight of the plane could be reduced by 15% after structure optimisation[7].
However, it is known that after contamination of one of the bonded surfaces, the overall adherence of the joint can drop drastically. These faulty bonds are often referred to as“weak bonds”[8]. There are cur-rently no Non-Destructive Tests (NDT) capable of assessing the integrity of these assemblies, which renders the certification of these parts im-possible.
Two ways of addressing this certification problem are currently under investigation. Thefirst group of methods is solely focused on the
⁎Corresponding author.
E-mail address:[email protected](M. Sagnard).
pre-bond analysis of surfaces. They aim at detecting whether an area has been contaminated or not. For example, studies realised by De Vito
[9]and Helwig[10]on opto-electronic systems showed promising re-sults for the detection of surface contaminant such as hydraulicfluids, humidity or release agent residues[11]. The second group of methods is entirely centered on the post-bonded structure. By applying a me-chanical force onto the joint, these techniques try to assess the adhesive strength of a bond and compare to a reference sample[12].
This study aims at assessing for thefirst time, the bond integrity of real contaminated aircraft parts using LAser Shock Adhesion Test (LASAT) in a symmetrical impacts configuration. Our recent papers
[13]has described the technique but no clear differentiation between contamination levels was achieved. Moreover, no comparison with conventional mechanical testing was done. Since, major improvements were realised on both the technique and the testing process.
Thefirst part presents the laser shock, its application to adhesion testing and its symmetrical optimisation. Follows a study using con-taminated samples. Its goal is to assess the capabilities of the technique at detecting weak bonds created using different contaminants. Eventually, this article describes an experiment realised on real aircraft parts that have been partially contaminated. This work has been rea-lised thanks to the European project ComBoNDT[14], anchored in the H2020 framework.
2. The laser shock adhesion test (lasat)
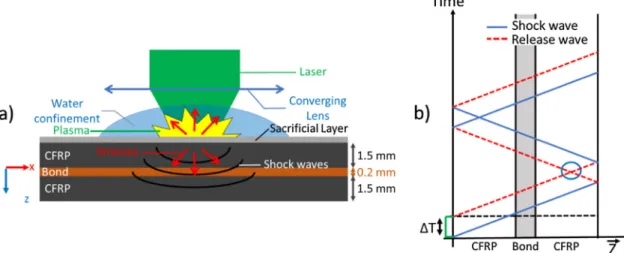
The LASAT uses a laser pulse to generate shock waves within a test sample. Upon reaching the surface of the specimen, the laser creates a dense plasma through the vaporisation of a few micrometres of mate-rial. By expanding, the high-pressure plasma transmits part of its energy to the sample in the form of shock waves.Fig. 1(a) depicts this laser shock phenomenon on a bonded Carbon Fibre Reinforced Polymer (CFRP) sample. The sacrificial layer (in grey) is an aluminium adhesive tape (35 µm) which serves two main purposes. It primarily protects the sample from being partially vaporised, instead, it is the aluminium which is sublimated to generate the plasma. Secondly, the pressure generated by this technique highly depends on the laser/matter inter-action. By always using the same sacrificial layer, one ensures the in-teraction– and thus the loading – is the same regardless of the sample material.
The purpose of the confinement material is to increase the gener-ated pressure within the material. It has been shown that such config-uration can help reach up to four times the pressure created without any constraining medium[15]. For the coupon samples, water was used as a confinement medium.
The space/time diagram Fig. 1(b) describes the shock wave’s
behaviour within the material. The front of the shock wave is re-presented using solid lines. The release wave, that sets the material back to its initial state, is represented using dotted lines. The shock wave travels all the way to the back-face of the sample and turns into a release wave. Upon crossing the initial release wave, the reflected shock wave generates a high tensile stress (full circle). For a given material, the position of this high tensile stress simply depends on the shock duration which is defined by the laser’s pulse duration ΔT.
The capability to test interfaces’ adherence has already been shown for both aluminium[16]and composite structures[17]. However, the technique in its current state lacks modularity. If the tested interface was not near the back of the sample, the maximum tensile stress would not be optimally located. A previous study on contaminated joints showed that for a strong enough bond, it was not possible to detect the weak bond without damaging the composite[18].
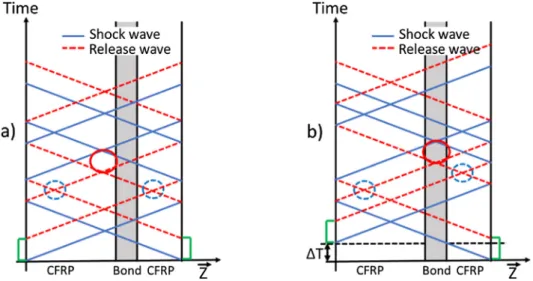
The Symmetrical LAser Shock Adhesion Test (S-LASAT[19,20]) is proposed to overcome this limitation. This technique consists of gen-erating shock waves from both sides of the tested specimen. As for the single shot setup, high tensile areas are generated on each opposite side of the sample (dotted circles inFig. 2(a)). However, a higher tensile stress is created at the intersection of the two reflected shock waves (solid circle) and its location does not exclusively rely on the pulse duration.
The high tensile stress location can be shifted by applying a time delay between each laser pulse (Fig. 2(b)). The required time delay can be calculated using Eq.(1):
∑
∑
= × − × T tl ρl Zl tr ρr Zr Δ i i i i i j j j (1)where the indices r and l refer to the material respectively on the right and on the left of the area where the maximum tensile stress should be located, tliis the thickness of ply number i, ρlithe density of the ply, and
Zliits shock impedance.
Ghrib[21]has shown that by using this time delay, one can gen-erate the maximum tensile stress in a specific location of the material, and for example generate a delamination in between two selected plies inside of a laminate structure. This technique has not yet been used to assess bonding quality on real aircraft parts.
However, if the LASAT can differentiate a weak bond from a healthy one, an additional NDT is required to reveal the outcome of the test to the user. Ultrasounds scanning was chosen for its ease of use and strong capability to spot defects such as bond openings.
A standard LASAT procedure starts with the definition of the threshold of a healthy sample. Once isolated, a fraction of the threshold energy is used to test the real panel. For example, in the case of bond assessment, anything below 80% of the specification’s adhesion level
will be considered as too weak. If a damage is spotted using ultra-sounds, the part will have failed the test, the bond must be redone. Else, the adhesive capacities of the bond are validated, and the part can be used as is. The LASAT is only destructive for parts that do not meet the technical requirements.
3. Experimental material 3.1. Experimental setup
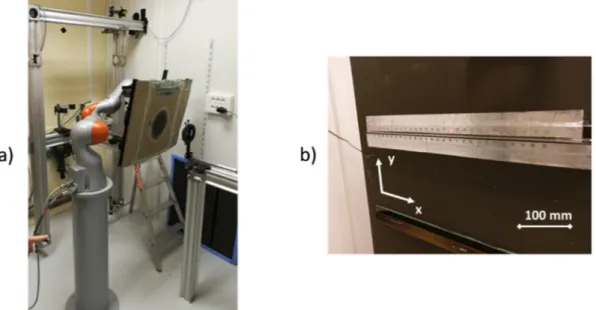
A Nd:Yag laser is used to generate a pulse of 7 ns which can deliver up to 2x7J. To create a symmetrical shot, the Gaïa laser used on the Hephaïstos platform is composed of two lasers which beams are po-larised by 90° from one another. Thanks to a polariser, two distinct beams, referred to as Beam A and Beam B, are created and transported through optics to both sides of the tested sample (Fig. 3(a)).
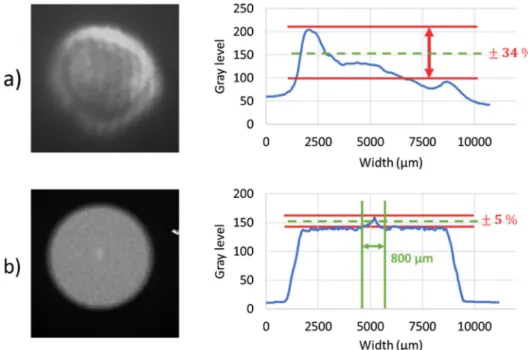
Compared to the last work[13], Diffractive Optical Elements (DOE) were added on both beam paths. This optics makes for a better control of the spatial repartition of the pressure on top of the sample. These serve to break down the initial laser beam, and reform it to assure a good homogeneity of the laser at the focal spot.Fig. 4(a) shows the laser repartition, at the focal spot, with and without DOE. One can a wide important intensity variation before the DOE ( ± 34% compared to the mean value). Moreover, this variation occurred over the whole spot area. After these optics were included in the experimental setup, a much smoother repartition can be observed (Fig. 4(b)), very close from a top-hat signal, with only a small and very localised intensity variation. Prior to the shot, the tested area was protected using an aluminium adhesive tape, and the zone was confined using a water trickle to make sure at least 1 mm of water covered the sample during the test (Fig. 3(b)).
3.2. Coupon samples
The samples are made of two bonded Carbon Fibre Reinforced Polymers (CFRP) laminates. Each laminate is made of 8 layers [90/0/ 45/−45]Sof Hexcel IM7/M21E for a total thickness of 1.5 mm. Epoxy
resin is used for both the bond and the laminate. Two types of assem-blies were created for this study: production type samples (P) bonded with 200 µm of FM300-K cured at 444°K and repair type samples (R) bonded with FM300-2M cured at 394°K. The FM300-K has an in-tegrated knit carrier to facilitate its manipulation in the production facilities. This net is not present inside the FM300-2M bonds. Moreover, the samples have been prepared according to Airbus specifications: the repair samples were grinded all the way to thefibres before bonding. This step is not required when creating production type parts.
In this paper, two contaminations are studied: thefinger print (FP) contamination for the production samples and the de-icingfluid (DI) contamination for the repair ones. Each contamination was realised at three given levels, low, medium, and high, which respectively re-presents a loss of 5%, 10% and 20% of adherence. For example, a repair sample contaminated with de-icingfluid will be referred to as R-DI-1, for the lowest level, R-DI-2 for the medium and R-DI-3 for the highest. A standardisedfinger print solution (DIN ISO 9022-12) was used to mirror a FP contamination. It contains sodium chloride, urea, ammo-nium chloride, lactic acid, acetic acid, pyruvic acid, and butyric acid. The solution was diluted to obtain the desired adherence loss: low contamination was achieved by mixing 1 volume of solution with 9 volumes of demineralised water, the medium contamination was a 50/ 50 ratio, and the highest contamination was purefinger print solution. The de-icer used was the Safeway KF developed by Clariant. The solution was diluted in demineralised water and applied, using a deep-coating method, with the following concentration (%vol): 2%, 7% and Fig. 2. Time/space diagram of S-LASAT shots: (a) without time delay and (b) with a time delay.
10%. After pollution, the laminate was dried in a 40 °C oven for 2 h and let dry an addition 24 h at room temperature.
By definition, weak bonds cannot be spotted using standard NDTs. Thereby, to assure the joint is representative of a weak bond, ultra-sound scans were realised after the bonding process. If initialflaws such as delamination or cracks were spotted, the sample would not be con-sidered.
Each sample was also mechanically tested at Patras University
[22,23]using a double cantilever beam (DCB) test to assess the mode-1 fracture toughness (GIC) and an end-notchedflexure (ENF) test for the mode-2 fracture toughness (GIIC). Combined with ultrasound scanning, mechanical tests were a cross validation of the creation of weak bond within the coupon samples.
Fig. 5(a) summarizes the mechanical test results obtained for the production reference, P-RE, sample (blue) and the finger print con-tamination (orange), and Fig. 5(b) for the repair reference, R-RE, sample (blue) and de-icer contamination (orange). To ease later
comparison with the LASAT, all values have been normalised by the reference sample value. Hence the de-icer results have been normalised using the sound repair sample threshold, and thefinger print one by the reference production sample.
Both the GIC and GIIC tests show a general decrease of the bond strength after the contamination. However, because the range of GIC tests’ uncertainty bars for a sound and a contaminated sample were overlapping, no direct conclusion could be drawn out. GIIC tests were more consistent and confirmed the loss of adherence/mechanical strength of the contaminated samples.
4. S-LASAT results on the coupon samples 4.1. Threshold determination
A specific threshold definition procedure was used to assess the bond strength of each coupon. Each coupon wasfirst scanned to verify Fig. 4. Spatial repartition of the laser intensity on beam A (a) before DOE were included in the experimental setup and (b) after DOE were included in the experimental setup.
Fig. 5. Mechanical tests for: (a) the production reference sample (P-RE) and the three levels offinger print contamination, low (P-FP-1), medium (P-FP-2) and high (P-FP-3)– (b) the repair reference sample (R-RE) and the three levels of de-icing fluid contamination, low (R-DI-1), medium (R-DI-2) and high (R-DI-3)[22,23].
no damage was inherently present in the sample and an aluminium adhesive was applied onto the shot surface. The specimen was placed in a pre-design holder to assure the tested area would always be the same from a shot to another.
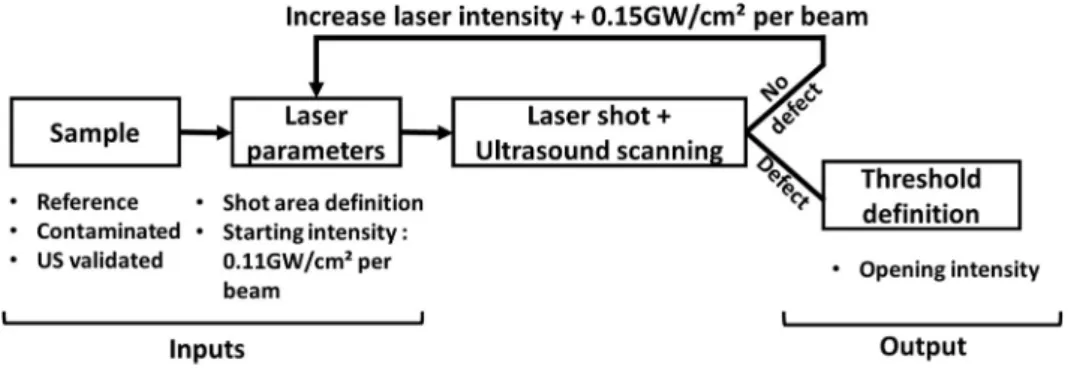
After each shot, the laser spot was moved to a different area and the intensity was increased, until a default was generated within the sample. However, this technique heavily relied on the good homo-geneity of the sample, and this hypothesis could not be applied to certain local contamination such as thefinger print one. Hence, to avoid heterogeneity problems and edge effects, a single area was tested in the middle of the sample. After each shot, the coupon was removed from the specimen holder, the adhesive tape discarded, and a second ultra-sound scan was performed to assess the state of the sample. If no default was spotted, the laser intensity would be increased and the whole process started again, on the same location. The only variable input is the laser intensity, thefinal result being the sample opening threshold (Fig. 6). Water trickles were generated on both sides of the sample to properly confine the shot.
A laser was focused to a spot of 8 mm, allowing laserflux up to 1.3 GW/cm2per beam. Starting from 0.11 GW/cm2per beam, the laser intensity was increased by steps of 0.15 GW/cm2. The coupon samples
where symmetrical, so no time delay had to be calculated in this case. For ultrasonic testing, a 32 elements linear probe was used, with a frequency of 5 MHz. CFRPs act as a low-passfilter, limiting the probe scanning frequency. The sample is composed of three different layers: a CFRP laminate, the adhesive bond, and the second CFRP laminate. Each one of these layers has a specific material impedance that is detected by ultrasounds.Fig. 7(a) is a typical signal obtained for a sound sample. The upper signal is a A-Scan. It is a 1D local measurement and each spike (marked 1, 2 and 3) is due to an impedance modification in the scanned part. In this case, 1 is the signal obtained when the ultrasonic wavefirst encounters the sample, 2 is the signature signal of the ad-hesive bond, and 3 is the signal obtained when ultrasounds reach the back of the sample. The lower image, called B-Scan, is a 2D cross-sec-tion cartography of the sample.
To account for the material attenuation, and to achieve the same amount of signal signature for all three spikes, the signal was numeri-cally compensated using a Time Correcting Gain (TCG) method.
Ultrasounds cannot go through empty area, typically here dis-bondings. The signal is blocked, and little to no information is available after the opening. With A-Scan, it can be spotted by a loss of amplitude of one of the echoes. For example, the A-Scan fromFig. 7(b) shows a loss of signal from the back-face echo (3) as well as a widening of the bond echo. The B-Scan confirms the damage location on the bond, and thus, the occultation of the signal below it. Each time the sample was scanned from both sides to assure no defaults were hidden by the da-maged bond.
Results for thefinger print and the di-icer contaminations are pre-sented inFig. 8. To confirm the ability of the S-LASAT to spot a specific
contamination, the measured energy required to open the faulty bond must be lower than the one obtained for the reference sample. Since data has been normalised, a contamination correctly isolated must be below the 1.0 mark (represented by the red line entitled“detection threshold” inFig. 8).
The experimental setup reduced the uncertainty of the measure to only the laser variations: there are no material uncertainties since the same spot is tested from one shot to another, the beam path is always the same and the aluminium adhesive as well as the water trickle are set up in a systematic way. For a given intensity, there is less than 0.1% of flux variation, which renders it invisible on the graph.
As the GIC and GIIC test showed, the contamination of the sample modified the adherence strength of the sample. The S-LASAT showed the same results: a contaminated bond requires less laser intensity loading to be opened than a healthy one. The same observation was made for both contaminations.
In the case of thefinger print sample, the technique did not differ-entiate the three levels of contamination. However, unlike standard mechanical tests that apply a constant load increase, the LASAT was performed using a load step, limiting the results’ accuracy. A smaller intensity step size could give more precise results. However, even with Fig. 6. Block scheme of the experimental procedure.
such intervals, the technique was able to differentiate the second and third level of the de-icer contamination.
In comparison with the results obtained with the previous setup
[13], a clear difference is now made between a reference sample and the contaminated one. The new method to define threshold used to avoid heterogeneity greatly improved the results for the finger print contamination.
Put into perspective, these two studies show the level of control for the process to properly function. However, once reached, this degree of mastery allows for a good detection of weak bonds.
4.2. Damage analysis
Important differences have been spotted however when comparing the damage patterns of the repair and production reference samples. In the production reference sample, the disbonding seemed to propagate mainly between the epoxy from the pre-impregnated CRFP and the
bond (Fig. 9(a)). However, cracks appeared primarily in the centre of the bond for a repair sample (Fig. 9(b)). The difference of bonding
surfaces (CFRPfibres vs epoxy) could explain this variance as well as the presence of the knit carrier within the production bond.
Following the same study process, micrographs where realised on both sets of contaminated samples. The damage inside the FP con-taminated samples was similar to the one observed before: creation of a disbonding between the epoxy from the pre-impregnated CFRP and the bond. However, no clear crack pattern was found for DI samples, in-stead microcracks were observed. This type of defect is harder to detect using linear ultrasounds and may not be spotted in the case of a lower contamination. A closer study of the specimen also revealed particles probably from the Safeway KF (Fig. 9(c)).
For all samples, the damage location as well as the particles were mainly found towards the contaminated area, and right below the area where the laser shock was done. No delamination was found inside the CFRP laminate, confirming the observations made by ultrasounds. Fig. 8. Normalised results comparison between S-LASAT and the mechanical tests for: (a) the production reference sample (P-RE) and the three levels offinger print contamination, low (P-FP-1), medium (P-FP-2) and high (P-FP-3)– (b) the repair reference sample (R-RE) and the three levels of de-icing fluid.
Fig. 9. Photomicrographs of the bond after damage created by S-LASAT: (a) production reference sample[13], (b) repair reference sample[13], and (c) highest degree of de-icingfluid contamination.
5. Application on real aircraft parts 5.1. Parts’ geometry
A350 panels have been produced/recovered to test the technique using real parts. The production sample is an 800 × 800 × 1.5 mm CFRP plate on which two 700 × 50 × 1.7 CFRP stiffeners were bonded (Fig. 10). The plate is made of 14 prepreg layers with the following lay-up: [+45/90/0/90/+45/0/90]s. On one half, the stiffeners have been
bonded without contamination, and on the other half of the plate both the de-icingfluid and the finger print solution have been applied on the stiffeners’ surface before the bond. The goal will be to assess the quality of the bond holding the stiffeners to the CFRP plate. Only the upper stiffener has been tested.
The repair panel has been cut out of a A350 structure. The middle part of the sample has been grinded all the way to thefibres in a conic shape. Half of the surface was contaminated with bothfinger print and de-icingfluid solutions (Fig. 11(b)). The hole created in the panel was then patched, starting from the centre to the edge, with the missing CFRP ring (cf.Fig. 11(b)) while keeping the original lay-up of the part (ring diameter and orientation inFig. 11(a)). The composite was then cured by GMI’s tool ANITA EZ0901 hot bonder.
This part had hollow stiffeners on one side, making it impossible to test in this area using a symmetrical shot configuration. It is represented by the dark bar onFig. 11(a): the darker section is the hollow part and the lighter sections on either side show the areas where the stiffener is assembled onto the panel. Thus, there is a total of three different areas on the patch. Thefirst one only features the repair patch. The S-LASAT
can be applied normally (Fig. 11(b). The second area above the hollow part was tested using the single shot setup since only one face was available. The third one features both the patch and the zone where the stiffeners have been bonded. These areas then have two bonds: the first one between the plate and the stiffener, and a second one between the plate and the repair patch. S-LASAT can be used, but the extra thickness coming from the stiffeners must be considered.
Because of the way the plate was grinded, the depth of the bond varied depending on the tested area. When the symmetrical shot was possible, the time delay between each beam had to be recalculated using Eq.(1), to assure a proper positioning of the maximum tensile strength. It varied from 0 ns to 1290 ns.
Ultrasound scans were performed by Airbus (Toulouse, France) prior to the test. The production panel did not show any default whereas the repair panel was already porous, regardless of the presence or not of contamination on the surface.
5.2. LASAT tests
These parts were too big tofit into the initial experimental setup. A robot has been installed to move the piece around, and the optics had to be rearranged (Fig. 12(a)). The water confinement was not feasible
either. Instead, a solid constraining material in the form of a thick transparent adhesive layer was used. Its confinement capabilities are comparable to the water in the intensity range 0–3 GW/cm2
. Tests on the coupon sample have also validated this choice. The sacrificial layer is the same as before.Fig. 12(b) is a picture of the production panel. Two bands of sacrificial aluminium tape were placed on the stiffener. Fig. 10. Production panel: (a) front view with laser shot position and (b) side view with specified thicknesses.
They are covered by the transparent confinement tape. The “dots” are areas that have been test using S-LASAT. This panel is ready to undergo a full ultrasonic scan tofind the opened areas.
The threshold for a healthy bond was measured on a not con-taminated area. For the repair panel two thresholds were required, one for the symmetrical setup and one for the single shot setup. To simulate a real application, both panels were shot with an energy equivalent to 80% of that required to open a healthy bond. If an opening is detected using ultrasonic scans, the area will be defined as “faulty,”, else the zone is validated. Results are summarised inFig. 13. The results for the symmetrical shots on both the production and the repair panel are re-grouped in the green section while the ones for the single shot setup are in the blue section. For each panel the reference bond threshold per setup is specified. For a given panel, results are divided into two “areas”: the contaminated one, and the one where the bonding was done properly. The number of tests realised at 80% of the threshold is specified and should be compared to the number of opened bonds. For the technique to be validated, none of tests realised over the healthy area of a panel should have resulted in an opening, while all those done on a contaminated zone should have shown signs of opening.
Tests on the repair panel revealed that the single shot setup is not appropriate for this kind of structure. Only 20% of the shots on the contaminated surface revealed a loss of bond adherence. With an un-optimized technique, and such low contamination and adherence loss,
the detection was not consistent enough to be used for certification purposes. However, 100% of the contaminated areas tested with S-LASAT were open and none of the correct bonds were damaged.
100% of detection was achieved on the production panel. None of the sound areas were open while ultrasounds revealed that the totality of the contaminated areas failed the test. These results showed the need of the symmetrical shot to properly test a sample.
6. Conclusion
In this paper, a Symmetrical Laser Shock Adhesion Test (S-LASAT) was applied on several contaminated CFRP assemblies to assess the weak bond detection capabilities of the technique. Two contaminations have been studied: de-icingfluid and finger print.
For coupon samples, two different reference thresholds were ob-tained: 0.99 GW/cm2per beam for production and 1.14 GW/cm2for repair. Each contaminated sample showed lower thresholds than their associated reference, validating the capacity of the technique to dif-ferentiate a healthy sample from a faulty coupon, given these con-tamination levels. Moreover, in the case of the de-icing fluid con-tamination, the technique also proved to be able to differentiate the first level of contamination for the other two.
When a bond was opened using S-LASAT, no damage was spotted within the laminated structures. This could not have previously been Fig. 12. (a) New experimental setup with the repair panel placed on the robot and (b) one of the stiffener of the production panel after laser shots.
Fig. 13. Results obtained for the production and the repair panels, for both S-LASAT (green) and single shot setups (blue). (For interpretation of the references to colour in thisfigure legend, the reader is referred to the web version of this article.)
achieved using the non-optimised technique [17]. Moreover, the ad-dition of DOE in the experimental greatly increased the detection capabilities, and well as the robustness of the technique[13].
Post-mortem observations showed different types of damage, de-pending on both the type of sample (production or repair) and the contamination.
A full-scale test on real aircraft parts was conducted. For the pro-duction panel, two stiffeners were bonded onto a panel. The repair part was a real A350 panel that was salvaged and fixed. Both parts were locally contaminated before the bonding.
All contaminated areas from the repair panel tested with S-LASAT have been spotted. However, due to geometric limitations, parts of the repair panel were tested with the single LASAT. Results with this technique were not good enough and further illustrated the high degree of precision required for the technique to be used efficiently to detect bond with very little adherence loss.
The production could be fully tested using only the symmetrical configuration. A 100% detection rate was achieved.
Further studies are now required to better understand the influence of chemical or physical bond contamination on its adherence proper-ties. A better understanding of these phenomena could help to better master the technique and improve the results.
To overcome certain geometrical limitations such as the one faced when studying the repair panel, a double shock-based test is currently under study and has shown good results. It relies on two laser pulses, shot at the same side of the sample. This technique also allows a good localisation of the maximum tensile stress[20].
Acknowledgment
This project has received funding from the European Union’s Horizon 2020 Research and Innovation Program under grant agreement N° 636494.
References
[1] IATA Technology Roadmap, 2013.https://www.iata.org/whatwedo/environment/ Documents/technology-roadmap-2013.pdf(accessed May 22, 2018).
[2] A. Anger, Including aviation in the European emissions trading scheme: impacts on the industry, CO2 emissions and macroeconomic activity in the EU, J. Air Transp. Manag. 16 (n.d.) 100–105.http://doi.org/10.1016/j.jairtraman.2009.10.009. [3] J.J. Lee, Can we accelerate the improvement of energy efficiency in aircraft
sys-tems? Energy Convers. Manag. 51 (2009) 189–196,https://doi.org/10.1016/j. enconman.2009.09.011.
[4] G. Marsh, Aero engines lose weight thanks to composites, Reinf. Plast. 56 (2012) 32–35,https://doi.org/10.1016/S0034-3617(12)70146-7.
[5] G. Di Franco, L. Fratini, A. Pasta, Influence of the distance between rivets in self-piercing riveting bonded joints made of carbonfiber panels and AA2024 blanks, J. Mater. 35 (2012) 342–349,https://doi.org/10.1016/j.matdes.2011.09.036. [6] S.T. Peters (Ed.), Handbook of Composites, Springer-s, 1998.http://doi.org/10.
1007/978-1-4615-6389-1.
[7] D.N. Markatos, K.I. Tserpes, E. Rau, S. Markus, B. Ehrhart, S. Pantelakis, The effects of manufacturing-induced and in-service related bonding quality reduction on the mode-I fracture toughness of composite bonded joints for aeronautical use, Composites Part B 45 (2013) 556–564,https://doi.org/10.1016/j.compositesb.
2012.05.052.
[8] M.J. Davis, D.A. Bond, The importance of failure mode identification in adhesive bonded aircraft structures and repairs, in: ICCM, Paris, 1999. http://www.iccm-central.org/Proceedings/ICCM12proceedings/site/papers/pap1056.pdf(accessed May 22, 2018).
[9] S. De Vito, E. Massera, M. Miglietta, P. Di Palma, G. Fattoruso, K. Brune, G. Di Francia, Detection and quantification of composite surface contaminants with an e-nose for fast and reliable pre-bond quality assessment of aircraft components, Sensors Actuat. B. Chem. 222 (2016) 1264–1273,https://doi.org/10.1016/j.snb. 2015.05.011.
[10] A. Helwig, K. Maier, G. Müller, T. Bley, J. Steffensky, H. Mannebach, An optoe-lectronic monitoring system for aviation hydraulicfluids, Proc. Eng. 120 (2015) 233–236,https://doi.org/10.1016/j.proeng.2015.08.585.
[11] C. Tornow, M. Schlag, L.C.M. Lima, D. Stübing, M. Hoffmann, P.-L.M. Noeske, K. Brune, S. Dieckhoff, Quality assurance concepts for adhesive bonding of com-posite aircraft structures– characterisation of adherent surfaces by extended NDT, J. Adhes. Sci. Technol. 29 (2015) 2281–2294,https://doi.org/10.1080/01694243. 2015.1055062.
[12] P.H. Malinowski, K.I. Tserpes, R. Ecault, Mechanical and Non-Destructive Study of CFRP Adhesive Bonds Subjected to Pre-Bond Thermal Treatment and De-Icing Fluid Contamination, 2018, pp. 1–11.http://doi.org/10.3390/aerospace5020036. [13] M. Sagnard, L. Berthe, R. Ecault, F. Touchard, M. Boustie, K. Brune, Development of
the symmetrical laser shock test for weak bond inspection, in: J.H. Ricky Chau, Timothy C. Germann, J. Matthew D. Lane, Eric N. Brown (Eds.), Shock Compression Condens. Matter, St. Louis, MO, USA, 2018.http://doi.org/10.1063/1.5044838. [14] M. Schlag, W. Cavalcanti, K. Brune, No Title, 2015.http://combondt.eu/(accessed
April 6, 2017).
[15] L. Berthe, A. Sollier, P. Peyre, R. Fabbro, Study of plasma induced by laser in water confinement regime: Application to laser shock processing with and without thermal protective coating, in: ICALEO 2003 - 22nd Int. Congr. Appl. Laser Electro-Optics, Congr. Proc., Jacksonville, Florida, 2003.
[16] I. Gilath, S. Eliezer, T. Bar-Noy, R. Englman, Z. Jaeger, Material response at hy-pervelocity impact conditions using laser induced shock waves, Int. Z Impact Eng. 14 (1993) 279–289 (accessed January 24, 2018),https://ac.els-cdn.com/ 0734743X93900275/1-s2.0-0734743X93900275-main.pdf?_tid=e555b0d2-00f2-11e8-a64c-00000aab0f6b&acdnat=1516790567_
fd4f18d2d9aaa2db122367dcdfda3577.
[17] R. Ecault, L. Berthe, F. Touchard, M. Boustie, E. Lescoute, A. Sollier, H. Voillaume, Experimental and numerical investigations of shock and shear wave propagation induced by femtosecond laser irradiation in epoxy resins, J. Phys. D. Appl. Phys. 48 (2015) 095501,https://doi.org/10.1088/0022-3727/48/9/095501.
[18] R. Ecault, L. Berthe, M. Boustie, F. Touchard, E. Lescoute, A. Sollier, P. Mercier, J. Benier, Observation of the shock wave propagation induced by a high-power laser irradiation into an epoxy material, J. Phys. D. Appl. Phys. 46 (2013) 235501,
https://doi.org/10.1088/0022-3727/46/23/235501.
[19] M. Boustie, R. Ecault, L. Berthe, Method of non-destructive testing comprising the generation of a state of localised and controlled traction in a multi-material and/or multi-layer assembly, PCT/FR2014/053300, 2014.https://patents.google.com/ patent/WO2015087015A2/en?q=Ecault&oq=Ecault.
[20] R. Ecault, Experimental and numerical investigations on the dynamic behaviour of aeronautic composites under laser shock - Optimization of a shock wave adhesion test for bonded composites, Poitiers, ENSMA, 2013.http://www.theses.fr/ 2013ESMA0031.
[21] M. Ghrib, L. Berthe, N. Mechbal, M. Rébillat, M. Guskov, R. Ecault, N. Bedreddine, Generation of controlled delaminations in composites using symmetrical laser shock configuration, Compos. Struct. 171 (2017) 286–297,https://doi.org/10.1016/j. compstruct.2017.03.039.
[22] E. Moutsompegka, K.I. Tserpes, P. Polydoropoulou, C. Tornow, M. Schlag, K. Brune, B. Mayer, S. Pantelakis, Experimental study of the effect of pre-bond contamination with de-icingfluid and ageing on the fracture toughness of composite bonded joints, Fatigue Fract. Eng. Mater. Struct. 40 (2017) 1581–1591,https://doi.org/10.1111/ ffe.12660.
[23] E. Moutsompegka, K. Tserpes, K. Brune, M. Schlag, S. Pantelakis, The effect of pre-bond contamination withfingerprint and ageing on the fracture toughness of composite bonded joints, in: 6th EASN Int., Porto, 2016.
![Fig. 9. Photomicrographs of the bond after damage created by S-LASAT: (a) production reference sample [13], (b) repair reference sample [13], and (c) highest degree of de-icing fl uid contamination.](https://thumb-eu.123doks.com/thumbv2/123doknet/7419047.218895/7.892.107.796.790.1072/photomicrographs-damage-created-production-reference-reference-highest-contamination.webp)