PROPOSED 2012-2013 PROGRAM-BUDGET
Main Document
San Jose, Costa Rica
IICA/JIA/Doc. 349 (11)
Original: español
19-21 octubre 2011
Contents
I.
INTRODUCTION ... 1
II.
STRATEGIC GUIDELINES FOR THE 2012-2013 BIENNIUM... 2
III.
OVERALL BUDGET FOR 2012 – 2013 ... 2
IV.
TECHNICAL COOPERATION SERVICES FOR 2012-2013 ... 3
V.
ALLOCATION OF REGULAR FUND RESOURCES BY CHAPTER ... 4
VI.
ALLOCATION OF REGULAR FUND RESOURCES BY TECHNICAL CONCENTRATION PROGRAM ... 6
I. Introduction
This present IICA Program Budget for the 2012-2013 biennium is
the proposal approved by the Executive Committee at its Thirty-first
Regular Meeting in Resolution IICA/CE/Res.540 (XXI-O/11), dated
July 13, 2011, for presentation to the Inter-American Board of
Agriculture (IABA).
This 2012-2013 Program Budget proposal is based on a scenario
involving adjustments to the budget and, consequently, a reduction in
the Institute’s current levels of operation. The principal criteria of the
proposal are:
• The importance of ensuring that the Institute remains a viable
technical cooperation instrument of the Member States, one
that supports their efforts to achieve the sustainable
development of agriculture, promote food security and
reduce poverty;
• The need to gradually restore the Institute’s financial
capacity, as a means of enhancing the cooperation services it
provides to its Member States;
• The advisability of ensuring that the Institute has greater
capacity to respond to the growing demand for cooperation
services generated by the new challenges facing agriculture
in the Member States;
• To slow the loss of purchasing power of the quotas of the
Member States;
• To capitalize on the major efforts made by the Institute to
reduce operating and personnel costs, thereby increasing
efficiency;
• To accept the fact that alternative sources of financing used
in the past, such as recovery of quotas arrears and
miscellaneous income, no longer exist; and
• To promote the policy established by the current
administration calling for an increase in the Institutional Net
Rate (INR), used to cover the incremental costs generated in
the administration of externally funded project. This strategy
is expected to produce it first results in the medium term
Bases of the Program Budget
• Allocation of basic quotas without including increases, and
application of the new quota scale approved by the OAS for
2012 in General Assembly Resolution AC/RES. 2696
(XLI-O/11), dated June 17, 2011.
• Contributions of over-quotas from Argentina and Guatemala,
whose 2011 remains unchanged despite the reduction in their
percentage shares of the quota budget, due to the change the
quota scale adopted by the OAS, and from Mexico and
Uruguay, which accepted an increase of 4.7% for each year
of the biennium in recognition of the effect of inflation on
the Institute; in accordance with Executive Committee
Resolution IICA/CE/Res.540 (XXI-O/11), dated July 13,
2011.
• Contributions of over-quotas from El Salvador, Panama and
Paraguay, in recognition of the effect of 4.7% annual
inflation on the Institute, in accordance with pledges made
by those Member States following the Regular Meeting of
the Executive Committee.
• Maintenance of the amount of Miscellaneous Income at
US$6,100,000 per year, financed with US$3,500,000 in such
income expected to be generated and US$2,600,000 in the
Miscellaneous Income Fund.
This level of budget allocation makes it necessary to finance
shortfalls of US$1,874,402 in 2012 and an additional US$712,625 in
2013, which will be covered by:
• Reducing operating costs by US$741,400 in 2012 (6.2%) and
US$597,700 (5.3%) in 2013; and
• Eliminating six professional personnel positions in the
following areas: Biotechnology and Biosafety, Clean Energy,
Risk Reduction and Management in Agriculture and
Agribusiness, and Formulation of Technical Cooperation
Projects. These reductions in personnel positions are in
addition to the ten local personnel positions being eliminated
as a result of organizational adjustments and improvements
in processes that have led to greater efficiency.
II. Strategic guidelines for the 2012-2013 biennium
In implementing the 2010-2014 MTP, IICA will focus its
cooperation efforts on four Technical Concentration Programs and
two Programs for Cross-cutting Coordination that dovetail with the
strategic objectives outlined in the MTP; on the Center for Strategic
Analysis for Agriculture, which supplies the programs with strategic
information on sectoral issues; on the promotion of projects for the
countries; and arranging for visiting professionals to strengthen the
technical cooperation the Institute provides.
The Technical Concentration Programs, which are institutional in
nature, are as follows:
• Innovation for productivity and competitiveness
• Agricultural health and food safety
• Agribusiness and commercialization
• Agriculture, territories and rural well-being
The Programs for Cross-cutting Coordination are:
• Agriculture, natural resource management and climate change
• Agriculture and food security
These Programs are implemented through IICA technical cooperation
projects, which, in the case of the Offices in the Member States,
dovetail with the technical cooperation strategies agreed upon with
the relevant authorities.
III. Overall Budget for 2012 – 2013
The Institute finances its technical cooperation activities, mandated by
Governing Bodies, with resources from the Regular Fund, which is
made up of Member State quotas and miscellaneous income, basically
obtained from financial yields, tax recovery and the sale of assets and
certain services. In addition, the Institute complements its technical
cooperation actions with the implementation of programs and projects
financed with external resources, based on agreements signed with
partners or counterparts. The management of external resources
demands the time of additional technical and administrative personnel,
increasing operating costs. These additional costs are covered by the
Institutional Net Rate (INR) that counterparts agree to pay IICA.
It is estimated that the external resources will amount to US$158.5
million in 2012 and US$141.3 million in 2013. Preliminary calculation
of INR resources for those years is US$10.2 and US$9.6 million,
respectively.
The final allocation of INR resources is subject to the signing of
agreements for the implementation of externally funded programs and
projects, and to the projection of INR resources to be generated as a
result of those agreements.
The proposed Regular Fund budget, based on adjustments in current
levels of technical cooperation services, has been calculated based on the
following premises:
• To reduce by 6.2% the amount of resources allocated to cover
operating costs in 2012, with respect to the 2011 Program Budget;
• To reduce the number of international professionals from 93 to
88, with a reduction in costs of 0.9% in 2012 and an increase of
1.7% in 2013, due to expected variations in post adjustments; and,
• To reduce the number of local personnel from 370 to 359, with an
annual increase in costs due to salary increases of 12.7% in 2012
and 4.8% in 2013, required by law, and given the need to
maintain the Institute’s current position in local labor markets and
offset the effects of unfavorable exchange rate movements in
some countries.
In this proposal, the Regular Fund budget amounts to US$33,789.6
thousand for 2012, made up of US$27,689.6 thousand in Member State
quotas and US$6,100.0 thousand in miscellaneous income. For 2013,
the Regular Fund budget is US$33,909.4 thousand, composed of
US$27,809.4 in Member State quotas and US$6,100.0 thousand in
miscellaneous income.
The variation in the quota budget is based on partial recognition of
inflation, 1.4% in 2012 and 0.4% in 2013,
1and is financed with the
over-quotas contributed by Argentina, El Salvador, Guatemala, Mexico,
Panama, Paraguay and Uruguay. At the same time, by applying the new
percentage distribution of the quotas approved by the OAS, some
Member States modify their contributions.
The overall budget for 2012-2013 is shown in Table A below, which
also as Table No. 1 of the attachment.
2011 2012 2013
REGULAR FUND:
QUOTAS OF MEMBER STATES 27,298.2 27,689.6 27,809.4
MISCELLANEOUS INCOME 6,100.0 6,100.0 6,100.0
TOTAL REGULAR FUND 33,398.2 33,789.6 33,909.4
EXTERNAL RESOURCES FOR PROGRAMS AND PROJECTS* 154,582.0 158,451.6 141,274.6
INSTITUTIONAL NET RATE 10,097.3 10,228.4 9,628.9
198,077.5
202,469.6 184,812.9
*/ Estimates. Final figures will depend on the agreements signed.
2011 and 2012 - 2013 Program Budget
Table A
(US$ x 000) RESOURCES BY SOURCE TOTALOverall Budget
1
Inflation is estimated at 4.7% annually, as explained in the introduction to this document.
The Kingdom of Spain contributes an annual quota of US$60,000 as
an Associate State, as per an agreement reached in the First Plenary
Session of the Eleventh Regular Meeting of the Inter-American
Board of Agriculture, held on November 26, 2001, in Bavaro,
Dominican Republic.
Table No. 2, which is attached to the present document, indicates the
scale of percentage contributions of the Member States, in keeping
with the new distribution approved by the OAS and the contributions
of over-quotas from the Member States mentioned above.
Table No. 3 shows the variations in the Regular Fund budget for the
years 2011, 2012 and 2013. As can be seen in this table, the Member
States’ quota contributions increase by 1.4% in 2012 and 0.4% in
2013, due primarily to the contributions of over-quotas from the
some countries.
Tables No. 4.a and 4.b detail the proposed allocation of the Program
Budget for 2012-2013 by Programming Center, in accordance with
the guidelines of the 2010-2014 Medium Term Plan.
The Permanent Office for Europe, located in Madrid, Spain, is
funded with US$100,000 in INR resources per year.
Table No. 5 summarizes the evolution of the Regular Fund budget
since 1994 and the proposal for the 2012-2013 biennium, with the
amounts indicated previously.
IV. Technical cooperation services for 2012-2013
Resources are budgeted in accordance with the guidelines of the
2010-2014 Medium Term Plan, the Technical Cooperation Strategies
agreed upon with the governments of the Member States, and the
Institute’s technical cooperation projects approved by the pertinent
bodies of the General Directorate.
Furthermore, to facilitate and enhance the delivery of technical
cooperation services, the operating units have prepared a
Management Strategy that defines objectives, expected results and
achievement indicators.
Appendix 1 presents the objectives, expected results and
achievement indicators of IICA’s Projects and of the Management
Strategies of the operating units.
V. Allocation of Regular Fund Resources by
Chapter
The Institute’s budget is divided into four Chapters:
ο Chapter I: Direct Technical Cooperation Services
ο Chapter II: Management Costs
ο Chapter III: General Costs and Provisions
ο Chapter IV: Renewal of Infrastructure and Equipment
Table No. 6 shows the proposed allocation of Regular Fund
resources by Chapter.
Chapter I: Direct Technical Cooperation Services
This chapter includes the costs of the Institute’s technical
cooperation actions at the national, regional and hemispheric
levels required to achieve the objectives defined in the Medium
Term Plan. It includes IICA’s contribution to the Tropical
Agriculture Research and Higher Education Center (CATIE) and
the Caribbean Agricultural Research and Development Institute
(CARDI), resources to finance projects focused on the Member
States, the costs of the Center for Strategic Analysis for
Agriculture (CSAFA) and the Information and Communication
Technologies (ICTs) Unit. The resources allocated for this chapter
are as follows:
Table B
Chapter I: Direct Technical Cooperation Services
Regular Fund
(US$)
Source
2011
2012
2013
Quotas
23,996,054
24,362,234
24,629,768
Miscellaneous
5,668,560
5,801,991
5,801,991
Total
29,664,614
30,164,225
30,431,759
The resources of the Regular Fund allocated to technical
cooperation increase from 88.8% in 2011 to 89.3% in 2012 and
89.7% in 2013. Thanks to improvements in the administration of
the budget, it is possible allocate more resources to direct technical
cooperation services (see Table No. 6).
Chapter II: Management Costs
Management Costs include the resources of the units responsible
for managing the Institute and providing support services. Those
units, which are located at Headquarters, are the Office of the
Director General and the Secretariat of Corporate Services.
For the purposes of Chapter II, the Office of the Director General
includes: the Office of the Director General, the Office of the
Deputy Director General, the Coordination of the Office of the
Director General, the Internal Audit Unit, the Legal Services Unit
and the Social Communication Unit.
The Secretariat of Corporate Services includes the Office of the
Secretary of Corporate Services, and the services related to finance,
human resources, programming, budget and general services. These
resources also include Headquarters costs related to security,
electricity, maintenance of buildings and grounds, etc.
The resources that these units use to renew their infrastructure and
equipment (Chapter IV) are not included. The resources allocated
for this chapter are:
Table C
Chapter II: Management Costs
(US$)
Source
2011
2012
2013
Quotas
1,631,376
1,702,312
1,741,578
Miscellaneous
77,783
67,738
67,738
Total
1,709,159
1,770,050
1,809,316
The resources allocated to management costs account for 5.2% and
5.3% of the Regular Fund in the years 2012 and 2013, respectively.
(See Table No. 6).
Chapter III: General Costs and Provisions
General Costs and Provisions are general commitments not directly
related to the preceding chapters or to a specific Unit. They include
funding for the Governing Bodies; institutional insurance;
contribution to the OAS Administrative Tribunal and the OAS
Retirement and Pension Fund; External Audit; pensions of former
Directors General; and the Emergency Assistance Fund for IICA
Personnel.
The resources for this chapter are:
Table D
Chapter III: General Costs and Provisions
(US$)
Source
2011
2012
2013
Quotas
1,274,952
1,224,681
1,224,681
Miscellaneous
50,000
20,000
20,000
Total
1,324,952
1,244,681
1,244,681
The resources allocated to general costs and provisions account for
3.7% of the Regular Fund in 2012 and 2013. For 2011, the figure is
4% (see Table No. 6). The reduction of US$80,271 in this chapter can
be attributed to economies achieved in Institute insurance costs and
the Emergency Assistance Fund for IICA Personnel.
Chapter IV: Renewal of Infrastructure and Equipment
The budget items included in this chapter are maintenance of
IICA-owned properties and buildings and the renewal of vehicles,
equipment and computer licenses.
Table E
Chapter IV: Renewal of Infrastructure and Equipment
(US$)
Source
2011
2012
2013
Quotas
395,857
400,373
213,373
Miscellaneous
303,657
210,271
210,271
These resources allocated to renew infrastructure and equipment,
decrease from 2.1% of the Regular Fund in 2011 to 1.8% in 2012 and
1.2% in 2013. This is the Chapter most impacted negatively by the
cutbacks of US$88,870 in 2012 and an additional US$187,000 in
2013 (see Table No. 6).
Personnel and Operating Costs for 2012-2013 financed with
resources from the Regular Fund
Table No. 7 shows: i) allocations by groups of objects of expenditure
(International Professional Personnel, Local Professional Personnel,
General Services Personnel and Operating Costs); ii) the number of
personnel positions, by category and classification; and, iii) the
sources of financing.
This table shows the amount allocated to cover the costs of
International Professional Personnel, which drops from
US$11,710,011 in 2011 to 11,608,935 (-0.9%) in 2012 and
US$11.802.843 (+1.7%) in 2013. Local Professional Personnel
positions are financed with US$6,417,784 in 2011, US$7,217,020
(+12.5%) in 2012 and US$7,579,312 (+5%) in 2013. General
Services Personnel positions cost US$3,320,616 in 2011, which
increases to US$3,755,255 (+13.1%) in 2012 and to US$3,916,580
(+4.3%) in 2013.
Operating costs total US$11,949,828 in 2011, US$11,208,390
(-6.2%) in 2012 and US$10,610,665 (-5.3%) in 2013. There are five
fewer international professional personnel positions, six fewer local
professional positions and five fewer general service positions in the
2012-2013 biennium than in 2011.
VI. Allocation of Regular Fund Resources by
Technical Concentration Program
As noted in Section II of this document, the Institute’s technical
cooperation actions are provided under technical concentration
programs, namely:
• Innovation for productivity and competitiveness
• Agricultural health and food safety
• Agribusiness and commercialization
• Agriculture, territories and rural well-being
For the 2012-2013 biennium, the Regular Fund resources
corresponding to Chapter I: Direct Technical Cooperation Services
are allocated to technical projects and actions in one or more of the
Technical Concentration Programs. (See Table No. 6).
In 2012 and 2013, 29.1% of the resources are allocated for actions
related to the Innovation for Productivity and Competitiveness
Program; 25.0% in 2010 and 24.8% in 2013 for the Agricultural
Health and Food Safety Program; 24.7% and 24.8% in 2012 and
2013 for the Agribusiness and Commercialization Program; and
21.2% and 21.3% for 2012 and 2013, respectively for the
Agriculture, Territories and Rural Well-being Program.
VII. Allocation of Regular Fund Resources by Major
Object of Expenditure
Table F, which appears as Table No. 9 in the attachment, shows the
distribution of the Regular Fund for the 2012-2013 biennium by
Major Object of Expenditure (MOE), and the distribution approved
in the 2011 Program Budget, for the purpose of comparison, are
presented.
US$ x 000 % US$ x 000 % US$ x 000 %
1 International Professional Personnel 11,710.0 35.1% 11,608.9 34.4% 11,802.8 34.8% 2 Local Professional and General Services Personnel 9,738.4 29.2% 10,972.3 32.5% 11,495.9 33.9%
21,448.4 64.2% 22,581.2 66.8% 23,298.7 68.7%
3 Training and Technical Events 1,349.0 4.0% 1,332.0 3.9% 1,171.0 3.5% 4 Official Travel 1,693.3 5.1% 1,245.6 3.7% 1,234.3 3.6% 5 Documents and Materials and Supplies 1,074.7 3.2% 914.7 2.7% 914.7 2.7% 6 Plant, Equipment and Furniture 699.5 2.1% 610.6 1.8% 423.6 1.2% 7 General Services 2,833.3 8.5% 2,906.0 8.6% 2,856.2 8.4% 8 Performance Contracts and Transfers* 3,464.7 10.4% 3,377.2 10.0% 3,188.6 9.4%
9 Other Costs 835.3 2.5% 822.3 2.4% 822.3 2.4%
11,949.8 35.8% 11,208.4 33.2% 10,610.7 31.3% 33,398.2 100.0% 33,789.6 100.0% 33,909.4 100.0%
2013
Table F
Resources of the Regular Fund by Major Object Expenditure
SUBTOTAL PERSONNEL COSTS
SUBTOTAL OPERATING COSTS GRAND TOTAL
Major Objet of Expenditure 2011 2012
*/ Includes US$1,000,000 for CATIE
.
Figure A shows the relative weight of each major object of
expenditure for 2010 and 2013.
It is important to note that, because the level of the Regular Fund will
be maintained, personnel costs will increase from 64.2% in 2011 to
66.8% in 2012 and 68.7% in 2013.
Table No. 8 details for each major object of expenditure the items of
which it is composed, in monetary and percentage terms, making it
easier to understand the purposes of each one.
Table No. 9 shows the absolute and relative variations in each of the
Major Objects of Expenditure in the period 2011-2013.
As can be seen, the amount budgeted for international personnel
decreases by 0.9% in 2012 as a result of: the reduction of five
positions, a partial adjustment of 3% over the base salary for inflation
and the effect of post adjustments in 2011 and 2012. In 2013, the
adjustment will be 1.7%, resulting from the expected variations in the
post adjustment, which is affected by variables such as local inflation
and exchange rate movements.
In the case of local personnel, it is estimated that costs will rise by
12.7% in 2012 as the result of an estimated increase of 7% in 2011
and 5.7% in 2012 (with the reduction of eleven positions) due to
salary increases required by law, to the need to be competitive in
national labor markets in order to reduce staff turnover rates, which
in recent years have been 11% (more than on variation per week),
and to the negative effects of exchange rate movements attributable
to the revaluation of some local currencies. These effects are
expected to fall to 4.8% in 2013.
Table No. 10 shows staff positions financed with resources from the
Regular Fund between 1992 and 2013. For the 2010-2013 biennium,
the Institute plans to finance 88 international professionals (reduction
of five positions), 151 local professionals (reduction of six positions)
and 208 general services positions (reduction of five positions).
Operating costs will be 6.2% lower in 2012 than in 2011, and 5.3%
in 2013. The items that would suffer the largest cuts in 2012 are:
“Official Travel” (-26.4%), “Documents and Materials and Supplies”
(-14.9%), and “Plant, Equipment and Furniture” (-12.7%), for a total
reduction of US$741,400. The items that would suffer the largest
cuts in 2013 are: “Training and Technical Events” (-12.1%), “Plant,
Equipment and Furniture” 30.6%) and “Performance Contracts”
(-5.6%), for a total reduction of US$597,700.
FIGURE A
DISTRIBUTION OF THE REGULAR FUND BY MAJOR OBJECT OF EXPENDITURE 2012-2013
34.8%
33.9%
3.5%
3.6%
2.7%
1.2%
8.4%
9.4%
2.4%
34.4%
32.5%
3.9%
3.7%
2.7%
1.8%
8.6%
10.0%
2.4%
1. International
Personnel
2. Local Personnel
3. Training and Technical
Events
4. Official Travel
5. Documents and
Materials and Supplies
6. Plant, Equipment and
Furniture
7. General Services
8. Performance
Contracts and Transfers
9. Other Costs
4
1
2
3
5
7
8
9
6
2012
1
2
3
4
7
8
9
6
5
2013
LIST OF TABLES ATTACHED
Table No. 1
Overall Budget. 2011 and 2012-2013 Program Budgets. In thousands of US dollars.
Table No. 2
Quota Scale of the Member States Based on the OAS Quota Scale for 2012. Contributions of over-quotas and Miscellaneous
Income (US$).
Table No. 3
Regular Fund Budget. 2011 and 2012-2013 Program Budgets. In thousands of US dollars.
Table No. 4.a
Budget of the Regular Fund by Programming Center. 2012 - US$
Table No. 4.b
Budget of the Regular Fund by Programming Center. 2013. In thousands of US dollars.
Table No. 5.
Evolution of the Regular Fund in Nominal Values. 1994-2011 and 2012-2013. In thousands of US dollars
Table No. 6
Allocation of the Regular Fund by Chapter. US$
Table No. 7
Overall Allocation of the Regular Fund: Quotas and Miscellaneous Income. US dollars and Number of Staff Positions.
Table No. 8
Structure of the Major Objects of Expenditure of the Regular Fund. In thousands of US dollars and %
Table No. 9
Relative Weight and Evolution of MOEs of the Regular Fund. 2011 and 2012-2013 Program Budgets. In thousands of US
dollars and %
Table No. 1
2012 - 2013
Program Budget
2011 2012 2013
REGULAR FUND:
QUOTAS OF MEMBER STATES 27,298.2 27,689.6 27,809.4 MISCELLANEOUS INCOME 6,100.0 6,100.0 6,100.0 TOTAL REGULAR FUND 33,398.2 33,789.6 33,909.4 EXTERNAL RESOURCES FOR PROGRAMS AND PROJECTS* 154,582.0 158,451.6 141,274.6 INSTITUTIONAL NET RATE 10,097.3 10,228.4 9,628.9
198,077.5
202,469.6 184,812.9 RESOURCES BY SOURCE
TOTAL
*/ Estimates. Final figures will depend on the agreements signed.
Overall Budget
2011 and 2012 - 2013 Program Budget
(US$ x 000)
Table No. 2
2012 OEA
ASSESSED
QUOTA OVER- QUOTA TOTAL QUOTAS
ASSESSED QUOTA
OVER-
QUOTA TOTAL QUOTAS
US$3 US$3 US$3 US$3 US$3 US$3 US$ % US$ %
Antigua and Barbuda 0.022 6,052 0.022 0.022 6,100 0 6,100 0.022 6,100 0 6,100 48 0.8% 0 0.0%
Argentina 3.211 883,304 2.408 2.408 662,400 220,900 883,300 2.408 662,400 220,900 883,300 -4 0.0% 0 0.0% Bahamas 0.077 21,182 0.062 0.062 17,100 0 17,100 0.062 17,100 0 17,100 -4,082 -19.3% 0 0.0% Barbados 0.060 16,505 0.045 0.045 12,400 0 12,400 0.045 12,400 0 12,400 -4,105 -24.9% 0 0.0% Belize 0.022 6,052 0.022 0.022 6,100 0 6,100 0.022 6,100 0 6,100 48 0.8% 0 0.0% Bolivia 0.046 12,654 0.049 0.049 13,500 0 13,500 0.049 13,500 0 13,500 846 6.7% 0 0.0% Brazil 7.953 2,187,765 9.941 9.941 2,734,600 0 2,734,600 9.941 2,734,600 0 2,734,600 546,835 25.0% 0 0.0% Canada 13.761 3,785,469 11.972 11.972 3,293,300 0 3,293,300 11.972 3,293,300 0 3,293,300 -492,169 -13.0% 0 0.0% Chile 1.073 295,168 1.189 1.189 327,100 0 327,100 1.189 327,100 0 327,100 31,932 10.8% 0 0.0% Colombia 0.839 230,798 1.049 1.049 288,600 0 288,600 1.049 288,600 0 288,600 57,802 25.0% 0 0.0% Costa Rica 0.187 51,441 0.221 0.221 60,800 0 60,800 0.221 60,800 0 60,800 9,359 18.2% 0 0.0% Dominica 0.022 6,052 0.022 0.022 6,100 0 6,100 0.022 6,100 0 6,100 48 0.8% 0 0.0% Dominican Republic 0.206 56,668 0.257 0.257 70,700 0 70,700 0.257 70,700 0 70,700 14,032 24.8% 0 0.0% Ecuador 0.207 56,943 0.258 0.258 71,000 0 71,000 0.258 71,000 0 71,000 14,057 24.7% 0 0.0% El Salvador 0.105 28,884 0.114 0.114 31,400 1,500 32,900 0.114 31,400 3,000 34,400 4,016 13.9% 1,500 4.6% Grenada 0.022 6,052 0.022 0.022 6,100 0 6,100 0.022 6,100 0 6,100 48 0.8% 0 0.0% Guatemala 0.187 51,441 0.168 0.168 46,200 5,200 51,400 0.168 46,200 5,200 51,400 -41 -0.1% 0 0.0% Guyana 0.022 6,052 0.022 0.022 6,100 0 6,100 0.022 6,100 0 6,100 48 0.8% 0 0.0% Haiti 0.045 12,379 0.034 0.034 9,400 0 9,400 0.034 9,400 0 9,400 -2,979 -24.1% 0 0.0% Honduras 0.045 12,379 0.051 0.051 14,000 0 14,000 0.051 14,000 0 14,000 1,621 13.1% 0 0.0% Jamaica 0.123 33,836 0.093 0.093 25,600 0 25,600 0.093 25,600 0 25,600 -8,236 -24.3% 0 0.0% Mexico 8.141 2,239,482 8.281 8.281 2,278,000 105,300 2,383,300 8.281 2,278,000 217,300 2,495,300 143,818 6.4% 112,000 4.7% Nicaragua 0.045 12,379 0.034 0.034 9,400 0 9,400 0.034 9,400 0 9,400 -2,979 -24.1% 0 0.0% Panama 0.163 44,839 0.158 0.158 43,500 2,000 45,500 0.158 43,500 4,100 47,600 661 1.5% 2,100 4.6% Paraguay 0.124 34,111 0.093 0.093 25,600 1,200 26,800 0.093 25,600 2,500 28,100 -7,311 -21.4% 1,300 4.9% Peru 0.553 152,123 0.688 0.688 189,300 0 189,300 0.688 189,300 0 189,300 37,177 24.4% 0 0.0%
Saint Kitts and Nevis 0.022 6,052 0.022 0.022 6,100 0 6,100 0.022 6,100 0 6,100 48 0.8% 0 0.0%
Saint Lucia 0.022 6,052 0.022 0.022 6,100 0 6,100 0.022 6,100 0 6,100 48 0.8% 0 0.0%
Saint Vincent and the Grenadines 0.022 6,052 0.022 0.022 6,100 0 6,100 0.022 6,100 0 6,100 48 0.8% 0 0.0%
Suriname 0.045 12,379 0.034 0.034 9,400 0 9,400 0.034 9,400 0 9,400 -2,979 -24.1% 0 0.0%
Trinidad and Tobago 0.152 41,813 0.180 0.180 49,500 0 49,500 0.180 49,500 0 49,500 7,687 18.4% 0 0.0%
United States of America 59.470 16,359,412 59.470 59.470 16,359,400 0 16,359,400 59.470 16,359,400 0 16,359,400 -12 0.0% 0 0.0%
Uruguay 0.181 49,791 0.214 0.214 58,900 2,300 61,200 0.214 58,900 5,200 64,100 11,409 22.9% 2,900 4.7% Venezuela 2.060 566,679 2.186 2.186 601,300 0 601,300 2.186 601,300 0 601,300 34,621 6.1% 0 0.0% SUB TOTAL 99.235 27,298,239 99.425 99.425 27,351,200 338,400 27,689,600 99.425 27,351,200 458,200 27,809,400 391,361 1.4% 119,800 0.4% Cuba 0.765 210,441 0.575 0.575 158,200 0 158,200 0.575 158,200 0 158,200 -52,241 -24.8% 0 0.0% TOTAL CUOTAS 100.000 27,508,680 100.000 100.000 27,509,400 338,400 27,847,800 100.000 27,509,400 458,200 27,967,600 339,120 1.2% 119,800 0.4% INGRESOS MISCELANEOS 2 6,100,000 6,100,000 6,100,000 0 0.0% 0 0.0%
TOTAL FONDO REGULAR4
33,398,239 33,789,600 33,909,400 391,361 1.2% 119,800 0.4%
1/ As per Resolution AG/RES. 2696 (XLI-O/11), of the OAS General Assembly of June 7th, 2011.
2/ In 2010 and 2011 miscellaneous income will comprise US$3,500,000 to be generated and US2,600,000 from the Miscellaneous Income Fund. 3/ Rounded off to the nearest one hundred.
2012-2013
Program Budget
Status of Member State Quotas based on the 2012 OAS Quota Scale
1. Contributions of Over-quotas and Miscellaneous Income (US$)
2012-2011 2013-2012 MEMBER STATES
2011 2012 2013
Note: The Kingdom of Spain contributes and annual quota of US$60,000 as an Associate State, as per an agreement reached in the First Plenary Session of the Eleventh Regular Meeting of the Inter-American Board of Agriculture, held on November 26, 2001, in Bavaro, Dominican Republic.
IICA IICA IICA
% US$ % % %
Table No. 3
2012 - 2013
Program Budget
APPROVED
2011 2012 2013 US$ % US$ %
REGULAR FUND:
QUOTAS OF MEMBER STATES 27,298.2 27,689.6 27,809.4 391.4 1.4% 119.8 0.4%
MISCELLANEOUS INCOME 6,100.0 6,100.0 6,100.0 0.0 0.0% 0.0 0.0%
TOTAL REGULAR FUND 33,398.2 33,789.6 33,909.4 391.4 1.2% 119.8 0.4%
RESOURCES BY SOURCE
Budget of the Regular Fund
2011 and 2012 - 2013 Program Budget
(US$ x 000)
BUDGET VARIATIONS
PROPOSED 2012 - 2011 2013 - 2012
Table No. 4.a
Program Budget
IPP
No. IPP US$ LPP No. LPP US$ GSP No. GSP US$ Total Personnel No. Total Personnel US$ Operating Cost TOTAL REGULAR FUND I TECHNICAL COOPERATION 80 10,137,095 147 7,031,466 194 3,509,195 421 20,677,755 9,795,720 30,473,475 A. Office of the Director of Technical Cooperation 1 145,824 1 87,763 1 20,831 3 254,419 80,000 334,419
Office of the Director of Technical Cooperation 1 145,824 1 87,763 1 20,831 3 254,419 80,000 334,419 B. TECHNICAL CONCENTRATION PROGRAMS 29 3,574,566 16 682,321 9 206,872 54 4,463,758 1,203,000 5,666,758 1. Innovation for Productivity and Competitiveness Program 11 1,376,387 8 271,397 3 64,749 22 1,712,533 506,000 2,218,533
Program Management 2 269,458 - - 1 23,426 3 292,884 16,500 309,384
Hemispheric Projects 4 493,433 7 252,935 1 17,947 12 764,315 252,500 1,016,815
Regional Projects: 5 613,497 1 18,462 1 23,376 7 655,335 237,000 892,335
Regional Cooperative Program for the Protection and Modernization of Coffee Cultivation in Central America, Panama and the Dominican Republic - PROMECAFE
1
105,405 - - - - 1 105,405 - 105,405
Support to Caribbean Agricultural Research and Development
Institute - CARDI - - - - - - - - 200,000 200,000 Cooperative Agricultural Research and Technology Transfer
Program for the Andean Subregion - PROCIANDINO 1 123,613 - - - - 1 123,613 - 123,613 Cooperative Program for the Development of Agricultural
Technology in the Southern Cone - PROCISUR 1 126,213 1 18,462 1 23,376 3 168,051 5,000 173,051 Cooperative Program on Research and Technology Transfer for the
South American Tropics - PROCITROPICOS 1 136,249 - - - - 1 136,249 - 136,249 Cooperative Program in Research and Technology for the Northern
Region - PROCINORTE 1 122,017 - - - - 1 122,017 27,000 149,017 Support to the System for the Central America Agricultural
Technology Integration System - SICTA - - - - - - - - 5,000 5,000
2. Agricultural Health and Food Safety Program 6 730,026 3 147,012 2 31,057 11 908,095 284,000 1,192,095
Program Management 1 138,083 - - 1 18,526 2 156,609 75,500 232,109
Hemispheric Projects 5 591,942 3 147,012 1 12,531 9 751,486 128,500 879,986
Regional Projects - - - - - - - - 80,000 80,000
Support to the Development and Strengthening of National Agricultural Health Systems in the Countries of the Southern Cone to Facilitate International Agricultural Trade - COSAVE
- - - - - - - 20,000 20,000
Support to the Permanent Veterinary Committee of the Southern
Cone - CVP - - - - - - - - 60,000 60,000
3. Agribusiness and Commercialization Program 8 976,438 2 104,861 3 96,975 13 1,178,273 320,000 1,498,273
Program Management 1 143,568 - - 2 84,444 3 228,017 182,000 410,017
Hemispheric Projects 7 832,869 2 104,861 1 12,531 10 950,256 138,000 1,088,256 4. Agriculture, Territories and Rural Well-being Program 4 491,715 3 159,051 1 14,091 8 664,857 93,000 757,857
Program Management 1 141,073 - - 1 14,091 2 155,164 7,500 162,664
Hemispheric Projects 3 350,642 3 159,051 - - 6 509,693 85,500 595,193 C. PROGRAMS FOR CROSS-COORDINATION 2 288,039 3 127,880 2 32,242 7 448,162 67,000 515,162 1. Agriculture and Food Security 1 149,956 1 31,288 1 15,111 3 196,355 30,000 226,355 2. Agriculture, Natural Resource Management and Climate Change 1 138,083 2 96,592 1 17,132 4 251,807 37,000 288,807
Overall Budget of the Regular Fund by Programming Center
2012 - US$
2012 -2013
PROGRAMMING CENTERS
2012 PROGRAM BUDGET REGULAR FUND
Table No. 4.a
Program Budget
IPP
No. IPP US$ LPP No. LPP US$ GSP No. GSP US$ Total Personnel No. Total Personnel US$ Operating Cost TOTAL REGULAR FUND
Overall Budget of the Regular Fund by Programming Center
2012 - US$
2012 -2013
PROGRAMMING CENTERS 2012 PROGRAM BUDGET REGULAR FUND D. 4 502,511 6 323,706 2 28,742 12 854,958 160,000 1,014,958 Hemispheric Projects 4 502,511 6 323,706 2 28,742 12 854,958 100,000 954,958 Regional Projects - - - - - - - - 60,000 60,000Support for the Agricultural Policy Coordination Network of the South - REDPA and Support for the Informal Group of the Agricultural Negotiators - GINA SUR
- - - - - - - 60,000 60,000
E. TECHNICAL COOPERATION SUPPORT UNITS 5 607,517 11 463,736 4 81,941 20 1,153,194 175,000 1,328,194 1. Promotion and Formulation of Projects 5 607,517 - - - - 5 607,517 40,000 647,517
Hemispheric Component 2 244,264 - - - - 2 244,264 10,000 254,264
Regional Component 3 363,252 - - - - 3 363,252 30,000 393,252 2. Inter-American Center for Information and Editorial Production - - 7 278,475 2 39,301 9 317,777 40,000 357,777 3. Information and Communication Technologies - - 1 69,064 1 20,113 2 89,177 70,000 159,177 4. Center for Communication and Distance Learning - CECADI - - 3 116,197 1 22,527 4 138,724 25,000 163,724 F. 30 3,874,676 102 4,942,127 167 2,937,175 299 11,753,977 5,218,213 16,972,190 1. Belize 1 129,888 2 81,566 2 36,149 5 247,602 64,157 311,759 2. Costa Rica 1 130,699 4 164,608 5 80,485 10 375,792 79,633 455,425 3. Guatemala 1 127,779 2 123,231 4 51,055 7 302,065 133,790 435,855 4. Honduras 1 122,774 3 131,741 5 38,792 9 293,307 122,200 415,507 5. Nicaragua 1 129,446 3 73,725 3 25,533 7 228,704 185,981 414,685 6. Panama 1 131,464 3 135,619 4 70,618 8 337,701 84,397 422,098 7. El Salvador 1 129,904 3 119,849 7 85,755 11 335,508 56,595 392,103 8. Barbados 1 122,171 2 77,536 5 115,532 8 315,238 103,814 419,052 9. ECS 1 120,062 6 344,119 10 252,877 17 717,058 163,973 881,031 10. Guyana 1 116,788 2 63,897 9 71,772 12 252,457 123,919 376,376 11. Haiti 1 132,361 2 78,938 9 117,003 12 328,301 167,196 495,497 12. Jamaica 1 127,852 2 95,798 5 94,824 8 318,473 152,158 470,631 13. Bahamas 1 121,800 1 35,052 2 48,605 4 205,457 61,730 267,187 14. Dominican Republic 1 116,899 5 173,567 8 98,062 14 388,528 154,806 543,334 15. Suriname 1 120,272 2 48,217 4 39,197 7 207,686 129,965 337,651 16. Trinidad and Tobago 1 131,331 3 167,264 6 175,070 10 473,665 97,457 571,122 17. Bolivia 1 114,336 5 207,892 10 142,580 16 464,808 46,956 511,764 18. Colombia 1 152,950 6 333,879 13 235,236 20 722,066 402,263 1,124,329 19. Ecuador 1 128,535 5 192,181 10 149,510 16 470,226 169,091 639,317 20. Peru 1 136,563 4 167,303 7 99,822 12 403,689 155,218 558,907 21. Venezuela 1 147,044 4 195,606 7 112,370 12 455,020 125,774 580,794 22. Argentina 1 127,862 7 386,873 7 157,037 15 671,772 205,311 877,083
CENTER FOR STRATEGIC ANALYSIS FOR AGRICULTURE
NATIONAL COMPONENT OF TECHNICAL COOPERATION: OFFICES IN THE MEMBER STATES
Table No. 4.a
Program Budget
IPP
No. IPP US$ LPP No. LPP US$ GSP No. GSP US$ Total Personnel No. Total Personnel US$ Operating Cost TOTAL REGULAR FUND
Overall Budget of the Regular Fund by Programming Center
2012 - US$
2012 -2013
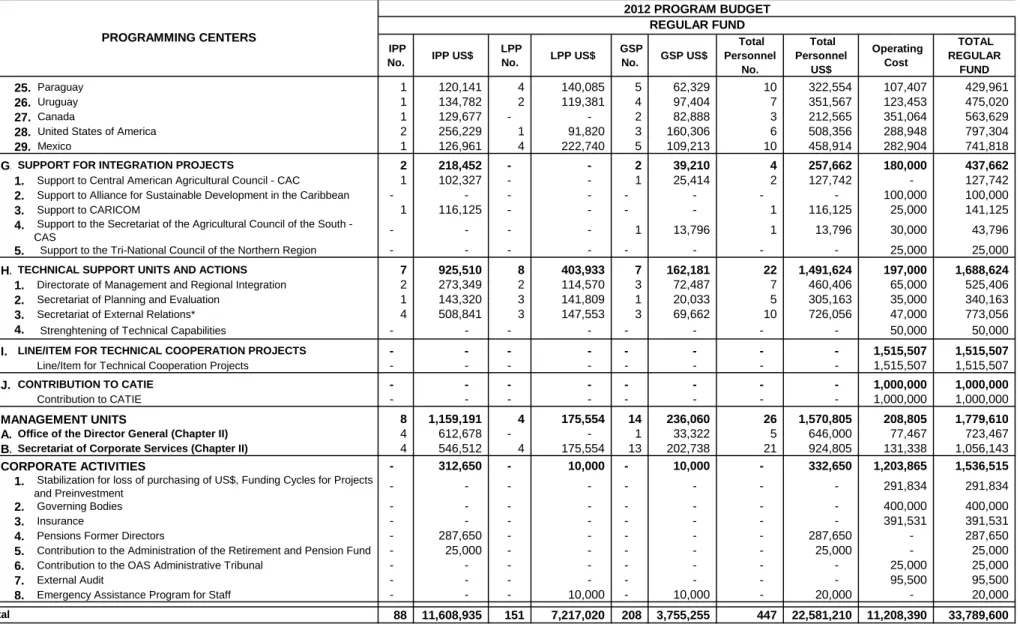
PROGRAMMING CENTERS 2012 PROGRAM BUDGET REGULAR FUND 25. Paraguay 1 120,141 4 140,085 5 62,329 10 322,554 107,407 429,961 26. Uruguay 1 134,782 2 119,381 4 97,404 7 351,567 123,453 475,020 27. Canada 1 129,677 - - 2 82,888 3 212,565 351,064 563,629 28. United States of America 2 256,229 1 91,820 3 160,306 6 508,356 288,948 797,304 29. Mexico 1 126,961 4 222,740 5 109,213 10 458,914 282,904 741,818 G.SUPPORT FOR INTEGRATION PROJECTS 2 218,452 - - 2 39,210 4 257,662 180,000 437,662 1. Support to Central American Agricultural Council - CAC 1 102,327 - - 1 25,414 2 127,742 - 127,742 2. Support to Alliance for Sustainable Development in the Caribbean - - - - - - - - 100,000 100,000 3. Support to CARICOM 1 116,125 - - - - 1 116,125 25,000 141,125 4. Support to the Secretariat of the Agricultural Council of the South -CAS - - - - 1 13,796 1 13,796 30,000 43,796
5. Support to the Tri-National Council of the Northern Region - - - - - - - - 25,000 25,000 H.TECHNICAL SUPPORT UNITS AND ACTIONS 7 925,510 8 403,933 7 162,181 22 1,491,624 197,000 1,688,624 1. Directorate of Management and Regional Integration 2 273,349 2 114,570 3 72,487 7 460,406 65,000 525,406 2. Secretariat of Planning and Evaluation 1 143,320 3 141,809 1 20,033 5 305,163 35,000 340,163 3. Secretariat of External Relations* 4 508,841 3 147,553 3 69,662 10 726,056 47,000 773,056 4. Strenghtening of Technical Capabilities - - - - - - - - 50,000 50,000 I. LINE/ITEM FOR TECHNICAL COOPERATION PROJECTS - - - - - - - - 1,515,507 1,515,507
Line/Item for Technical Cooperation Projects - - - - - - - - 1,515,507 1,515,507
J. CONTRIBUTION TO CATIE - - - - - - - - 1,000,000 1,000,000
Contribution to CATIE - - - - - - - - 1,000,000 1,000,000 II. MANAGEMENT UNITS 8 1,159,191 4 175,554 14 236,060 26 1,570,805 208,805 1,779,610 A. Office of the Director General (Chapter II) 4 612,678 - - 1 33,322 5 646,000 77,467 723,467 B.Secretariat of Corporate Services (Chapter II) 4 546,512 4 175,554 13 202,738 21 924,805 131,338 1,056,143 III. CORPORATE ACTIVITIES - 312,650 - 10,000 - 10,000 - 332,650 1,203,865 1,536,515
1. Stabilization for loss of purchasing of US$, Funding Cycles for Projects
and Preinvestment - - - - - - - - 291,834 291,834
2. Governing Bodies - - - - - - - - 400,000 400,000 3. Insurance - - - - - - - - 391,531 391,531 4. Pensions Former Directors - 287,650 - - - - - 287,650 - 287,650 5. Contribution to the Administration of the Retirement and Pension Fund - 25,000 - - - - - 25,000 - 25,000 6. Contribution to the OAS Administrative Tribunal - - - - - - - - 25,000 25,000 7. External Audit - - - - - - - - 95,500 95,500 8. Emergency Assistance Program for Staff - - - 10,000 - 10,000 - 20,000 - 20,000
88
11,608,935 151 7,217,020 208 3,755,255 447 22,581,210 11,208,390 33,789,600 */ The Permanent Office for Europe, located in Madrid, Spain, is attached to the Secretariat of External Relations and is funded with US$100,000 in INR resources per year.
Table No. 4.b
Program Budget
IPP
No. IPP US$ LPP No. LPP US$ GSP No. GSP US$ Total Personnel No. Total Personnel US$ Operating Cost TOTAL REGULAR FUND I TECHNICAL COOPERATION 80 10,311,899 147 7,385,149 194 3,658,967 421 21,356,014 9,197,992 30,554,007 A. Office of the Director of Technical Cooperation 1 148,106 1 92,073 1 21,853 3 262,031 80,000 342,031
Office of the Director of Technical Cooperation 1 148,106 1 92,073 1 21,853 3 262,031 80,000 342,031 B. TECHNICAL CONCENTRATION PROGRAMS 29 3,636,740 16 714,896 9 211,684 54 4,563,320 1,201,700 5,765,020 1. Innovation for Productivity and Competitiveness Program 11 1,400,372 8 283,802 3 66,737 22 1,750,911 504,700 2,255,611
Program Management 2 273,803 - - 1 24,575 3 298,378 16,500 314,878
Hemispheric Projects 4 502,012 7 265,340 1 18,786 12 786,137 251,200 1,037,337
Regional Projects: 5 624,558 1 18,462 1 23,376 7 666,396 237,000 903,396
Regional Cooperative Program for the Protection and Modernization of Coffee Cultivation in Central America, Panama and the Dominican Republic - PROMECAFE
1
107,539 - - - - 1 107,539 - 107,539
Support to Caribbean Agricultural Research and Development
Institute - CARDI - - - - - - - - 200,000 200,000 Cooperative Agricultural Research and Technology Transfer
Program for the Andean Subregion - PROCIANDINO 1 125,738 - - - - 1 125,738 - 125,738 Cooperative Program for the Development of Agricultural
Technology in the Southern Cone - PROCISUR 1 128,591 1 18,462 1 23,376 3 170,429 5,000 175,429 Cooperative Program on Research and Technology Transfer for the
South American Tropics - PROCITROPICOS 1 138,676 - - - - 1 138,676 - 138,676 Cooperative Program in Research and Technology for the Northern
Region - PROCINORTE 1 124,012 - - - - 1 124,012 27,000 151,012 Support to the System for the Central America Agricultural
Technology Integration System - SICTA - - - - - - - - 5,000 5,000
2. Agricultural Health and Food Safety Program 6 743,655 3 154,230 2 32,578 11 930,464 284,000 1,214,464
Program Management 1 140,336 - - 1 19,434 2 159,770 75,500 235,270
Hemispheric Projects 5 603,319 3 154,230 1 13,145 9 770,694 128,500 899,194
Regional Projects - - - - - - - - 80,000 80,000
Support to the Development and Strengthening of National Agricultural Health Systems in the Countries of the Southern Cone to Facilitate International Agricultural Trade - COSAVE
- - - - - - - 20,000 20,000
Support to the Permanent Veterinary Committee of the Southern
Cone - CVP - - - - - - - - 60,000 60,000
3. Agribusiness and Commercialization Program 8 992,809 2 110,005 3 97,588 13 1,200,403 320,000 1,520,403
Program Management 1 145,737 - - 2 84,444 3 230,185 182,000 412,185
Hemispheric Projects 7 847,072 2 110,005 1 13,145 10 970,217 138,000 1,108,217 4. Agriculture, Territories and Rural Well-being Program 4 499,903 3 166,859 1 14,781 8 681,543 93,000 774,543
Program Management 1 143,306 - - 1 14,781 2 158,087 7,500 165,587
Hemispheric Projects 3 356,597 3 166,859 - - 6 523,456 85,500 608,956 C. PROGRAMS FOR CROSS-COORDINATION 2 292,743 3 131,483 2 33,082 7 457,308 67,000 524,308 1. Agriculture and Food Security 1 152,407 1 31,288 1 15,111 3 198,806 30,000 228,806
2012 -2013
Overall Budget of the Regular Fund by Programming Center
2013 - US$
PROGRAMMING CENTERS
2013 PROGRAM BUDGET REGULAR FUND
Table No. 4.b
Program Budget
IPP
No. IPP US$ LPP No. LPP US$ GSP No. GSP US$ Total Personnel No. Total Personnel US$ Operating Cost TOTAL REGULAR FUND
2012 -2013
Overall Budget of the Regular Fund by Programming Center
2013 - US$
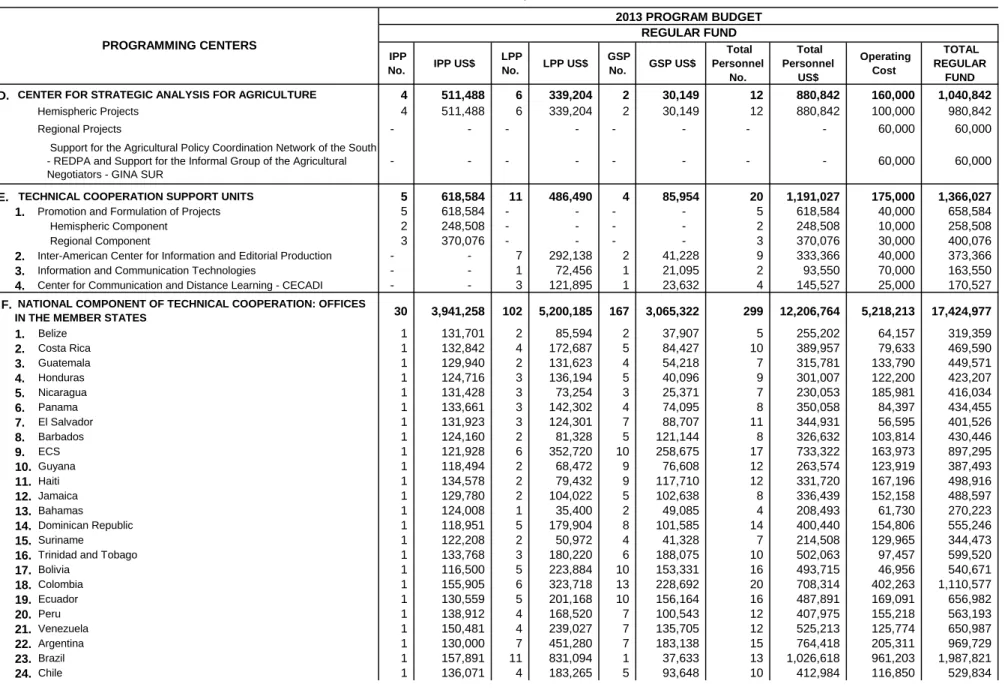
PROGRAMMING CENTERS 2013 PROGRAM BUDGET REGULAR FUND D. 4 511,488 6 339,204 2 30,149 12 880,842 160,000 1,040,842 Hemispheric Projects 4 511,488 6 339,204 2 30,149 12 880,842 100,000 980,842 Regional Projects - - - - - - - - 60,000 60,000Support for the Agricultural Policy Coordination Network of the South - REDPA and Support for the Informal Group of the Agricultural Negotiators - GINA SUR
- - - - - - - 60,000 60,000
E. TECHNICAL COOPERATION SUPPORT UNITS 5 618,584 11 486,490 4 85,954 20 1,191,027 175,000 1,366,027 1. Promotion and Formulation of Projects 5 618,584 - - - - 5 618,584 40,000 658,584
Hemispheric Component 2 248,508 - - - - 2 248,508 10,000 258,508
Regional Component 3 370,076 - - - - 3 370,076 30,000 400,076 2. Inter-American Center for Information and Editorial Production - - 7 292,138 2 41,228 9 333,366 40,000 373,366 3. Information and Communication Technologies - - 1 72,456 1 21,095 2 93,550 70,000 163,550 4. Center for Communication and Distance Learning - CECADI - - 3 121,895 1 23,632 4 145,527 25,000 170,527 F. 30 3,941,258 102 5,200,185 167 3,065,322 299 12,206,764 5,218,213 17,424,977 1. Belize 1 131,701 2 85,594 2 37,907 5 255,202 64,157 319,359 2. Costa Rica 1 132,842 4 172,687 5 84,427 10 389,957 79,633 469,590 3. Guatemala 1 129,940 2 131,623 4 54,218 7 315,781 133,790 449,571 4. Honduras 1 124,716 3 136,194 5 40,096 9 301,007 122,200 423,207 5. Nicaragua 1 131,428 3 73,254 3 25,371 7 230,053 185,981 416,034 6. Panama 1 133,661 3 142,302 4 74,095 8 350,058 84,397 434,455 7. El Salvador 1 131,923 3 124,301 7 88,707 11 344,931 56,595 401,526 8. Barbados 1 124,160 2 81,328 5 121,144 8 326,632 103,814 430,446 9. ECS 1 121,928 6 352,720 10 258,675 17 733,322 163,973 897,295 10. Guyana 1 118,494 2 68,472 9 76,608 12 263,574 123,919 387,493 11. Haiti 1 134,578 2 79,432 9 117,710 12 331,720 167,196 498,916 12. Jamaica 1 129,780 2 104,022 5 102,638 8 336,439 152,158 488,597 13. Bahamas 1 124,008 1 35,400 2 49,085 4 208,493 61,730 270,223 14. Dominican Republic 1 118,951 5 179,904 8 101,585 14 400,440 154,806 555,246 15. Suriname 1 122,208 2 50,972 4 41,328 7 214,508 129,965 344,473 16. Trinidad and Tobago 1 133,768 3 180,220 6 188,075 10 502,063 97,457 599,520 17. Bolivia 1 116,500 5 223,884 10 153,331 16 493,715 46,956 540,671 18. Colombia 1 155,905 6 323,718 13 228,692 20 708,314 402,263 1,110,577 19. Ecuador 1 130,559 5 201,168 10 156,164 16 487,891 169,091 656,982 20. Peru 1 138,912 4 168,520 7 100,543 12 407,975 155,218 563,193 21. Venezuela 1 150,481 4 239,027 7 135,705 12 525,213 125,774 650,987 22. Argentina 1 130,000 7 451,280 7 183,138 15 764,418 205,311 969,729 23. Brazil 1 157,891 11 831,094 1 37,633 13 1,026,618 961,203 1,987,821 24. Chile 1 136,071 4 183,265 5 93,648 10 412,984 116,850 529,834
CENTER FOR STRATEGIC ANALYSIS FOR AGRICULTURE
NATIONAL COMPONENT OF TECHNICAL COOPERATION: OFFICES IN THE MEMBER STATES
Table No. 4.b
Program Budget
IPP
No. IPP US$ LPP No. LPP US$ GSP No. GSP US$ Total Personnel No. Total Personnel US$ Operating Cost TOTAL REGULAR FUND
2012 -2013
Overall Budget of the Regular Fund by Programming Center
2013 - US$
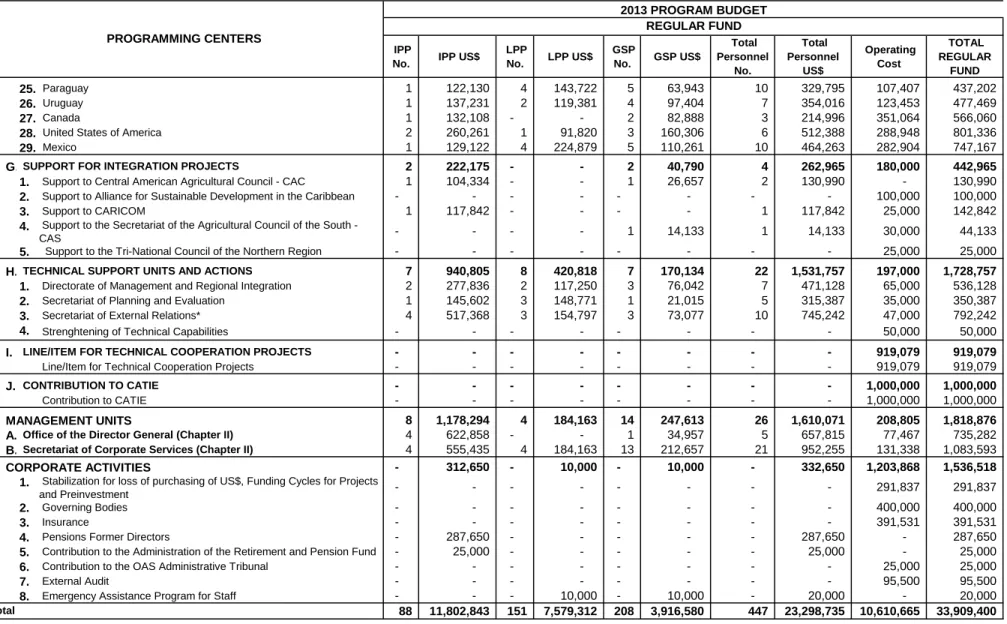
PROGRAMMING CENTERS 2013 PROGRAM BUDGET REGULAR FUND 25. Paraguay 1 122,130 4 143,722 5 63,943 10 329,795 107,407 437,202 26. Uruguay 1 137,231 2 119,381 4 97,404 7 354,016 123,453 477,469 27. Canada 1 132,108 - - 2 82,888 3 214,996 351,064 566,060 28. United States of America 2 260,261 1 91,820 3 160,306 6 512,388 288,948 801,336 29. Mexico 1 129,122 4 224,879 5 110,261 10 464,263 282,904 747,167 G.SUPPORT FOR INTEGRATION PROJECTS 2 222,175 - - 2 40,790 4 262,965 180,000 442,965 1. Support to Central American Agricultural Council - CAC 1 104,334 - - 1 26,657 2 130,990 - 130,990 2. Support to Alliance for Sustainable Development in the Caribbean - - - - - - - - 100,000 100,000 3. Support to CARICOM 1 117,842 - - - - 1 117,842 25,000 142,842 4. Support to the Secretariat of the Agricultural Council of the South -CAS - - - - 1 14,133 1 14,133 30,000 44,133
5. Support to the Tri-National Council of the Northern Region - - - - - - - - 25,000 25,000 H.TECHNICAL SUPPORT UNITS AND ACTIONS 7 940,805 8 420,818 7 170,134 22 1,531,757 197,000 1,728,757 1. Directorate of Management and Regional Integration 2 277,836 2 117,250 3 76,042 7 471,128 65,000 536,128 2. Secretariat of Planning and Evaluation 1 145,602 3 148,771 1 21,015 5 315,387 35,000 350,387 3. Secretariat of External Relations* 4 517,368 3 154,797 3 73,077 10 745,242 47,000 792,242 4. Strenghtening of Technical Capabilities - - - - - - - - 50,000 50,000 I. LINE/ITEM FOR TECHNICAL COOPERATION PROJECTS - - - - - - - - 919,079 919,079
Line/Item for Technical Cooperation Projects - - - - - - - - 919,079 919,079
J. CONTRIBUTION TO CATIE - - - - - - - - 1,000,000 1,000,000
Contribution to CATIE - - - - - - - - 1,000,000 1,000,000 II. MANAGEMENT UNITS 8 1,178,294 4 184,163 14 247,613 26 1,610,071 208,805 1,818,876 A. Office of the Director General (Chapter II) 4 622,858 - - 1 34,957 5 657,815 77,467 735,282 B.Secretariat of Corporate Services (Chapter II) 4 555,435 4 184,163 13 212,657 21 952,255 131,338 1,083,593 III. CORPORATE ACTIVITIES - 312,650 - 10,000 - 10,000 - 332,650 1,203,868 1,536,518
1. Stabilization for loss of purchasing of US$, Funding Cycles for Projects
and Preinvestment - - - - - - - - 291,837 291,837
2. Governing Bodies - - - - - - - - 400,000 400,000 3. Insurance - - - - - - - - 391,531 391,531 4. Pensions Former Directors - 287,650 - - - - - 287,650 - 287,650 5. Contribution to the Administration of the Retirement and Pension Fund - 25,000 - - - - - 25,000 - 25,000 6. Contribution to the OAS Administrative Tribunal - - - - - - - - 25,000 25,000 7. External Audit - - - - - - - - 95,500 95,500 8. Emergency Assistance Program for Staff - - - 10,000 - 10,000 - 20,000 - 20,000
88
11,802,843 151 7,579,312 208 3,916,580 447 23,298,735 10,610,665 33,909,400 */ The Permanent Office for Europe, located in Madrid, Spain, is attached to the Secretariat of External Relations and is funded with US$100,000 in INR resources per year.
1994-2011 and 2012-2013 (US$ x 000)
1994 26,707.5 2,297.3 29,004.8 1995 27,508.7 2,127.5 29,636.2 1996 27,508.7 2,527.2 30,035.9 1997 27,508.7 3,258.1 30,766.8 1998 27,508.7 2,491.3 30,000.0 1999 27,508.7 2,491.3 30,000.0 2000 27,508.7 2,491.3 30,000.0 2001 27,508.7 2,491.3 30,000.0 2002 27,508.7 2,491.3 30,000.0 2003 27,167.6 2,832.4 30,000.0 2004 27,167.6 2,832.4 30,000.0 2005 27,167.6 2,832.4 30,000.0 2006 27,167.6 2,832.4 30,000.0 2007 27,167.6 2,832.4 30,000.0 2008 27,227.8 4,100.0 31,327.8 2009 27,227.8 4,100.0 31,327.8 2010 27,298.2 6,100.0 33,398.2 2011 27,298.2 6,100.0 33,398.2 2012 27,689.6 6,100.0 33,789.6 2013 27,809.4 6,100.0 33,909.4Note: The Cuban quota was excluded from the quota resources as of 2003.
PERIOD QUOTAS MISCELLANEOUS REGULAR FUND