Science Arts & Métiers (SAM)
is an open access repository that collects the work of Arts et Métiers Institute of
Technology researchers and makes it freely available over the web where possible.
This is an author-deposited version published in:
https://sam.ensam.eu
Handle ID: .
http://hdl.handle.net/10985/12574
To cite this version :
Katy TCHA-TOKEY, Emilie LOUP-ESCANDE, Olivier CHRISTMANN, Simon RICHIR - Effects on
User Experience in an Edutainment Virtual Environment: Comparison Between CAVE and HMD
-In: European Conference on Cognitive Ergonomics, Suède, 2017-09-20 - Proceedings of the
European Conference on Cognitive Ergonomics 2017 - 2017
Any correspondence concerning this service should be sent to the repository
Administrator :
[email protected]
Science Arts & Métiers (SAM)
is an open access repository that collects the work of Arts et Métiers ParisTech
researchers and makes it freely available over the web where possible.
This is an author-deposited version published in:
http://sam.ensam.eu
Handle ID: .
http://hdl.handle.net/null
To cite this version :
Katy TCHA-TOKEY, Emilie LOUP-ESCANDE, Olivier CHRISTMANN, Simon RICHIR, Katy
TCHA-TOKEY, Emilie LOUP-ESCANDE - Effects on User Experience in an Edutainment Virtual
Environment: Comparison Between CAVE and HMD - In: European Conference on Cognitive
Ergonomics, Suède, 2017-09-20 - Usability and User Experience-I - 2017
Any correspondence concerning this service should be sent to the repository
Administrator :
[email protected]
Effects on User Experience in an Edutainment Virtual
Environment: Comparison Between CAVE and HMD
Katy Tcha-Tokey
Arts et Métiers ParisTech, LAMPA 2 bd du Ronceray
49000 ANGERS, France [email protected]
Emilie Loup-Escande
Université de Picardie Jules Verne CRP-CPO (EA 7273) Chemin du Thil80025 AMIENS, France [email protected]
Olivier Christmann
Arts et Métiers ParisTech, LAMPA2 bd du Ronceray 49000 ANGERS, France [email protected]
Simon Richir
Arts et Métiers ParisTech, LAMPA 2 bd du Ronceray
49000 ANGERS, France [email protected]
ABSTRACT1
The user experience in immersive virtual environment can be broadly defined by the feeling of presence and immersion in a virtual environment. The propensity of feeling “there” and “enveloped by” in the virtual environment seems to be essential in offering a high quality of experience. However, this user experience definition is partial and neglects other components of the user experience in immersive virtual environments. We consider the overall user experience in immersive virtual environments. In this study, we use our unified questionnaire to measure, analyze and compare the user experience of two immersive virtual devices (i.e., a Cave Automatic Virtual Environment and a Mobile Head Mounted Display). 21 participants took place in this study and assessed the user experience of these devices through the “King Tut VR2” edutainment virtual application. The results show that the CAVE induced a greater user experience than the HMD with significant difference in presence, engagement, flow, skill, judgement and experience consequence. The results also show no significant difference in immersion, usability, emotion and technology adoption between the CAVE and the HMD.
CCS CONCEPTS
• General and reference → Evaluation • General and reference → Measurement • Human-centered computing → User studies • Human-centered computing → Virtual reality
Immersive Virtual Environment, Virtual Reality, User Experience, Evaluation, Questionnaire
ACM Reference format:
K. Tcha-Tokey, E. Loup-Escande, O. Christmann, S. Richir. 2017. Effects on User Experience in an Edutainment Virtual Environment: Comparison Between CAVE and HMD. In Proceedings of ACM European Conference
on Cognitive Ergonomics, Umeå, Sweden, September 2017 (ECCE’17), 8
pages.
DOI: 10.1145/3121283.3121284
1 INTRODUCTION
Edutainment applications are more and more part of our everyday environment. And to make these applications more attractive and effective, they are being combined with immersive virtual reality technologies. Indeed, the market for VR headset becomes larger and more competitive with new headsets mostly for video games such as HTC vive by HTC, Oculus Rift by Oculus VR, PlayStation VR by Sony, Samsung Gear VR by Samsung, and soon other headsets with greater capabilities. These devices imply emotions and affects, skill, knowledge and other cognitive aspects that influence the User eXperience (UX). The empirical study presented in this paper wish to bring elements of responses to the implication of these aspects in the UX. The Virtual Reality (VR) technology and the UX design of the VR environment, if appropriate, can intensify the user experience. Several studies show that UX can be measured by either subjective methods or objective methods [11,16]. Yet objective measures tend to be more reliable and subjective measures must be well defined to avoid bias [1]. However, they may both bring different understanding of UX. Questionnaire is currently the most commonly used method for the measure of UX components (e.g. presence, engagement, immersion, flow, emotion, judgment…) as it is an effective way to get the end-users’ perceptions and helpful feedback. Furthermore, a large number of questionnaires have been proven valid and reliable. Today, many interactive technology companies are more and more interested in experience based design and experience centered approach to provide greater experience to their users [20]. Unfortunately, despite the numerous research papers and the growing interest from companies, UX methods are mostly not used at all or not properly
applied by practitioners in their current design practice [2]. UX questionnaires can be a simple and effective tool helping the practitioner in the design process of the interactive system. For instance, UX questionnaires can be used in the earlier phases of the design: the questionnaires might be used as soon as a prototype is designed to assess the UX and therefore favor a better UX in the final interactive system. In the VR fields, once the product is finalized, practitioners can use UX questionnaires to be guided in the choice of the appropriate VR technologies and interaction techniques that improve the UX and provide a greater and suitable experience for users.
The aim of the study is to compare the effect of two virtual devices on user experience in an edutainment virtual environment. In the remainder of this paper, we point out the value of the present paper and replace it in the context of our UX in IVE research in section 2. We then introduce the aim and hypotheses of our study, explain our methodological choices detailing participants, the procedure, material and measures, tasks and we describe our collected data and analysis made in section 3. We present the results showing that the CAVE induced a greater user experience than the HMD Mobile in terms of presence, engagement, flow, skill, judgement and experience consequence in section 4 and we discuss these results for each hypothesis in section 5. Finally, we conclude with suggestions on how to improve the user experience and on perspectives and future research in section 6.
2 AN EMPIRICAL EXEMPLE OF THE USE
OF A UX QUESTIONNAIRE
This paper takes root in a research context on user experience modelling for IVE. This research pursues two objectives: first, we wish to assist the design and assessment of virtual immersive environment by offering to practitioners a proper measurement tool that takes the form of a UX questionnaire [19], second, we wish to submit an empirical example to allow a proper application of this measurement tool by practitioners.
We have met the first objective in a previous study [19] in which we designed and validated the UX questionnaire for IVE. The questionnaire is composed of a set of items that gathers the user’s opinion, beliefs and preferences on the VE that he/she experienced in terms of presence, engagement, immersion, flow, usability, skill, emotion, experience consequence, judgement and technology adoption (see section 3.2.3 for more details on the UX questionnaire for IVE). The use of a questionnaire to assess UX is the traditional way. Nevertheless, uncertainties can arise when it comes to properly use and interpret the questionnaire and its results. These uncertainties could lead more and more researchers to give up on subjective methods in favor of objective methods [14]. Whereas a combination of both subjective and objective methods seems to be the best compromise [12]. Therefore, in this study, we propose a case study of the use our UX in IVE questionnaire to compare the user experience of two immersive virtual devices.
3 MEASURING THE USER EXPERIENCE IN
TWO IMMERSIVE VIRTUAL DEVICES
We conducted an experiment with the “KingTutVR2” professional application from the EON Reality SAS company. We used our questionnaire to measure the UX for two immersive virtual devices: a CAVE and a HMD Mobile. We then proceeded to inferential and descriptive statistics analysis on our paired samples to compare the user experience for each device.
3.1 Aim and Hypothesis of this Study
The aim of the present study is to compare the effect of a CAVE and a HMD on user experience in an edutainment virtual environment. These two technologies are the most common type of VR devices used in VR companies and in the VR edutainment field. The CAVE seems to provide greater presence, immersion and emotion [9], greater skill and less experience consequence [15] compared to a HMD. Consequently, in the hypothesis 1, we hypothesize that subjective user experience is greater in the CAVE than in the HMD Mobile. We chose to refute or confirm this hypothesis by measuring 10 components (i.e., presence, engagement, immersion, flow, usability, skill, emotion, experience consequence, judgement, technology adoption) in the CAVE and in the HMD Mobile.
We found that sensors sensitivity seems to be the most critical issue and impediment to reliable interaction with HMD. Most VR designers implement interaction techniques and assign their application to devices without any specific method. This results in VR applications with problematic user interfaces [8]. Furthermore, today, no specific interaction techniques are used for HMD Mobiles. Therefore, in the hypothesis 2, we assume that the interaction system (a flystick) provided by the CAVE allows quicker interaction than the interaction system (a crosshair) provided by the HMD Mobile. The metric used to refute or confirm this assumption is the user’s scenario completion time in the CAVE and in the HMD Mobile.
In the hypothesis 3, we suppose that the “pedagogical lesson” is well designed and the “King Tut VR2” edutainment application impacts the user’s knowledge on Howard Carter and the discovery of Tutankhamun tomb. Scores in a pre- and post-experience knowledge test was used to refute or confirm this hypothesis.
3.2 Method
3.2.1 Participants. Twenty-one participants (2 women and 19
men) aged 18-43 years (M = 26.1, SD = 7.38) took part in the study. Thirteen participants work or study in Information and Communications Technology (ICT) or Computer Science fields (e.g., infographics and communication, web and multimedia, programming, VR research engineers, network administrator, project manager). Eight participants work or study in various other fields (e.g., industrial system engineering, micro technology, commercial manager, community manager, biology, sociology, teacher).
As the “King Tut VR2” application is in English, we decided to select participants with good enough English skills to
understand the script. Thirteen participants are considered having excellent understanding of the oral script played in English in the application, they scored 5/5 points in the English test created to assess English level (see section 3.2.3 for more details). Seven participants are considered having good understanding of oral English, they scored 4/5 points in the English test. One participant is considered having satisfactory understanding of oral English, he scored 3/5 points in the English test.
3.2.2 Procedure. The experiment took place in the EON
Reality SAS showroom in the city of Laval in France. Each participant came separately into the showroom and worked through three different steps:
During the first step of the experiment, the participant sat at a meeting desk in the show room. Then, he/she performed two tests. The first one was an English test. Only data from participants who scored 3/5 points or above were analyzed in this paper. The second test was a knowledge test on Howard Carter and the discovery of King Tutankhamun’s tomb. The participant performed this second test twice: before starting the experiment and at the end of the experiment before leaving the show room.
After the tests, an introduction of the experiment was given by the experimenter. The order of the two following steps were counterbalanced. For instance, a “1/ HMD Mobile – 2/ CAVE” session was followed by a “1/ CAVE – 2/ HMD Mobile” session for the next participant. During the second step of the experiment, use instructions on the first technology and its interaction was given by the experimenter. Each participant stood on their feet in an area free of any objects that the participants could knock while turning around and they were asked to wear the VR ONE VR headset for mobile. Once the mobile application “King Tut VR2” selected and lunched, the experimenter slipped the mobile phone in the headset. The participant followed the instructions given in the VR application until the end of the scenario.
The tasks covered passive activity and active activity. After the end of the session, the participant completed our UX questionnaire.
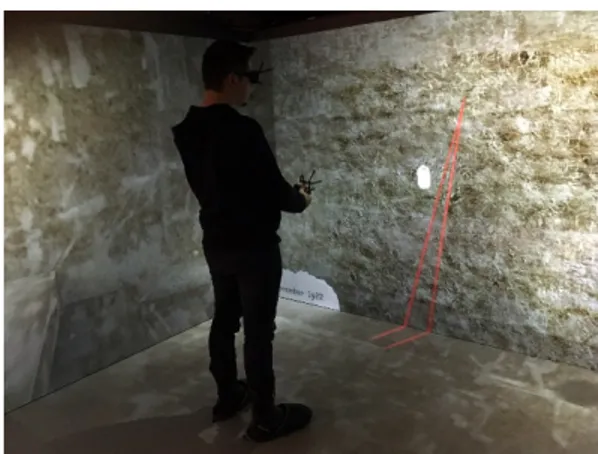
During the third step of the experiment, use instructions on the second technology and its interaction was given by the experimenter. Each participant stood on their feet in the middle of the EON ICUBE CAVE (see Fig. 1) and they were asked to wear 3D tracking glasses and hold a tracking gamepad. Once the CAVE application “King Tut VR2” lunched, the participant followed the instructions given in the VR application until the end of the scenario. The tasks covered the same passive and active activity as in the second step. After the end of the session, the participant completed our UX questionnaire.
After the knowledge test filled for the second time, the participant was thanked and free to leave the show room. Each participant spent between 45 minutes to one hour in the show room. The interaction session with a single device ranged from 7 to 18 min.
Figure 1: Participant in the EON ICUBE CAVE using the application “King Tut VR2”
3.2.3 Material and Measures. Identification survey. A
participant identification survey was used to collect the user’s personal data (i.e., name, surname, date of birth, gender, last diploma, and current diploma or occupation).
English test. An English test was used to collect the
participant’s English level. It consists of a record. Five sentences were played, each one was followed by a question, the participant had to choose the right answer among 3 propositions (e.g., “1. Before the excavation begins, archeologists write a research design. When is the excavation research design written? a. Before the excavation; b. Before the excavation begins; c. During the excavation”).
Knowledge test. The same knowledge test was used before and
after the experiment to collect the amount of information the participant memorized during the “King Tut VR2” application scenario. It consists of 5 questions about Howard Carter and the famous discovery of the King Tutankhamun’s tomb, the participant had to choose the right answer among 3 propositions or choose the “I don’t know” option (e.g., 2. Where did Howard Carter start his excavation? a. In London; b. In the middle of the Valley of the Kings; c. In the sea floors of the Nile; d. I don’t know).
UX questionnaire. Our UX in IVE questionnaire of 87 items
and 3 open questions is used to assess the UX (see Table 1). It is based on nine other existing questionnaires (PQ2, ITQ3,Flow4D16 updated in EduFlow24 since 2016, CSE5, AEQ6, SUS7, UTAUT8, AttracDiff9, SSQ10) [18,19].
2 Presence Questionnaire
3 Immersive Tendencies Questionnaire 4 Flow in education
5 Computer Self-Efficacy
6 Achievement Emotions Questionnaire 7 System Usability Scale
8 Unified Theory of Acceptance and Use of Technology 9 Perceived hedonic and pragmatic quality
Table 1: English translation of some items used in our unified UX questionnaire
Items
Presence
1. The virtual environment was responsive to actions that I initiated.
Engagement
6. The sense of moving around inside the virtual environment was compelling.
Immersion
16. I felt stimulated by the virtual environment.
Flow
23. I felt I could perfectly control my actions.
Usability
34. I thought the interaction devices (headset, gamepad) were easy to use.
Emotion
37. I enjoyed being in this virtual environment.
Skill
52. I felt confident selecting objects in the virtual environment.
Judgement
58. A. Personally, I would say the virtual environment is impractical/practical
Experience consequence
62. I suffered from fatigue during my interaction with the virtual environment.
Technology adoption
71. If I use again the same virtual environment, my interaction with the environment would be clear and understandable for me.
All items and questions were originally in French. Our UX questionnaire consists of 12 items to measure presence, 3 items to measure engagement, 7 items to measure immersion, 11 items to measure flow, 3 items to measure usability, 6 items to measure skill, 15 items to measure emotion, 9 items to measure experience consequence, 12 items (grouped in 4) to measure judgement and 9 items to measure technology adoption. The participants’ UX scores were collected through a 10-point Likert scale (1 = strongly disagree, 10 = strongly agree) for 75 items. For the 12 items (grouped in 4) of the judgement scale scores were collected through a semantic differential scale: point 1 was coded as a negative-connoted adjective (e.g. impractical, confusing, amateurish, …) whereas point 10 was coded as a positive-connoted adjective (e.g. practical, clear, professional, …). A high score in a subscale means that the UX component measured is highly perceived by the participant (e.g. Presence equals to 9 means that the participant felt really present, “he felt there”, while he was in the Virtual Environment). A low score in a subscale means that the UX component measured is poorly perceived by the participant (e.g. Presence equals to 2 means that the participant did not really felt present, while he was in the Virtual Environment, there was few or no moments where he would easily forget about the real environment).
Devices. Each participant used the edutainment “King Tut
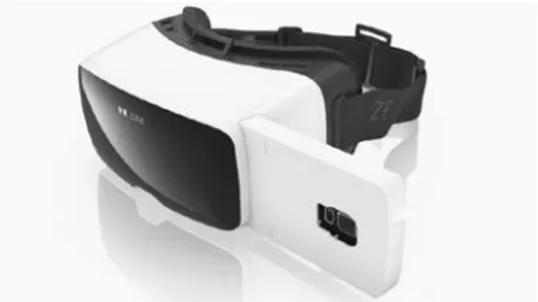
VR2” application twice with two different devices: A VR ONE HMD Mobile headset with a Samsung Galaxy S6 mobile phone (See Fig. 2). The phone speakers played the application sound. The participants could interact in the application with their head, by moving a cross-hair in their field of vision on the desired area.
Figure 2: A VR ONE HMD (Head Mounted Display) Mobile headset
Figure 3: EON ICUBE CAVE (Cave Automatic Virtual Environment)
A EON ICUBE CAVE (see Fig. 3) composed of four walls (in the front, on the left, on the right and on the floor) delimiting a 10-by-10-foot room with projectors aimed at each wall and a ceiling projector aimed at the floor with trackers to track the stereoscopic 3D glasses and the gamepad. Loudspeakers played the application sound. The participants could interact with the gamepad by moving a virtual flystick in the desired area.
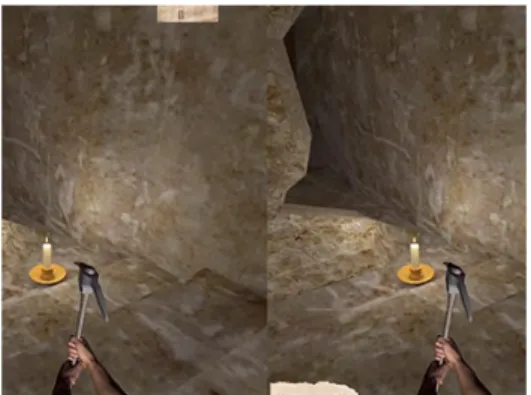
3.2.4 Task. The experiment consists of the use of the
edutainment “King Tut VR2” application designed by the EON Reality SAS company. The goal of the “King Tut VR2” VE application (see Fig. 4) is to relive the journey of Howard Carter and his discovery of King Tutankhamun’s tomb. The participants were asked to follow the instructions given by the voice-over in the VR application. The tasks covered passive activity (i.e., watching and listening to Howard Carter’s journey) and active activity (i.e., excavating with a pickaxe in the ground).
Figure 4: A screen shot of the “King Tut VR2” (Copyright ©, EON Reality, Inc) application in the HMD Mobile device
3.2 Collected Data and Analysis
3.3.1 Subjective UX Between the HMD Mobile and the CAVE. In the experiment, each of the 21 participants tested two
immersive devices in their session and filled the same UX questionnaires twice, one for each device. Therefore, we used paired-samples measures techniques for the statistical analysis of the subscale scores of the UX questionnaires. The test of normality indicated a non-significant difference (p>0.05) suggesting a validation of the assumption of normality for all UX questionnaire subscales, so we used the paired-samples t-test.
3.3.2 Completion Time Between the HMD Mobile and the CAVE. The average scenario completion time in the application
was measured to compare participant’s performances in each device. We took the completion time as a measure of objective usability. However, objective usability measures are not limited to completion time, other measures exist such as completion rate, number of errors, time recovering from errors, etc. In the context of our study, completion time was a feasible measure and could be interpreted as “The more time the participants spent in the application the more difficulties they come across”. To analyze the difference between the completion time between the HMD mobile and the CAVE in the same population we used the paired sample t-test.
3.3.3 Knowledge Test. The average values of the
Pre-Experience and Post-Pre-Experience Knowledge test were compared. This comparison consists of the number of questions correctly answered on Howard Carter and the discovery of king Tutankhamun’s tomb before and after the experiment. The difference in the results of questions correctly answered Pre- and
Post-Experience gives an idea of the “pedagogical” impact [5] of the edutainment “King Tut VR2” application. To analyze the difference between the scores in the Pre- and Post-Experience Knowledge Test in the same population we used the paired sample t-test.
4 RESULTS
The results of the paired sample statistics are detailed below, they show the significance of the UX questionnaires results for the CAVE and the HMD Mobile. In addition, we present the mean scale value for each device, the results of the Pre and Post-Experience knowledge test and scenario completion time.
4.1 Subjective UX Between the HMD Mobile and
the CAVE
Paired sample statistics are presented below and in Table 2. The data indicate significant difference for 6 subscales (i.e., presence, engagement, flow, skill, judgement, experience consequence).
The user feeling of presence is higher in the CAVE group (M = 7.40, SD = 0.91) than in the HMD Mobile group (M = 6.08, SD = 1.35), t(20) = 4.45, p < 0.001, two-tailed.
The user engagement is higher in the CAVE group (M =7.59, SD = 1.52) than in the HMD Mobile group (M = 6.30, SD = 1.70), t(20) = 2.84, p = 0.010, two-tailed.
The user state of flow is higher in the CAVE group (M = 7.27, SD = 1.36) than in the HMD Mobile group (M = 5.87, SD = 1.63), t(20) = 3.49, p = 0.002, two-tailed.
The user perceived skill is higher in the CAVE group (M = 8.44, SD = 1.10) than in the HMD Mobile (M = 7.41, SD = 1.29) group, t(20) = 3.48, p = 0.002, two-tailed.
The user judgement associated to the CAVE (M = 8.27, SD = 1.01) is more positive than the judgement associated to the HMD Mobile (M = 6.86, SD = 1.28), t(20) = 6.07, p <0.001, two-tailed.
The user experienced less negative consequences in the CAVE (M = 2.18, SD = 1.15) than in the HMD Mobile (M = 4.02, SD = 1.75), t(20) = -5.68, p < 0.001, two-tailed.
However, the data indicate non-significant difference for 4 subscales: immersion, usability, emotion, technology adoption (see Table 2).
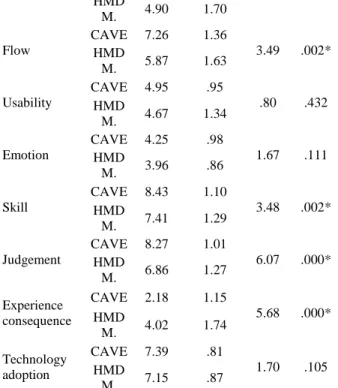
Table 2: Paired sample Statistics: Mean and Standard Deviation of the paired sample (N = 21) Subscale Device Mean Std.
Deviation t value Sig. (2 tailed) Presence CAVE 7.40 .91 4.45 .000* HMD M. 6.07 1.35 Engagement CAVE 7.58 1.52 2.84 .010* HMD M. 6.30 1.70 Immersion CAVE 5.82 1.70 2.04 .055
HMD M. 4.90 1.70 Flow CAVE 7.26 1.36 3.49 .002* HMD M. 5.87 1.63 Usability CAVE 4.95 .95 .80 .432 HMD M. 4.67 1.34 Emotion CAVE 4.25 .98 1.67 .111 HMD M. 3.96 .86 Skill CAVE 8.43 1.10 3.48 .002* HMD M. 7.41 1.29 Judgement CAVE 8.27 1.01 6.07 .000* HMD M. 6.86 1.27 Experience consequence CAVE 2.18 1.15 5.68 .000* HMD M. 4.02 1.74 Technology adoption CAVE 7.39 .81 1.70 .105 HMD M. 7.15 .87
Note. CAVE = Cave Automatic Virtual Environment; HMD M. = Head
Mounted Display Mobile. *p <= .01.
4.2 Completion Time Between the HMD Mobile
and the CAVE
The CAVE device seemed to be easier to use than the HMD Mobile with a difference in the completion time of 67,43 seconds (Table 3). Indeed, 11 participants said they had trouble targeting a precise area with the HMD Mobile cross hair when asked to give the negative points of their experiment (e.g., participant n°10: “The pointing interaction wasn’t precise enough and moved by its
own”).
However, there was no significant difference in completion time between the CAVE (M = 657.10, SD = 60.98) and the HMD Mobile (M = 724.52, SD = 160.51) groups, t(20) = 1.67, p = 0.111, two-tailed.
Table 3: The average and standard deviation (Std. Dev.) scenario Completion Time in the “King Tut VR2” application
for the CAVE and HMD Mobile Devices. Device N Average Completion
Time (sec)
Std. Dev.
CAVE 21 657.10 60.98
HMD M. 21 724.52 160.51
Note. CAVE = Cave Automatic Virtual Environment; HMD M. = Head
Mounted Display Mobile.
4.3 Pre- and Post-Experience Knowledge Test
The edutainment application had a “pedagogical” impact on the participants with an extra 42 correct answers and a gain of 2/5 points in the post-experience knowledge test compared to the pre-experience knowledge test (Table 4).
Table 4. The amount of correct answers (N. Corr. Answers) average and standard deviation (Std. Dev.) values for the Pre-
and Post-Experience Knowledge Test on Howard Carter and the discovery of king Tutankhamun’s tomb
N N. Corr. Answers Average Std. Dev. Pre-Experience Knowledge Test 21 44 2.09 1.19 Post-Experience Knowledge Test 21 86 4.09 0.97 Indeed, there was significant difference in the number of correct answers between the pre-experience knowledge test (M = 2.09, SD = 60.98) and the post-experience knowledge test (M = 724.52, SD = 160.51) groups, t(20) = 6.179, p < 0.001, two-tailed. Moreover, 8 participants said they had particularly appreciated the pedagogical environment when asked to give the positive points of their experiment (e.g., participant n°1: “The learning around
ancient Egypt was interesting, being at the heart of the history was appreciated”).
5 DISCUSSION
We analyzed and compared two immersive virtual devices (CAVE vs. HMD Mobile) in terms of user experience. Our study is original for two reasons. First, unlike most studies that investigates the effect of several immersive virtual devices on user experience [3,9,15], our study covers the analysis of 10 UX key components in the VR field. Second, few studies analyze the comparison of immersive virtual devices regarding UX in the edutainment field.
Our first hypothesis stated that subjective user experience is greater in the CAVE than in the HMD Mobile. This first hypothesis is partially validated. The results show greater user experience for the CAVE device with significant difference in the paired samples for 6 subscales and no significant difference for 4 subscales. Other studies show comparative results. They show greater presence, immersion and emotion [9], greater skill and less experience consequence [15] in the CAVE device compared to a HMD device, they also show no difference in usability [9] and in emotion [3]. Only a few number of studies compare the CAVE and the HMD devices in terms of engagement, flow, judgement and technology adoption.
Our second hypothesis announced that the interaction provided by the CAVE allows quicker interaction than the interaction provided by the HMD Mobile. This statement is validated even if the time gap is not significant. The result show that participants tend to spend 67.43 second less time in the CAVE than in the
HMD Mobile. This result (objective usability) seems to be in line with the subjective usability, since no significant difference were found in subjective usability neither. This result is consistent with previous studies on the completion time between the CAVE and a HMD [4]. These findings also suggest that better interaction techniques for the HMD Mobile device must be designed. Indeed, interaction design for HMD represents a real challenge for researchers and designers [7]. For instance, sensors noise seems to be the most critical issue and impediment to reliable interaction with HMD. Most VR designers implement interaction techniques and assigned their application to devices without any specific method. This, results in VR applications with problematic user interfaces [8].
Our third hypothesis enunciated that the pedagogical lesson is well designed and the “King Tut VR2” edutainment application impacts the user’s knowledge on Howard Carter and the discovery of Tutankhamun tomb. This hypothesis is validated. There is significant difference in the user’s knowledge of Howard Carter and the discovery of King Tutankhamun’s tomb before and after the use of the “King Tut VR2” edutainment application. The VR edutainment application “King Tut VR2” seems be useful for pedagogical purpose. These previous results suggest that it is preferable to opt for the CAVE device to provide a greater sense of presence, immersion, emotion, skill and a lower feeling of experience consequence (cyber sickness, …) in an edutainment environment such as “King Tut VR2” with a pedagogical impact (significance in the knowledge test score). This can be explained by several advantages provided by the CAVE and its interaction: the wider field of view, which is similar to our natural field of view while the field of view is smaller in the HMD Mobile; the higher interactivity level gained with the gamepad, that allowed the participants to turn the objects around, whereas it was not possible in the HMD Mobile; the head-tracking allowing the perception of depth when moving forward and backward while depth was not tracked in the HMD Mobile. Concerning subjective usability (UX questionnaire), objective usability (completion time), engagement, flow, judgement and technology adoption, no difference is made, both devices are suitable for an edutainment application such as “King tut VR2”. This can be explained by the facts that for some components (technology adoption, usability, flow) the two devices are equally efficient or that some components (judgement, engagement) rely very little on the technology but more on the content of the application.
6 CONCLUSION
In this study, we put into practice our UX questionnaire for IVE designed and validated in a previous study, and use it as a guiding tool in the choice of the appropriate VR technologies (CAVE and HMD Mobile) that best improve the UX and provide a greater and suitable experience for customers. The questionnaire measures 10 key components of UX in IVE, providing the strong points and the weak points of the VR environment. Knowing these points, the practitioners can improve the VE prototype or VE final products to increase the weak points, by making specific design or technology choices (through UX guidelines). The CAVE seems to
have more advantages than the HMD Mobile according to participants. Indeed, CAVE alike systems seem to provide greater user experience. Moreover, the interaction design for the CAVE is less challenging than for the HMD. However, devices like CAVEs are expensive and bulky. Consequently, alternatives and low-cost CAVE solutions [6] would be interesting to develop, especially for the general public edutainment applications.
Our research also focusses on the UX questionnaire as a tool to choose suitable interaction techniques and immersive virtual devices. A number of studies identify guidelines to design suitable interactive systems that improves user experience and help choose the suitable interaction technique and the technology. For instance, Nemery et al [13] identify solicitation, priming and commitment to strengthen engagement of the user. Stanney et al [17] identify wayfinding, navigation, selection and manipulation to enhance usability, as well as ease of interaction, user-initiated control, pictorial realism, length of exposure, social factors and system factors to enhance presence. They also identify isolation, inclusion, natural mode of interaction and control, availability and perception of an encompassing stimulus stream, and supporting perception of self-movement to increase immersion. For Lin and Parker [10], shrink the field of view (e.g., 60°), visual scene not presented in stereo, slow visual scene movements (e.g., 0.03 Hz), allow user to be in an active mode of interaction with the visual scene and use visual interventions to provide predictive cues for upcoming motion are options that decrease cyber sickness (experience consequence). These previous guidelines could be a starting point for future research on guidelines to help designers of edutainment applications in the VE design process. In addition, the use of our questionnaire may be extended to different types of VE such as therapeutic, design or collaborative applications. Moreover, this experimental protocol can be extended to different types of devices (in this study we used a HMD and a CAVE) such as, Z-space, six-sided CAVE, stereoscopic wide screens, ...
ACKNOWLEDGMENTS
Our thanks go to Laval Agglomération and the Mayenne department for their financial support, to EON Reality for their contribution to this work and to the participants who took time to engage and provide feedback in this project.
REFERENCES
[1] A., Aranda, O., Dieste & N., Juristo, 2014, May. Evidence of the presence of bias in subjective metrics: Analysis within a family of experiments. In Proceedings of the 18th International Conference on Evaluation and
Assessment in Software Engineering (p. 24). ACM.
[2] C., Ardito, P., Buono, D., Caivano, M. F., Costabile & R., Lanzilotti, 2014. Investigating and promoting UX practice in industry: An experimental study.
International Journal of Human-Computer Studies, 72(6), 542-551.
[3] O., Baus, S., Bouchard, V., Gougeon & F. X., Roucaut, 2011. Comparison of anxiety in response to virtual spiders while immersed in augmented reality, head-mounted display, or CAVE-like system. Journal of Cybertherapy and
Rehabilitation, 4(2), 171-175.
[4] D.A., Bowman, A., Datey, U., Farooq, Y.S., Ryu & O., Vasnaik, 2001. Empirical Comparisons of Virtual Environment Displays, Technical Report
TR-01-19, Dept. of Computer Science, Virginia Tech.
[5] D. C., Gosselin & J. L., Macklem-Hurst, 2002. Pre-/post-knowledge
assessment of an earth science course for elementary/middle school education majors. Journal of Geoscience Education, 50(2), 169-175.
A surround display warp-mesh utility to enhance player engagement. In
International Conference on Entertainment Computing (pp. 46-56). Springer
Berlin Heidelberg.
[7] W., Hürst & M., Helder, 2011, November. Mobile 3D graphics and virtual reality interaction. In Proceedings of the 8th International Conference on
Advances in Computer Entertainment Technology (p. 28). ACM.
[8] J., Kjeldskov, 2001. Interaction: Full and partial immersive virtual reality displays. IRIS24, 587-600.
[9] M., Krijn, P. M., Emmelkamp, R., Biemond, C. D. W., de Ligny, M. J., Schuemie & C. A., van der Mast, 2004. Treatment of acrophobia in virtual reality: The role of immersion and presence. Behaviour research and therapy, 42(2), 229-239.
[10] J. J., Lin & D. E., Parker, 2007. User Experience Modeling and Enhancement for Virtual Environments That Employ Wide-Field Displays. In Digital
Human Modeling, 423–33. Springer.
[11] R. P., McMahan, D. A., Bowman, D. J., Zielinski & R. B., Brady, 2012. Evaluating display fidelity and interaction fidelity in a virtual reality game.
IEEE Transactions on Visualization and Computer Graphics, 18(4), 626-633.
[12] M., Melo, T., Rocha, L., Barbosa & M., Bessa, 2016, November. Presence in virtual environments: Objective metrics vs. subjective metrics—A pilot study. In Computação Gráfica e Interação (EPCGI), 2016 23° Encontro Português de (pp. 1-6). IEEE.
[13] A., Nemery, E., Brangier & S., Kopp, 2011. First validation of persuasive criteria for designing and evaluating the social influence of user interfaces: justification of a guideline. In A. Marcus (Ed.): Design, User Experience, and
Usability, LNCS 6770, pp.616-624.
[14] M., Pike & E., Ch'ng, 2016, December. Evaluating virtual reality experience
and performance: a brain based approach. In Proceedings of the 15th ACM
SIGGRAPH Conference on Virtual-Reality Continuum and Its Applications in Industry-Volume 1 (pp. 469-474). ACM.
[15] J., Polcar & P., Horejsi, 2013. Knowledge Acquisition and Cyber Sickness: A Comparison of VR Devices in Virtual Tours. Science.
[16] M., Sagardia, & T., Hulin, 2017, March. Evaluation of a penalty and a constraint-based haptic rendering algorithm with different haptic interfaces and stiffness values. In Virtual Reality (VR), 2017 IEEE (pp. 64-73). IEEE. [17] K. M., Stanney, M., Mollaghasemi, L., Reeves, R., Breaux & D. A., Graeber,
2003. Usability engineering of virtual environments (VEs): identifying multiple criteria that drive effective VE system design. International Journal
of Human-Computer Studies, 58(4), 447-481.
[18] K., Tcha-Tokey, E., Loup-Escande, O., Christmann & S., Richir, 2016. A questionnaire to measure the User Experience. In Proceedings of the 18th
Virtual Reality International Conference VRIC (pp. 19). ACM.
[19] K., Tcha-Tokey, E., Loup-Escande, O., Christmann & S., Richir, 2016. Proposition and Validation of a Questionnaire to Measure the User Experience in Immersive Virtual Environments. The International Journal of Virtual
Reality, 16 (01): 33-48
[20] K., Vredenburg, J. Y., Mao, P. W., Smith, & T., Carey, 2002. A survey of user-centered design practice. In Proceedings of the SIGCHI conference on