ORIGINAL ARTICLE
Validation of a new cardiac image fusion software
for three-dimensional integration of myocardial
perfusion SPECT and stand-alone 64-slice CT angiography
Oliver Gaemperli&Tiziano Schepis&Victor Kalff&
Mehdi Namdar&Ines Valenta&Laurent Stefani&
Lotus Desbiolles&Sebastian Leschka&Lars Husmann&
Hatem Alkadhi&Philipp A. Kaufmann
Received: 3 July 2006 / Accepted: 17 November 2006 / Published online: 24 January 2007 # Springer-Verlag 2007
Abstract
Purpose Combining the functional information of SPECT myocardial perfusion imaging (SPECT-MPI) and the morphological information of coronary CT angiography (CTA) may allow easier evaluation of the spatial relation-ship between coronary stenoses and perfusion defects. The aim of the present study was the validation of a novel software solution for three-dimensional (3D) image fusion of SPECT-MPI and CTA.
Methods SPECT-MPI with adenosine stress/rest 99m Tc-tetrofosmin was fused with 64-slice CTA in 15 consecutive
patients with a single perfusion defect and a single significant coronary artery stenosis (≥50% diameter steno-sis). 3D fused SPECT/CT images were analysed by two independent observers with regard to superposition of the stenosed vessel onto the myocardial perfusion defect. Interobserver variability was assessed by recording the X, Y, Z coordinates for the origin of the stenosed coronary artery and the centre of the perfusion defect and measuring the distance between the two landmarks.
Results SPECT-MPI revealed a fixed defect in seven patients, a reversible defect in five patients and a mixed defect in three patients and CTA documented a significant stenosis in the respective subtending coronary artery. 3D fused SPECT/CT images showed a match of coronary lesion and perfusion defect in each patient and the fusion process took less than 15 min. Interobserver variability was excellent for landmark detection (r=1.00 and r=0.99, p< 0.0001) and very good for the 3D distance between the two landmarks (r=0.94, p<0.001).
Conclusion 3D SPECT/CT image fusion is feasible, repro-ducible and allows correct superposition of SPECT seg-ments onto cardiac CT anatomy.
Keywords SPECT/CT fusion imaging . Coronary artery disease . CT angiography . Myocardial perfusion imaging
Introduction
Multislice CT angiography (CTA) has proven to be a valuable alternative to diagnostic invasive coronary angi-ography (CA) for the evaluation of many subgroups of
O. Gaemperli
:
T. Schepis:
M. Namdar:
I. Valenta:
P. A. Kaufmann (*)
Nuclear Cardiology, Cardiovascular Center, University Hospital Zurich,
Raemistrasse 100, 8091 Zurich, Switzerland e-mail: [email protected] V. Kalff
Department of Nuclear Medicine, Alfred Hospital, Melbourne, Australia
L. Stefani
GE Healthcare Bio-Sciences, 283 rue de la Minière, 78533 Buc Cedex, France
L. Desbiolles
:
S. Leschka:
L. Husmann:
H. AlkadhiInstitute of Diagnostic Radiology, University Hospital Zurich, Zurich, Switzerland
P. A. Kaufmann
Zurich Center for Integrative Human Physiology (ZIHP), University of Zurich,
patients with known or suspected coronary artery disease (CAD) [1]. However, although both are accurate tools for the assessment of coronary luminology, purely morpho-anatomical methods are poor at predicting the functional relevance of coronary stenoses [2]. An accurate, non-invasive technique for the evaluation of CAD should provide complementary information on coronary anatomy and pathophysiological lesion severity [3–6].
The integration of morpho-anatomical and functional information from CTA and myocardial perfusion imaging (MPI) may provide useful additional information for the clinician [7]. Earlier studies conducted with three-dimensional (3D) image fusion of CA and single-photon emission computed tomography (SPECT) showed promis-ing results [8–10] but were not purely non-invasive. Recent advances in computer technology have generated software solutions that allow 3D visualization of fused image data sets by combining the functional and anatomical informa-tion from MPI and CTA [11]. In addition to being intuitively convincing, these images provide a panoramic view of the myocardium, the regional myocardial perfusion and the coronary artery tree, thus eliminating uncertainties in the relationship of perfusion defects and diseased coronary arteries in watershed regions [12]. This may be particularly helpful in patients with multiple perfusion abnormalities and complex CAD.
The aim of the present study was the validation of a novel software package designed for 3D image fusion of MPI and CTA data sets obtained on a separate SPECT and a stand-alone 64-slice CT scanner.
Materials and methods
Patient population
To reduce the potential difficulties when analysing patients with multivessel disease, all patients with a single signif-icant stenosis on CTA and a single perfusion defect on SPECT-MPI were identified from a database of 160 consecutive patients referred to our department for SPECT-MPI and CTA. A cohort of 15 patients with a single significant stenosis on CTA and a single perfusion defect on MPI were identified for inclusion in the study. Reasons for patient referral were typical or atypical chest pain, pathological tread mill test and dyspnoea. The study was approved by the local institutional review board and all patients gave written informed consent before enrolment.
Myocardial perfusion imaging
All patients underwent a 1-day adenosine-stress/rest MPI protocol. Pharmacological stress was induced by an
infusion of adenosine at a standard rate of 140 μg/kg per minute [13] for 7 min and a dose of 300–350 MBq99m Tc-tetrofosmin was injected 3 min into the pharmacological stress. At least 1 h following completion of the stress image, an injection of 900 MBq was given with the patient at rest. SPECT imaging was then repeated to obtain a rest MPI study. The SPECT studies were acquired with a dual-head detector camera (Millennium VG & Hawkeye, GE Healthcare); a low-energy, high-resolution collimator; a 20% symmetrical window at 140 keV; a 64×64 matrix; an elliptic orbit with step-and-shoot acquisition at 3° intervals over 180°; and a 20-s dwell time per stop.
The SPECT image set was reconstructed on a dedicated workstation (Xeleris, GE Healthcare) using an iterative reconstruction algorithm (OSEM, ordered-subsets expecta-tion maximizaexpecta-tion) with two iteraexpecta-tions and ten subsets into short-axis, vertical long-axis and horizontal long-axis slices encompassing the entire left ventricle. X-ray-based attenua-tion correcattenua-tion was performed as previously reported [14,
15]. In addition, polar maps of perfusion were produced using a commercially available software package (Cedars QGS/QPS; Cedars-Sinai Medical Center, Los Angeles, California, USA) [16]. Defects in the anterior and septal wall were allocated to the left anterior descending coronary artery (LAD), defects in the lateral wall to the left circumflex coronary artery (LCX) and inferior defects to the posterior descending artery, usually arising from the right coronary artery (RCA). In the boundaries of coronary territories, allocation was determined according to the main extension of the defect onto the lateral, anterior or inferior wall. Fixed perfusion defects were considered as myocardial scar tissue and reversible defects as ischaemia. A reversal of 15% or more of the stress defect was defined to represent significant reversibility, as previously reported [17].
Sixty-four-slice CTA
The CTA images were acquired with a 64-detector CT scanner (LightSpeed VCT, GE Healthcare) with a collima-tion of 64×0.625 mm and a total z-axis coverage of 40 mm. The minimal gantry rotation time was 0.35 s, the tube voltage 120 kV, tube current from 280 to 750 mA using ECG modulation and the pitch 0.18–0.26 depending on the patient’s heart rate, resulting in an isotropic voxel resolu-tion of 0.35 mm and a temporal resoluresolu-tion of 87–175 ms. After two localization scans, a low-dose native scan of the heart was performed for coronary calcium detection and scoring. Test bolus tracking with 15 ml of non-ionic contrast agent (Ultravist 370 mg/ml, Schering AG, Berlin, Germany) was applied to calculate the exact arrival time of contrast agent in the coronary arteries, with a region of interest in the proximal part of the ascending aorta. A bolus of 70–100 ml of contrast agent was continuously injected
into an antecubital vein (50–80 ml at 5.0 ml/s, then 20 ml at 3.5 ml/s), followed by a saline chaser bolus of 50 ml at a flow rate of 3.5 ml/s. Thereafter scanning was initiated covering the distance from the tracheal bifurcation to the diaphragmatic side of the heart during a single inspiratory breath hold for an acquisition time of 5–7 s. Motion artefacts can be minimized by scanning at low heart rates [18]; therefore patients with heart rates of >65 beats per minute were pretreated intravenously with 5–10 mg of metoprolol tartrate (Lopresor, Sankyo Pharma AG, Swit-zerland) directly before the scan. For optimal heart phase selection, retrospective ECG gating was used. Retrospec-tive reconstruction of the image data was performed for acquisition of phase images starting from early systole (5% of the R-R interval) and ending at late diastole (95% of the R-R interval) using 10% increments. All images were reconstructed with an effective slice thickness of 0.625 mm at an increment of 0.625 mm.
Reconstructed image data were transferred to a remote workstation (Advantage Workstation 4.3, GE Healthcare). The CTA data sets were analysed using axial source images, multiplanar reformations (MPR) and thin-slab maximum intensity projections (MIP). Image quality was determined for each segment and for the whole image set and was graded as excellent (no motion artefacts present), good (minor motion artefacts present), moderate (substan-tial motion artefacts present, but luminal assessment of significant stenoses still possible), heavily calcified (vessel lumen obscured by calcifications) or blurred (only contrast visualization inside the vessel possible). The coronary arteries were evaluated according to a 15-segment model proposed by the American Heart Association [19]. Seg-ments with heavy calcifications or severe motion artefacts were excluded as they were not amenable to reliable luminal interpretation. Coronary lesions were visually assessed with regard to vessel delineation, and a diameter stenosis≥50% was considered significant.
Image fusion
Integration of SPECT perfusion findings with CTA images was performed on a designated workstation (Advantage Workstation 4.3, GE Healthcare) using the CardIQ Fusion software package (GE Healthcare). This software allows the overlay of functional information over the CT anatomy of a patient’s heart. It includes several tools and protocols for optimized image fusion that are described in detail below.
Image coregistration
The Fusion QC protocol is the first step of the fusion workflow. It allows the user to align the images on axial,
sagittal and coronal image planes in order to obtain a better matching of structural and functional information (Fig.1a). The protocol further includes automatic orientation of both anatomical and functional data sets using the standard cardiac orientations [20]. In addition to translational alignment, this protocol allows for manual correction of the left ventricular (LV) rotation along its long axis (Fig. 1a) using the transition of right to left ventricle as a hinge point (arrow in Fig.1a).
Definition of left ventricular epicardium
The LV Epicardium QC protocol displays a view contain-ing the segmented CT LV epicardium uscontain-ing conventional volume-rendering technique [21], allowing addition or removal of structures from the LV epicardium if needed (Fig. 1b). The aim of this protocol is to visually check the segmentation of the epicardium from CT and the accuracy of the registration and of the mapping of the perfusion information. Every voxel of the volume has an opacity value and a colour. The opacity ramp is based on the Hounsfield units of the CT data. The colour of the surface is generated based on the perfusion information. In each point of the surface of the volume-rendered image the colour is computed as being the maximum perfusion intensity on a ray going from the particular point to the centre of the heart on CT, as illustrated in Fig. 1b. The window presets for the colour scale were adopted from the corresponding separate SPECT images and remained unchanged during the fusion process.
Coronary tree segmentation
The coronary artery segmentation is performed using the last protocol of the fusion software, the Hybrid Display protocol. This protocol allows one to grow the coronary arteries from the ascending aorta using automatic vessel tracking or manual segmentation. The algorithms used for adding or removing coronary arteries are based on morphological techniques for segmentation, using the density value of the pixels and local shape parameters (tube likeliness for vessels). The protocol further extracts the ascending aorta and the coronary arteries from its surrounding tissue, allowing them to be viewed in isolation using a 3D volume-rendered coronary tree (Fig.1c).
3D volume-rendered fusion images
As the final step, the Hybrid Display protocol displays a volume rendering containing the LV epicardial volume segmented in the LV Epicardium QC protocol, the volume-rendered coronary tree obtained with the Hybrid Display protocol, and the left and right heart chambers acquired by
an automatic segmentation algorithm (Fig.1d). Implemen-tation of a cardiac transparency tool enables the user to render any of these structures transparent, for example the right ventricle, allowing for better visualization of the septal wall as shown in Fig. 1d. The Hybrid Display protocol includes a 3D toolbox for display of the 3D images in multiple projections, including anterior, posterior, left anterior oblique, right anterior oblique, left posterior oblique, right posterior oblique, left lateral, right lateral and apical.
Coronary angiography
In patients referred for conventional CA, the angiographic results were used for comparison with CTA findings. Invasive coronary angiograms were visually evaluated by a single observer using the same 15-segment model as was implemented in the CTA analysis [19]. Stenosis severity was visually assessed according to the maximal luminal
diameter stenosis present in each segment. A stenosis≥50% was considered a significant coronary lesion.
Data interpretation and statistical analysis
All fused 3D SPECT/CT images were processed and analysed by two independent experienced nuclear cardiol-ogists with regard to the relation of the perfusion defect and the corresponding coronary artery stenosis. The relation of perfusion defect and coronary artery stenosis was classified as match or mismatch. Superposition of the stenosed vessel onto the myocardial perfusion defect was considered a match.
Because of a paucity of distinct anatomical landmarks, measurement of interobserver variability in image coregis-tration is difficult if this is done by comparing the differences in overlap of the contrast and scintigraphic left ventricular outlines. Thus the coronary artery tree was substituted for the contrast left ventricular study. Repro-ducibility of image coregistration was then assessed by
Fig. 1 Illustration of the main protocols in the CardIQ Fusion software (a–d). The main protocols include tools for image coregistration,
measuring the X, Y, Z components of the origin of the stenosed coronary artery and of the centre of the perfusion defect on the fused images. The X, Y, Z values were obtained by positioning the cursor over each landmark and recording the spatial coordinates of a 3D grid inherent in the CT data set (X-axis = laterolateral axis, Y-axis = dorsoventral axis, Z-axis = craniocaudal axis) using the CardIQ Fusion software. The coordinates of the first landmark (origin of the stenosed vessel) were recorded on axial slices, and for the coordinates of the second landmark (centre of the perfusion defect) the cursor was positioned on the epicardial surface of the volume rendering and its position confirmed on the axial slices. Furthermore, the distance between the two landmarks was calculated from the corresponding X, Y, Z components.
Statistical analysis was performed using the SPSS software (version 12.0.1 for windows, SPSS Inc., Chicago, IL). All numerical values are given as mean±SD. Linear regression analysis and Bland-Altman limits of agreement were applied to assess reproducibility. The reproducibility coefficient was calculated as 1.96 times the SD of the differences as proposed by Bland and Altman [22]. p values <0.05 were considered to be statistically significant.
Results
The 15 patients had a mean age of 66±9 years and five were females. The mean body mass index was 27±5 kg×m−2. In all the patients, CTA was performed within 2±5 days (range 0–16 days) of the MPI study. All patients were clinically stable between the CTA and SPECT-MPI studies.
Myocardial perfusion imaging
The locations of the perfusion defects in each of the 15 patients are listed in Table 1. Seven of the 15 perfusion defects were fixed, five were reversible and three were mixed. In the latter three cases the reversible perfusion defect was clearly allocated to the same coronary artery territory as the fixed perfusion defect. Four fixed perfusion defects were allocated to the inferior wall, which is more prone to attenuation artefacts. However, in three of these cases a history of inferior myocardial infarction and in the other case a regional wall motion abnormality on gated SPECT supported the validity of the MPI findings.
Sixty-four-slice CTA
The mean heart rate during the CT scan was 58±8 bpm and in six patients pretreatment with metoprolol was adminis-tered. CTA image quality was rated as excellent in six cases, good in six cases, and moderate (but interpretable) in three cases. The mean coronary calcium score was 716± 1,106 Agatston score equivalents. A total of 209 coronary segments in 60 coronary arteries were analysed. Five (2%) and seven (3%) segments were not amenable to visual interpretation owing to motion artefacts or heavy calcifica-tions, respectively. Stenoses≥50% were found in 27 (14%) of the remaining 197 segments. Six patients had significant stenoses in more than one segment, representing serial stenoses of the same vessel. In two patients no stenoses could be seen on CTA as both had undergone percutaneous transluminal coronary angioplasty previously. Locations of prior or current coronary stenoses are summarized in
Table 1 Results of CTA, MPI and SPECT/CT fusion
M male, F female, Mid middle, Prox proximal, LCX left circumflex artery, DA1 first diagonal branch, LAD left anterior descending artery, RCA right coronary artery, PLA posterolateral artery, PDA posterior descending artery, OM obtuse marginal branch
a
Match and Mismatch denote correct or incorrect superposi-tion of stenosed coronary artery and myocardial perfusion defect on 3D fused SPECT/CT images
bStatus post percutaneous
transluminal coronary angioplasty; no significant residual stenosis found on CTA
Patient no. Gender (M/F) Age (years)
CTA results MPI results SPECT/CT
fusiona Location of coronary stenosis Reversible perfusion defect Fixed perfusion defect Match/ mismatch
1 M 67 Prox LCX Lateral Match
2 M 61 DA1b Anterior Match
3 M 76 Prox RCA Inferior Match
4 F 67 Prox LAD Anterior Match
5 F 76 PLA/LCX Laterobasal Match
6 M 60 PDAb Infero-apical Match
7 F 59 OM/LCX Lateral Lateral Match
8 F 77 Prox LAD Antero-apical Match
9 M 50 Prox LAD Anteroseptal Anteroseptal Match
10 M 71 Prox LAD Antero-apical Match
11 M 55 Prox RCA Inferoseptal Inferoseptal Match
12 M 75 Prox LAD Apical Match
13 M 66 Mid LAD Apical Match
14 F 56 Prox LAD Apical Match
Table1. Eight stenoses were confined to the LAD, three to the LCX and four to the RCA.
Comparison of CTA and CA
Invasive CA was performed in 12 (80%) of the 15 patients within 21±29 days of the CTA study. In these 12 patients, 165 coronary segments in 48 coronary arteries were analysed on CTA. Five (3%) and four (2%) segments were excluded owing to severe motion artefacts and heavy calcifications, respectively. CTA revealed stenoses ≥50% in 21 (13%) of the remaining 156 segments, several patients having sequential lesions affecting only one coronary artery. Sensitivity, specificity, and negative and positive predictive values of CTA for the detection of coronary stenoses assessed as ≥50% on CA were 94%, 97%, 99% and 81%, respectively.
3D SPECT/CT fusion
SPECT/CT fusion was successfully performed in all patients. All the perfusion defects were deemed to be—by separate analysis—in the territory of the single stenosed artery of the CTA images. The processing time for image fusion was dependent on the complexity of the coronary anatomy and on the quality of the CT images, but less than 15 min was required for completion. However, less than 2 min of this time is needed for the alignment itself, while the rest of the time is spent on tracking the vessel tree. All
myocardial perfusion defects seen on the SPECT study were clearly depicted on the fused 3D SPECT/CT images, and no additional MPI defects were introduced by the fusion process. A match of coronary artery stenosis and perfusion defect territory was found in every patient by both independent investigators (Table 1). Figures 2 and 3
show illustrative cases of 3D SPECT/CT fusion with their respective separate studies.
Interobserver variability
On the fused 3D images, no significant differences were found in the X, Y, Z components for the origin of the stenosed coronary artery (X: 23.2±11.7 vs 24.6±12.2; Y: 25.1±22.6 vs 25.1±21.5; Z: 111.9±22.4 vs 112.1±21.4; p=NS) and the centre of the perfusion defects (X: 68.2± 14.6 vs 69.8±14.3; Y: 44.3±23.2 vs 46.3±24.3; Z: 155.5± 33.9 vs 158.9±34.2; p=NS) between the two readers. Linear regression analysis revealed an excellent correlation of the pooled X, Y, Z components for both the origin of the stenosed artery (r=1.00. p<0.0001) and the centre of the perfusion defect (r = 0.99, p < 0.0001) (Fig. 4). Bland-Altman plots showed narrow limits of agreement and no significant bias between the readers (Fig.4). The reproduc-ibility coefficients for the pooled X, Y, Z components by Bland-Altman analysis were 5.6 (10.5% of the average X, Y, Z components) for the origin of the stenosed artery and 9.8 (10.8%) for the centre of the perfusion defect.
The 3D distance measured from the origin of the stenosed artery to the centre of the perfusion defect was
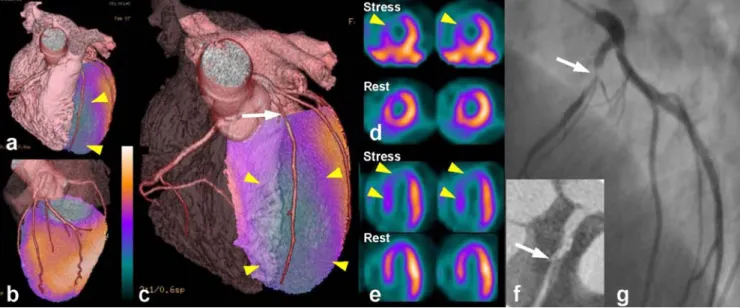
Fig. 2 A 50-year-old male patient (no. 9) referred for typical chest pain. Anterior (a) and lateral (b) views of the fused 3D SPECT/CT images show a large anterior perfusion defect (arrowheads) and preserved perfusion in the lateral and inferior wall. After fading away the right ventricle (c), the culprit lesion of the proximal LAD (arrow) and a corresponding large anteroseptal perfusion defect (arrowheads)
can be seen. The short axis (d) and horizontal long axis (e) slices of the SPECT study confirm the partially reversible anteroseptal perfusion defect (arrowheads). The curved reformation of 64-slice CTA ( f ) shows a high-grade stenosis of the proximal LAD (arrow) that was confirmed by conventional CA (g)
comparable for the two readers (73.3 ±19.2 vs 75.8 ± 19.3 mm, p=NS), and a good correlation was found between the readers (r=0.94, p<0.001). The reproducibility coefficient on Bland-Altman analysis was 13.0 mm (17.5%). Figure 5 shows clinically minor differences in coregistration of images from the case with the largest interobserver difference in 3D distance between the origin of the stenosed artery and the centre of the perfusion defect.
Discussion
This study demonstrates that 3D SPECT/CT image fusion from image sets obtained on stand-alone scanners with this new software package is feasible and reliable, allowing correct superposition of SPECT segments onto cardiac CT anatomy. As a result, it provides an easily interpretable panoramic view of the heart, integrating the high-resolution
3D information of the coronary arteries with the functional information of SPECT-MPI indicating the lesion severity. This may facilitate a comprehensive non-invasive assess-ment of CAD that yields compleassess-mentary information on a coronary lesion and its pathophysiological relevance.
Despite many technical advances in invasive CA, the definition of functionally relevant coronary stenoses by purely morpho-anatomical criteria remains controversial. In fact, although it is generally accepted that a coronary stenosis ≥50% starts to be haemodynamically significant, many factors that cannot be fully evaluated by coronary luminology (including both CA and CTA) will eventually determine whether a given lesion produces stress-induced ischaemia or not [23]. Therefore, it has become clinical standard to require proof of ischaemia by a non-invasive test before considering revascularization procedures [4–6]. Currently, the integration of functional and morpholog-ical information is performed by mentally combining the
Fig. 3 A 59-year-old female patient (no. 7) referred for pathological tread mill test. The fused 3D SPECT/CT images (a, b) show a lateral perfusion defect at rest (right) that increased in size after pharmaco-logical stress (left) (arrowheads) and was caused by an occluded
obtuse marginal branch (OM) (arrow). The volume-rendered 3D CT vessel tree (c) shows the occluded OM (arrow), which was confirmed by conventional coronary angiography 24 days later (d)
angiographic findings with the SPECT perfusion images. However, the planar projections of coronary angiograms and axial slice-by-slice display of cardiac MPI studies make a subjective integration difficult. This may lead to inaccu-rate allocation of the coronary lesion to its subtended myocardial territory, particularly in patients with multi-vessel disease and intermediate severity lesions. There have been several attempts at fusing conventional CA with myocardial perfusion distribution [8–10]. In addition to
the disadvantages inherent in warping and 3D unification to force a planar 2D angiogram into a fusion with a 3D MPI data set, this approach does not allow non-invasive preplanning of the intervention as the information on the coronary anatomy is obtained by invasive CA. Further-more, the fusion process is time consuming and, therefore, not helpful for rapid decision making during an ongoing intervention. As a consequence, these techniques have not been adopted in daily clinical routine. Ideally, this
comple-Fig. 4 a Linear regression analysis of pooled X, Y, Z components for the origin of the stenosed artery and for the centre of the perfusion defect measured by two independent readers. The line of identity is given in both graphs. b Differ-ences in X, Y, Z components for the origin of the stenosed artery and for the centre of the perfusion defect obtained by the two readers plotted against their average values (Bland-Altman plot). Mean denotes mean of differences; 1.96 SD denotes reproducibility coefficient
Fig. 5 3D fused SPECT/CT images (patient no. 5)
performed by two independent observers (reader 1 and reader 2) in the patient with the highest interobserver variability [measuring the distance from the origin of the stenosed left circumflex artery (arrow) to the centre of the lateral perfusion defect]. Despite minor observer-dependent differences in alignment of the SPECT and CT image sets, both fused images show a good match of perfusion defect and stenosed coronary artery and allow identification of the culprit lesion
mentary information should therefore be obtained com-pletely non-invasively in order to allow careful planning of the elective intervention. Despite its current limitations [24], the continuing rapid evolution of CTA suggests that, when combined with SPECT-MPI, it has the potential to be implemented into clinical practice and may well lead to a reduction in the frequency of overuse of angioplasty and stent placement, a key cost driver in invasive cardiology practice. Occasionally, when lesion anatomy appears unsuitable for angioplasty, bypass surgery may be consid-ered directly without the need for further preoperative diagnostic CA.
The current fusion software is robust, as evidenced by the quite acceptable degree of interobserver variation. Its measurement was rather challenging and the chosen method is recognized as an approximation because it does not take into account the 3D curve surfaces encountered in this study. Nevertheless, as seen from Fig. 5 showing the patient with the highest interobserver variation, this variability is unlikely to be clinically significant.
The length of time required to process the images is quite long at present. This is due to provision of the isolated coronary artery circulation. It is envisaged that the coronary tree which must also be created at the time of formal analysis of the CTA could be stored at that time in a format suitable for introduction during the fusion process. This will reduce processing to a much more useful time of about 2–3 min. Furthermore, it will reduce the significant learning curve in providing accurate CTA images acquired from patients with complex coronary anatomy and severely diseased vessels. This is evidenced in Fig.5, where there are differences in the ability to clearly delineate all the severely diseased circumflex vessels.
As the aim of the study was to validate the accuracy of the fusion software to correctly assign a perfusion territory to its subtending coronary artery, only patients with a single lesion and an isolated perfusion defect were included. Such validation seems pertinent as the integration of MPI with ever-improving multislice CT into hybrid scanners will promote the combined use of both techniques in the same patient. Intuitively, patients with complex or multivessel disease appear to be the subgroup who may benefit most from 3D image fusion. Further studies are required to draw firm conclusions about the potential role of integrated cardiac SPECT/CT in the assessment of CAD and may accelerate its clinical implementation.
Conclusion
3D SPECT/CT image fusion of image sets obtained on stand-alone scanners is feasible, reproducible and allows correct superposition of SPECT segments onto cardiac CT anatomy. This facilitates the acquisition of complementary
information on a coronary lesion and its pathophysiological relevance.
Acknowledgements This study was supported by a grant from the
Swiss National Science Foundation (SNSF-professorship grant No. PP00A-68835) and by a grant of the National Center of Competence in Research, Computer Aided and Image Guided Medical Interven-tions (NCCR CO-ME) of the Swiss National Science Foundation.
Victor Kalff’s sabbatical leave was financially supported by the Alfred
Hospital and its Whole Time Medical Specialists Fund, Melbourne, Australia.
References
1. Leschka S, Alkadhi H, Plass A, Desbiolles L, Grunenfelder J, Marincek B, et al. Accuracy of MSCT coronary angiography with 64-slice technology: first experience. Eur Heart J
2005;26:1482–7.
2. Topol EJ, Nissen SE. Our preoccupation with coronary luminol-ogy. The dissociation between clinical and angiographic findings
in ischemic heart disease. Circulation 1995;92:2333–42.
3. Namdar M, Hany TF, Koepfli P, Siegrist PT, Burger C, Wyss CA, et al. Integrated PET/CT for the assessment of coronary artery
disease: a feasibility study. J Nucl Med 2005;46:930–5.
4. Klocke FJ, Baird MG, Lorell BH, Bateman TM, Messer JV, Berman DS, et al. ACC/AHA/ASNC guidelines for the clinical
use of cardiac radionuclide imaging—executive summary: a
report of the American College of Cardiology/American Heart Association Task Force on Practice Guidelines (ACC/AHA/ ASNC Committee to Revise the 1995 Guidelines for the Clinical Use of Cardiac Radionuclide Imaging). Circulation 2003;108:1404–18.
5. Silber S, Albertsson P, Aviles FF, Camici PG, Colombo A, Hamm C, et al. Guidelines for percutaneous coronary inter-ventions. The Task Force for Percutaneous Coronary Interven-tions of the European Society of Cardiology. Eur Heart J
2005;26:804–47.
6. Smith SC Jr, Feldman TE, Hirshfeld JW Jr, Jacobs AK, Kern MJ, King SB 3rd, et al. ACC/AHA/SCAI 2005 guideline update for percutaneous coronary intervention: a report of the American College of Cardiology/American Heart Association Task Force on Practice Guidelines (ACC/AHA/SCAI Writing Committee to Update 2001 Guidelines for Percutaneous Coronary Intervention).
Circulation 2006;113:e166–e286.
7. Bax JJ, Beanlands RS, Klocke FJ, Knuuti J, Lammertsma AA, Schaefers MA, et al. Diagnostic and clinical perspectives of fusion imaging in cardiology: is the total greater than the sum of its
parts? Heart 2007;93:16–22.
8. Schindler TH, Magosaki N, Jeserich M, Oser U, Krause T, Fischer R, et al. Fusion imaging: combined visualization of 3D recon-structed coronary artery tree and 3D myocardial scintigraphic image in coronary artery disease. Int J Card Imaging 1999;15:357–68; discussion 69–70.
9. Schindler TH, Magosaki N, Jeserich M, Nitzsche E, Oser U, Abdollahnia T, et al. 3D assessment of myocardial perfusion parameter combined with 3D reconstructed coronary artery tree from digital coronary angiograms. Int J Card Imaging 2000;16:
1–12.
10. Faber TL, Santana CA, Garcia EV, Candell-Riera J, Folks RD, Peifer JW, et al. Three-dimensional fusion of coronary arteries with myocardial perfusion distributions: clinical validation. J Nucl
11. Nakaura T, Utsunomiya D, Shiraishi S, Tomiguchi S, Honda T, Ogawa H, et al. Three-dimensional cardiac image fusion using new CT angiography and SPECT methods. AJR Am J Roentgenol
2005;185:1554–7.
12. Gaemperli O, Schepis T, Kaufmann PA. SPECT-CT fusion imaging integrating anatomy and perfusion. Eur Heart J 2006; Jun 7:[Epub ahead of print].
13. Cerqueira MD, Verani MS, Schwaiger M, Heo J, Iskandrian AS. Safety profile of adenosine stress perfusion imaging: results from the Adenoscan Multicenter Trial Registry. J Am Coll Cardiol
1994;23:384–9.
14. Koepfli P, Hany TF, Wyss CA, Namdar M, Burger C, Konstantinidis AV, et al. CT attenuation correction for myocardial perfusion quantification using a PET/CT hybrid scanner. J Nucl Med 2004;
45:537–42.
15. Fricke H, Fricke E, Weise R, Kammeier A, Lindner O, Burchert W. A method to remove artifacts in attenuation-corrected myocardial perfusion SPECT introduced by misalignment be-tween emission scan and CT-derived attenuation maps. J Nucl
Med 2004;45:1619–25.
16. Germano G, Kavanagh PB, Waechter P, Areeda J, Van Kriekinge S, Sharir T, et al. A new algorithm for the quantitation of myocardial perfusion SPECT. I: Technical principles and repro-ducibility. J Nucl Med 2000;41:712–9.
17. Klein JL, Garcia EV, DePuey EG, Campbell J, Taylor AT, Pettigrew RI, et al. Reversibility eye: a new polar bull’s-eye map to quantify reversibility of stress-induced SPECT thallium-201 myocardial perfusion defects. J Nucl Med
1990;31:1240–6.
18. Hoffmann MH, Shi H, Manzke R, Schmid FT, De Vries L, Grass M, et al. Noninvasive coronary angiography with
16-detector row CT: effect of heart rate. Radiology 2005;234:86–
97.
19. Austen WG, Edwards JE, Frye RL, Gensini GG, Gott VL, Griffith LS, et al. A reporting system on patients evaluated for coronary artery disease. Report of the Ad Hoc Committee for Grading of Coronary Artery Disease, Council on Cardiovascular Surgery, American Heart Association. Circulation 1975;51:5–40. 20. Cerqueira MD, Weissman NJ, Dilsizian V, Jacobs AK, Kaul S,
Laskey WK, et al. Standardized myocardial segmentation and nomenclature for tomographic imaging of the heart: a statement for healthcare professionals from the Cardiac Imaging Committee of the Council on Clinical Cardiology of the American Heart
Association. Circulation 2002;105:539–42.
21. Fishman EK, Ney DR, Heath DG, Corl FM, Horton KM, Johnson PT. Volume rendering versus maximum intensity projection in CT angiography: what works best, when, and why. Radiographics
2006;26:905–22.
22. Bland JM, Altman DG. Statistical methods for assessing agree-ment between two methods of clinical measureagree-ment. Lancet 1986;1:307–10.
23. White CW, Wright CB, Doty DB, Hiratza LF, Eastham CL, Harrison DG, et al. Does visual interpretation of the coronary arteriogram predict the physiologic importance of a coronary stenosis? N Engl J Med 1984;310:819–24.
24. Garcia MJ, Lessick J, Hoffmann MH. Accuracy of 16-row multidetector computed tomography for the assessment of