HAL Id: hal-02887813
https://hal.archives-ouvertes.fr/hal-02887813
Submitted on 24 Feb 2021
HAL is a multi-disciplinary open access
archive for the deposit and dissemination of
sci-entific research documents, whether they are
pub-lished or not. The documents may come from
teaching and research institutions in France or
L’archive ouverte pluridisciplinaire HAL, est
destinée au dépôt et à la diffusion de documents
scientifiques de niveau recherche, publiés ou non,
émanant des établissements d’enseignement et de
recherche français ou étrangers, des laboratoires
Experimental imaging of internal waves by a mm-wave
radar
Glodina Connan, H.D. Griffiths, P.V. Brennan, D. Renouard, E. Barthelemy,
René Garello
To cite this version:
Glodina Connan, H.D. Griffiths, P.V. Brennan, D. Renouard, E. Barthelemy, et al.. Experimental
imaging of internal waves by a mm-wave radar. OCEANS’98 conference, Sep 1998, Nice, France.
pp.619-623, �10.1109/OCEANS.1998.724313�. �hal-02887813�
Experimental imaging of internal waves by a mm-wave radar
G. Connan1&2, H.D. Griffiths2, P.V. Brennan2, D. Renouard3, E. Barthelemy
3, R. Garello1
1
Departement ITI, ENST de Bretagne, France2
University College London, United Kingdom (UCL)3 Laboratoire des E coulements Geophysiques et Industriels, Grenoble, France (LEGI)
Abstract -This paper describes experimental work performed
within the Mesoscale Ocean Radar Sigpature Experiments (MORSE) project as part of the EC MAST-III programme. The aim of these experiments is to further the understanding of the imaging of internal waves by satellitf: SAR. Of particular interest to the project is the dependency oJr the imaging process on the radar wavelength in the millimetre range. Hence a laboratory mm-wave FMCW SAR (�14 GHz) has been developed at UCL. Then, two sets of ex1periments have been carried out above the linear flume and in the Coriolis circular wave-tank of LEGI, in Grenoble, in order to image surface wave fields in presence of an internal wave.
I. INTRODUCTION
The observation of internal waves in SAR images [1] has resulted in an increasing interest to understand the interaction of subsurface oceanic phenomena with surface waves. Indeed, this responds to the need for information on such phenomena in areas such as off-shore drilling and mining, fisheries, environmental monitoring as well as acoustic communication and detection.
Therefore, the MORSE project is developing numerical models to monitor subsurface phenomena. In particular, the project includes studies of non-linear hydrodynamic interactions between internal waves and surface gravity I capillary waves and basic radar backscattering processes to understand the main mechanisms involved in the radar imaging of internal waves.
As part of this work, a laboratory-based mm-wave Frequency Modulation Continuous Wave (FMCW) Synthetic Aperture Radar (SAR) has been developed [2]. It was used to study the backscattering of water surface at W band, in a set of experiments in LEGI from October 1997 until February 1998. First, the radar has been tested above a linear flume to estimate the characteristics of the backscattered signal for various radar front-end positions. Then, above a wave-tank, in which scaled versions of particular internal wave phenomena can be set-up under
laboratory conditions, SAR experiments have been carried out.
The laboratory radar main characteristics are summarised in Table 1. Two Pulse Repetition Frequency have been used throughout these measurements to evaluate the influence of noise at low-frequency in the radar IF receiver. Although the radar has a polarimetric capability, the results pr�sented here have been made in the VV mode, for it has provided stronger returns than HH mode from the illuminated water surface.
Table 1: Radar parameters
centre frequency fc 94GHz wavelength /..., 3.2 mm sweep bandwidth B 3GHz Pulse Repetition Frequency PRF 62 5 Hz 2 500 Hz IF bandwidth 100 kHz 400 kHz sweep duration T l .6 ms 0.4 ms antenna size dx X dv 7mmx5mm
slant range resolution AR 5 cm azimuth resolution Ax 0.5 to 1 cm This paper will focus on the experiments that have been carried out in LEGI, presenting results and a preliminary analysis of the phenomena that have been encountered.
II. WA VE TANK EXPERIMENTS
A. Experimental set-up
The Coriolis wave-tank is a 13 m diameter platform capable of rotating hence simulating the Coriolis effect due to earth rotation.
mternal wave and wedge-wave
...
.
...wave front
/,.I
propagation/ !
J/
l
illu
r:ni
natedl
areaFig. 1: Schematic top view of the wave-tank set-up
A solitary wave generator, a surface wave generator and a step-like bottom topography are installed in the tank
[3].
To generate an internal wave, the wave-tank is filled with a twolayer system: a 80 cm salted water column on top of which a 4 cm fresh water layer is slowly added. The fractional density difference Llp/p is
1
%. Thus an interface between the two layers is obtained and an internal wave can be produced by the rapid release of fresh water (100 l) from the solitary wave generator. The surface wave generator is a wedge wave generator and is put on top of the solitary wave generator. It produces surface wave of small amplitude to minimise destroying effects on the thin upper layer, which deteriorate the interface. The frequency of the waves thus generated can vary from 2 to 5 Hz.The radar front-end is mounted on a boom elevated by a support structure capable of moving at a speed of I mis on the edge of the tank. It is connected to the electronics and the PC for data acquisition by a 5 m cable. The whole equipment is installed on the support structure. The optimum radar position is found by taking the position, which gives the optimum sensitivity when looking at a modulated water surface. In particular, the radar position is chosen so that the look direction of the radar front-end is opposite to the wave propagation. Fig. I shows the set-up of the experiment.
During static measurements, the radar is placed at a height of 1. 7 m above the water surface, with an incidence angle of
35°. It is necessary to offset the radar front-end from the tank edge by
1.37
m so that the edge of the tank does not contribute to the backscattered signal. For SAR measurements, the radar is in the same position but the support structure is now moving at a speed of 0.755 mis above the illuminated area.For each new experiment, a clutter measurement is made, that is, a measurement of the backscattered signal when the illuminated water area is undisturbed by any wave.
Before trying SAR tests, a series of static experiments are made. They consist in taking a
1
s measurement of the signal backscattered by a water surface modulated by either the wedge-wave generator, or by the internal wave generator, or by both. The static I s measurement is equivalent to a series of snapshots of the waves, providing information in range. For a radar Pulse Repetition Frequency of 625 Hz, this means that a snapshot is taken every 1.6 ms, while for a PRF of 2500 Hz a snapshot is taken every 0.4 ms.As far as the internal wave detection is concerned, a series of tests has been dedicated to measure the time required by an internal wave to reach the sensitive water surface. To this end, an ultra-sound probe has been installed beneath the radar and after several tests, it has been concluded that the internal wave needed 75 s to reach the illuminated area. Thus, the internal wave imaging begins 75 s after the fresh water has been released from the internal wave generator. The ultrasonic probe are sensors which monitor the time variations of a sonic pulse downward through the interface between the upper (fresh) and lower (salted) layer. The accuracy in interface height variations with time is of
0(1
mm) and we can thus record the passing of a long internal interfadal wave.
For the SAR tests, the only difference with the static measurement set-up is that the support structure is moving, hence synthesising the aperture and providing information in range and azimuth. For our experiments, it has to be noted that the wave-tank itself is not moving. Indeed, the internal wave amplitude is smaller when the wave-tank is rotating. Since a maximum amplitude internal wave was more likely to be detected, the wave-tank remained static.
B.
Analysis of measurements
The first series of tests above the linear flume have shown that only a few points of the illuminated water surface are detected by the radar whichever the PRF is. These points correspond to ranges close to vertical incidence, i.e. close to the radar. This result might indicate that, in our experiment, ·
specular reflection is the main backscattering mechanism at W-band. Since only a small portion of the illuminated surface seems to contribute to the backscattered signal, the SAR trials above the wave-tank have not resulted in any concluding image for only a few points can be seen after processing. Another problem is the lack of information on
the motion errors of the moving platform. As a consequence, it is not possible to apply an autofocus processing on the data, which would compensate for these motion errors. Besides, the set-up of internal wave experiment,- in which the water surface is also modulated by a surface wave, is particularly tricky. The difficulty is to make sure that the wedge wave generator motion does not deteriorate the interface fresh water I salted water. Since the fresh water
layer is 4 cm high, the wedge wave generator can only produce small amplitude surface waves.
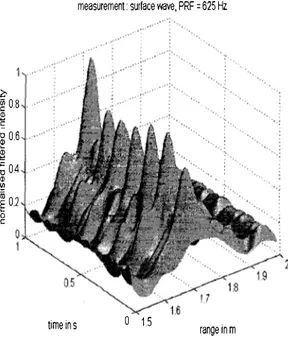
However, SAR data have been used in a time variation analysis that consists in following the variation of intensity of particular sensitive points of the water surface, at a known range from the radar front-end, in funcltion of time. In the next figures, intensities of several ranges will be plotted every 1.6 ms for a 625 Hz PRF and every 0.4 ms for a 2500 Hz PRF. The intensities are presented as a function of time and distance water surface - radar front-emd. They have been numerically smoothed and normalised. The main difference between the two PRF is the intensity of the backscattered signal, which for 625 Hz is bigger than for 2500 Hz.
For both PRF, the time analysis of two kinds of measurements has been performed: surface waves in presence of an internal wave and surface waves alone. By looking carefully at Fig. 2 & 3, it seems that the wave spectrum of the surface wave measurement is modulated in some form when an internal wave is present.
c
·� 0.8
�
� 06
�
� 04
Q) .'.£�
02
0 cmeasurement: surtace wave, PRF =
625 Hz
time ins
0 1.5
range in mFig. 2: Surface wave spectrum varying in time and range
One can notice that the clear peaks, appearing on Fig. 2, seem to be modulated, on Fig. 3, in function of time and they are also modulated in function of the distance. The same observation has been made on tests for 2500 Hz. This shows that the hydrodynamic interaction between the surface wave and the internal wave can be detected by the mm-wave radar.
Moreover, a time variation analysils of the spectrum obtained from surface wave modulations at frequency 2 Hz and 5 Hz has been performed. It shows that the radar (at a PRF of 2500 Hz) detects more peaks with a higher wedge wave frequency. However, the frequency of the peaks cannot
be directly related to wave characteristics such as velocity and spatial wavelength. This indicates that the mechanisms of backscattering involved at W-band are quite complex.
measurement: surtace wave & internal wave, PRF =
625 Hz
c
·� 0.8
�
0 1.5
time ins range in m
Fig. 3: Surface and internal wave spectrum
III. FLUME EXPERIMENTS
A. Experimental set-up
fixed rad
�
antennaIA-/
__ __,,,,
/.
I
Fig. 4: Flume schematic set-up
The long wave flume is 36 m long, 55 cm wide and 1.5 m high. It is filled with a fresh water column
25
cm high. Fig. 4 shows the flume experimental set-up.Above the linear flume, the mm-wave radar is used as a static radar, only providing range information. The first series of measurements in November 1997 were made with a radar tuned for PRF equal to 625 Hz. Preliminary tests have resulted in the optimum position of the radar front-end to detect the water surface when modulated by any wave generator, that is, a height above water level of 1.7 m and an elevation angle of 35°. Thus these first tests have been transferred to the Coriolis wave-tank site. In particular, the optimum position has been used for the Coriolis experiments from December 1997 to February 1998.
Besides, the radar has taken 1 s sequences of snapshots of the water surface modulated either by a wind-wave generator or a wedge-wave generator producing surface waves of varying frequency ( 1 Hz to 3 Hz) and amplitude (0.5 cm to 10 cm). The water surface is also sensed for two different surface tensions (clean surface and surface contaminated by colloidal particle).
Back to the flume site in February 1998, a new series of tests is performed with a PRF equal to 2500 Hz. The radar front-end is now mounted 1.45 m above the water surface, with an elevation angle of 35°.
B.
Analysis of measurements
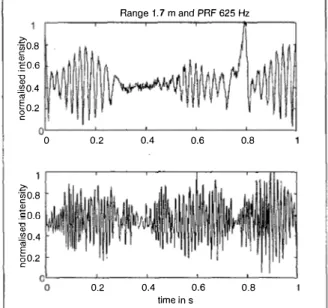
During the first series of experiments in November 1997, the analysis has focused on time variations of the most sensitive range in each measurement, for a PRF of 625 Hz. In particular, it is interesting to see the effect of capillary waves on the detected signal. Fig. 5 presents the time variations of tests performed on a water surface modulated by the wedge wave generator at frequencies of 1 Hz and 2 Hz. -
�
o.8 c Q) _-go.6 "O Q) �0.4 "'§
0.2 c Range 1. 7 m and PRF 625 Hz o����������-'-��--'-��---' ·�
c o.8 Q) _';;o.6 'O Q) �0.4 "' E C;0.2 c 0 0.2 0.4 0.6 0.8 0.2 0.4 0.6 0.8 time insFig. 5: Time variation for wedge wave frequency of 1 Hz on the top plot and 2 Hz on the bottom plot
As can be seen on Fig. 5, there seems to be, in each plot, two modulations: a slow one and a very rapid one. In the 1 Hz case, the rapid modulations have a frequency of 40 Hz, while for 2 Hz, they have a frequency of 80 Hz. It is more difficult to estimate the slow modulation and it is apparently not related to the frequency of the wedge-wave. The rapid modulations are thought to be related to the capillary waves on the front side of the surface wave crests. They appear as bursts, which typically last 0.2-0.3 s.
This result has led to the idea that if the capillary waves could be damped, the time variation would be different. To this end, the surface tension of the water surface has been modified using very fine saw dust. Fig. 6 demonstrates very well the effect of the damping of the capillary waves. On plot (a), the capillary waves are visible when the water surface is modulated by the wedge-wave only. Plot (b) is simply a numerically filtered version of plot (a); this removes partially the rapid variations due to capillary waves. In the experiment (c), the saw dust has contaminated the water surface and no capillary waves can be seen on the wave crests. This phenomenon is also visible on the plot (c) where the rapid modulations have disappeared.
(•)o
�
0 0.2 0.4 0.6 0.8 1�):F!�
0.7 0 0.2 0.4 0.6 0.8 1 (0)0:
�5!1
0 0.2 0.4 0.6 0.8 time insFig. 6: Normalised intensity at range 1.7 m (a) 3 Hz wedge wave modulated surface
(b) filtered version of (a)
(c) 3 Hz wedge wave modulated surface modified by saw dust
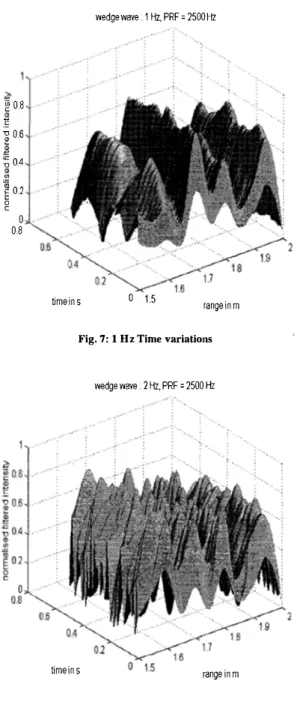
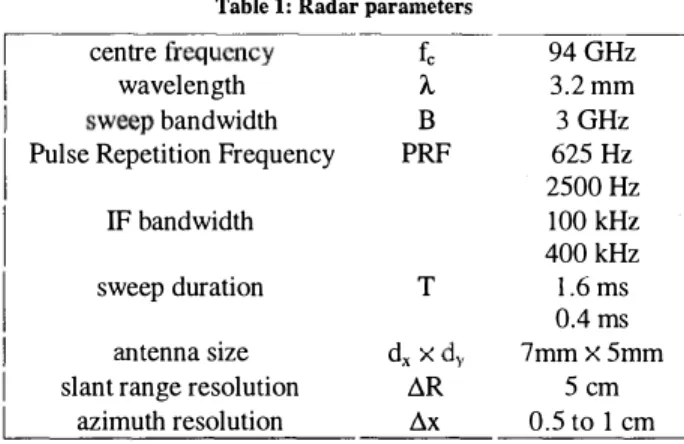
In February 1998, 0.5 s measurements were carried out above the linear flume, the radar hardware being tuned to a PRF of 2500 Hz and the amplitude of the wedge wave being kept very small, of the order of the centimetre. Fig. 7 & 8 show the time variations respectively for wedge wave frequencies of lHz and 2 Hz. For 1 Hz, a modulation in function of the distance is clearly visible but the spectrum remains quite constant in function of time. On Fig. 8, it is
clear that a higher frequency produces more peaks in the spectrum and modulations appear both in distance and time.
?;-
�
08 .�
�
06 ��
04.�
�
02 0 c 0 0.8 wedge wme • 1 Hz, PRF = 2500 Hztime ins 0 1.5 range in m
Fig. 7: 1 Hz Time variatio111s
wedge wme • 2 Hz, PRF = 2500 Hz
time ins range in m
Fig. 8: 2 Hz Time variations
V. DISCUSSION
To relate the peaks appearing on the figures presented in this paper, it is interesting to evaluate the number of wave crests likely to occur within 1 s for the wedge wave frequencies we used. Using the dispersion relation to calculate the surface wave phase velocity, it is found that the celerity and the spatial wavelength are respectively 1.3 mis
and 1.4 m for I Hz, 0. 7 mis and 0.35 m for 2 Hz, 0.5 mis and 0.17 m for 3 Hz. From these data, it is clear that the peaks of the figures do not correspond to wave crests. It is more likely that they are related to 'trains' of small capillary waves on the front and at the back of the wave crests [ 4]. These capillary waves have a very small spatial wavelength, even down to the millimetre region. Thus, the radar is probably mainly sensitive to these waves, for its wavelength is 3.2 mm. The idea is that the modulations appearing in time might be related to the capillary wave 'lifetime' and those seen in distance to their position on both sides of the surface wave.
The scattering mechanisms involved in these experiments at W-band are still under analysis. Their interaction with hydrodynamic modulations is apparently complex and deserves a thorough study, which is planned in the future work.
ACKNOWLEDGEMENTS
The authors are extremely grateful to the LEGI team of the Coriolis wave-tank and of the linear flume site, for their support and collaboration throughout these experiments. Special thanks are presented to Mr Guy Marrec whose contribution to the radar tuning, during the measurements, has been of a great value.
This work forms part of that carried out under the CEC MAST III Contract MAS3 CT95-0027 (DG12-ESCY). The authors wish to acknowledge with thanks the support provided by the EU contribution to the funding of the project.
REFERENCES
[1] Theory of radar imaging of internal waves, W.Alpers, Nature, 314, 245-248, 1985.
[2] FMCW-SAR development for internal wave imaging, G.Connan, H.D. Griffiths, P.V. Brennan, IEEE Oceans'97, Halifax, 6-9 October 1997.
[3] Generation of internal waves over a shelf: an experimental study, C.Ramirez and D.Renouard, European Geophysical Society XXII General Assembly, Vienna, 21-25 April 1997.
[4] A deterministic, coherent, and dual-polarized laboratory study of microwave backscattering from water waves, Part I: Short gravity waves without wind, S.Daniel, W.Kwoh and B.M.Lake, IEEE Journal of Oceanic Engineering, Vol. OE-9, NO 5, December 1984.
![Fig. 1: Schematic top view of the wave-tank set-up A solitary wave generator, a surface wave generator and a step-like bottom topography are installed in the tank [3]](https://thumb-eu.123doks.com/thumbv2/123doknet/12148202.311591/3.930.128.457.126.468/fig-schematic-solitary-generator-surface-generator-topography-installed.webp)