www.impactjournals.com/oncotarget/ Oncotarget, Vol. 6, No. 41
Validation of a multicolor staining to monitor
phosphoSTAT5 levels
in regulatory T-cell subsets
Grégory Ehx1,*, Muriel Hannon1,*, Yves Beguin1,2, Stéphanie Humblet-Baron1,3,**
and Frédéric Baron1,2,**
1 Hematology Research Unit, Groupe Interdisciplinaire de Génoprotéomique Appliquée (GIGA)-I³, University of Liège, Liège,
Belgium
2 Department of Medicine, Division of Hematology, CHU of Liège, Liège, Belgium 3 Autoimmune Genetics Laboratory, University of Leuven, Leuven, Belgium * These authors are co-first authors
** These authors are co-senior authors
Correspondence to: Grégory Ehx, email: g.ehx@ulg.ac.be
Keywords: Treg, regulatory T cells, FOXP3, STAT5, IL-2, Immunology and Microbiology Section, Immune response, Immunity Received: September 14, 2015 Accepted: November 26, 2015 Published: December 07, 2015
ABSTRACT
BACKGROUND: Regulatory T cells (Tregs) are key players in immune tolerance. They express the transcription factor FOXP3 and are dependent of the STAT5 signaling for their homeostasis. So far, the study of phosphorylated epitopes by flow cytometry required treating the cells with methanol, which is harmful for several epitopes.
METHODS: Here we assessed whether the PerFix EXPOSE reagent kit (PFE) (Beckman Coulter) allowed monitoring the phosphorylation level of STAT5 in Treg subpopulations together with complex immunophenotyping. Results observed with the PFE kit were compared to those observed without cell permeabilization for surface markers, with paraformaldehyde permeabilization for non-phosphorylated intracellular epitopes, and with methanol-based permeabilization for phosphoSTAT5 staining.
RESULTS: In human PBMCs, the PFE kit allowed the detection of surface antigens, FOXP3, KI67 and phosphoSTAT5 in similar proportions to what was observed without permeabilization (for surface antigens), or with PFA or methanol permeabilizations for FOXP3/KI67 and phosphoSTAT5, respectively. Comparable observations were made with murine splenocytes. Further, the PFE kit allowed determining the response of different human and murine Treg subsets to IL-2. It also allowed demonstrating that human Treg subsets with the highest levels of phosphoSTAT5 had also the highest suppressive activity in vitro, and that anti-thymocyte glogulin (ATG) induced Treg independently of the STAT5 pathway, both in vitro and in vivo.
CONCLUSIONS: We have validated a multicolor staining method that allows monitoring phosphoSTAT5 levels in Treg subsets. This staining could be useful to monitor responses of various Treg subsets to IL-2 therapy.
INTRODUCTION
Regulatory T cells (Tregs) represent a fraction of
CD4+ T cells that are indispensable for maintaining
immunological self tolerance [1, 2]. They express the forkhead box protein 3 factor (FOXP3) in their nuclei, and CD25 (the high-affinity component of the trimeric form of the interleukin 2 (IL-2) receptor) on their cell surface [3,
4]. Tregs are also featured by a low expression of CD127, the α chain of the IL-7 receptor [5].
The main population of Tregs is generated in the thymus, where high-avidity recognition of self-antigens by their T-cell receptor (TCR) leads to the generation of thymus Tregs [6, 7]. However, Tregs can also be generated in the periphery (peripheral Tregs) from conversion from
conventional CD4+ T cells (T
www.impactjournals.com/oncotarget
naive Tconvs by TCR stimulation along with TGF-β, IL-10 or retinoic acid signaling (induced Tregs) [6]. In addition to distinctions based on their origin, Treg can be further subdivided into central or naive Tregs (that are CD45RA+CCR7+ in humans and CD62LhiCCR7+ in
mice), and effector Tregs (that are CD45RAneg in humans,
and CD62LlowCCR7lowCD44high and CD103+ in mice) [4,
7-9]. Importantly, in humans, effector Tregs can be further separated between activated (HLA-DR+) effector T
regs that
are highly proliferating, and HLA-DRneg effector T regs that
are less proliferating [9].
In the last decade, animal studies have evidenced that restoring the T-cell balance in favor of Tregs allowed the control of autoimmunity in several animal models of rheumatologic diseases [10]. Further, Treg administration prevented graft-versus-host disease (GVHD, a redoubtable complication of allogeneic hematopoietic cell transplantation caused by donor immune cells contained in the graft reacting against recipient healthy tissues [11]) both in mouse to mouse and in humanized mouse models of GVHD [12-15]. Further, Treg infusion also prolonged human skin graft survival in humanized mice [16].
These observations in animal models prompted the initiation of pilot clinical studies of Treg infusion as prevention or treatment of GVHD [17-19], or as prevention of solid organ rejection [20].
IL-2 is a member of the common cytokine gamma chain family that plays a central role in Treg homeostasis through stimulation of the STAT5 pathway [4, 21]. This prompted Koreth et al. to investigate the safety and efficacy of low-dose IL-2 administration (with the aim of boosting Tregs) in patients with chronic GVHD [22]. The authors observed that administration of low-dose IL-2 not only successfully increased Treg blood counts but also induced clinical responses in half of the patients. Administration of low-dose IL-2 resulted also in increased Treg counts and clinical responses in patients with autoimmune diseases such as hepatitis C virus-induced vasculitis [23] or type 1 diabetes [24]. With the development of such cytokine-based immunotherapies, monitoring of the phosphorylation level of key players in target signaling pathways (and particularly of STAT5), simultaneously in several cell sub-populations, is of great interest in order to assess treatment efficacy early.
So far, the study of phosphorylated epitopes by flow cytometry required treating the cells with methanol, which is harmful for many extra- and intra-cellular epitopes and compromises multiparameter analyses. Recently, a new reagent kit, the PerFix EXPOSE kit (Beckman Coulter), was designed to allow studying phosphorylated epitopes without compromising other epitopes. In the present report, we compared this new procedure with reference permeabilization protocols for (non)-phosphorylated epitopes to validate it and used it to study Treg subsets response to IL-2 in human and mouse samples. Our results showed that the PerFix technique is suitable for combined
phosphoSTAT5 monitoring and accurate immunophenotyping
in human and mouse samples. We also highlighted differential responses to IL-2 among Treg subsets.
RESULTS AND DISCUSSION
Validation of a multicolor staining to monitor
phosphoSTAT5 levels in human Treg subsets
To assess the capacity of the PFE kit to allow the accurate quantification of phosphoSTAT5 in combination with surface (CD4, CD25, CD127, HLA-DR and CD45RA) and non-phosphorylated intracellular (FOXP3, KI67) epitopes, we compared this procedure with the conventional permeabilization method for phospho-epitopes (Methanol (MeOH)-based method) and the conventional permeabilization procedure for FOXP3 and KI67 staining (Paraformaldehyde (PFA) -based method). In order to assess the impact of any permeabilization treatment on the expression of surface epitopes, cells were also analyzed after staining of surface epitopes without any further permeabilization. These comparisons were repeated twice with 8 healthy volunteers and similar results were found in each experiment. Results from the first experiment are presented hereafter as representative example. The following combination of antibodies was used: CD4-PE-Cy5, CD25-BV421, CD127-biotine-strepatavidine-PE-Cy7, CD45RA-BV510, HLA-DR-APC-efluor780, FOXP3-AlexaFluor488, KI67-PE and
phosphoSTAT5-AlexaFluor647 (detailed in materials and
methods).
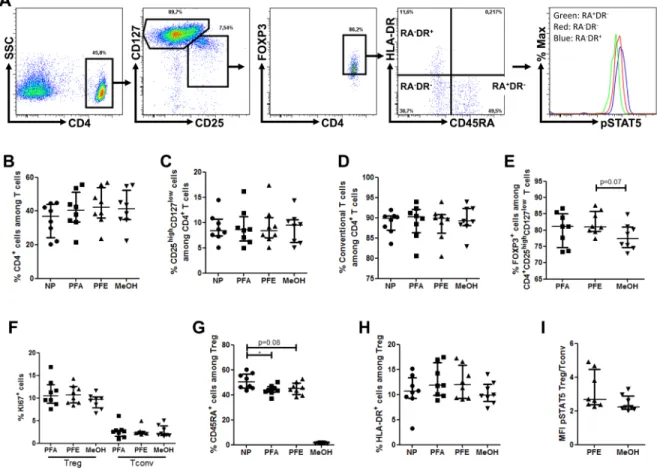
Using the gating strategy described in Figure 1A, we observed similar frequencies of CD4+, CD25highCD127low
and CD25low/intCD127high cells among non-permeabilized
cells, and cells permeabilized with either the PFE, PFA or MeOH methods (Figure 1B-1D).
Next we compared FOXP3+ frequency within the
CD25highCD127low population and observed comparable
FOXP3+ frequency among cells permeabilized with the
PFA or with the PFE method, highlighting the successful and accurate staining of FOXP3 with this later procedure (Figure 1E). In contrast, there was a trend for decreased FOXP3+ frequency within the CD4+CD25highCD127low
population in cells permeabilized with the MeOH procedure. Regarding KI67 staining, no significant difference of frequency within either Treg or Tconv populations was found between the three permeabilization protocols (Figure 1F).
Importantly, similar proportions of naive and activated effector Tregs were observed with the PFA and PFE procedures (Figure 1G-1H). In contrast, the methanol permeabilization procedure strikingly decreased the frequency of naive Tregs, highlighting the deleterious impact of this permeabilization technique on certain
surface epitopes such as CD45RA, although we can not exclude that by trying several CD45RA epitopes satisfying results could have been be achieved also with the methanol technique.
Next, we compared STAT5 phosphorylation levels (evaluated as mean fluorescence intensity (MFI) of
phosphoSTAT5-APC) in Tregs, normalized on TconvphosphoSTAT5
levels to reduce inter-assay variability of MFI between PFE and methanol permeabilization methods, after stimulation with 10 IU/ml of IL-2. Importantly, no difference between the two methods was observed (Figure 1I), demonstrating the reliability of the PFE technique for
phosphoSTAT5 analysis. This experiment further evidenced
higher levels of phosphoSTAT5 in Tregs than in Tconvs following stimulation with low-dose IL-2, as recently observed by another group of investigators [24].
Finally, we assessed the variability for each
donor between the PFE and reference technique (PFA or MeOH). Using simple linear regressions, we found a strong positive correlation (Spearman r ≥ 0.88, p ≤ 0.0072) between the results of the PFE and reference method for CD4+, CD25highCD127low, CD25low/intCD127high (T
conv),
CD45RA+ T
reg, HLA-DR+ Treg and Treg/TconvphosphoSTAT5
ratio (Supplemental Figure 1). In contrast, there was no correlation for FOXP3+ and KI67+ cells frequency within
CD25highCD127low and T
regs, respectively, likely because
of the low inter-donor variability of these parameters. However, importantly, there was a significant correlation for the frequency of CD25highCD127lowFOXP3+ cells (T
regs)
among total lymphocytes (r = 0.83, p = 0.0184) or CD4+ T
cells (r = 0.97, p = 0.0004), as well as for the frequencies of the different Treg subpopulations among CD4+ T cells
(naive Treg: r = 0.88, p = 0.0072; effector Treg: r = 0.97, p = 0.0004; and activated effector Treg: r = 0.76, p =
Figure 1: PerFix EXPOSE allows accurate detection of phosphoSTAT5 together with surface and intracellular immunophenotyping. PBMC from 8 healthy volunteers were surface stained with anti-CD4, -CD25, -CD127, -CD45RA and -HLA-DR antibodies and were either non permeabilized (NP) or stained with anti-FOXP3, -KI67 and -phosphoSTAT5 antibodies after permeabilization with either paraformaldehyde (PFA)-based technique, PerFix EXPOSE (PFE) or methanol (MeOH)-based technique. Data show median values of 8 biological replicates / condition with interquartile range (* p < 0.05, **p < 0.005, ***p < 0.0005). A. Gating strategy of tubes permeabilized with the PerFix method. B.-H. Comparison of cell frequencies between the different permeabilization methods: CD4+ T-cell frequency among the total lymphocyte population B., CD25highCD127low among CD4+ T cells C., T
conv (CD25low/intCD127high) among CD4+ T cells D., FOXP3+ among CD25highCD127low cells E., KI67+ cell frequency among either T
reg or Tconv populations F., CD45RA+ among CD4+CD25highCD127lowFOXP3+ T
reg G. and HLA-DR+ among CD4+CD25highCD127lowFOXP3+ Tregs H. I. Comparison of ratio, for each sample, of phosphoSTAT5 MFI of Tregs versus phosphoSTAT5 MFI of Tconvs in PerFix and methanol-based methods.
www.impactjournals.com/oncotarget
0.0368).
Altogether these data validate an 8-color staining method allowing measurement of phosphoSTAT5 levels in human Treg subsets.
In human PBMCs, activated effector Tregs have higher phosphoSTAT5 levels than other Treg subsets after stimulation with IL-2
Despite the growing knowledge on human Tregs,
little is known about the homeostatic properties of their sub-populations. Therefore, we took advantage of the PFE kit to study the respective capacities of the different Treg
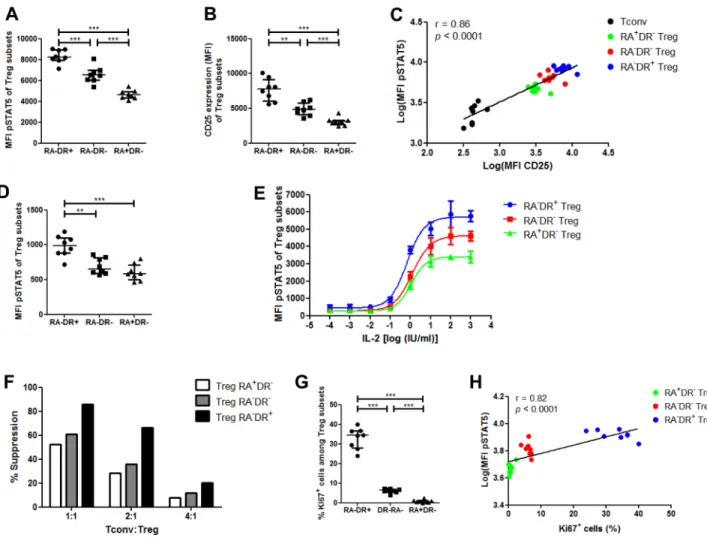
subsets at phosphorylating STAT5 in response to IL-2. First we performed this comparison with low-dose (10 IU/ml) IL-2. The highest phosphoSTAT5 levels were found in activated effector Tregs, followed by HLA-DRneg
effector Tregs, while naive Tregs had the lowest levels of
phosphoSTAT5 (Figure 2A). We then examined whether phosphoSTAT5 levels correlated with CD25 expression by
Tregs. We first observed that, as seen with phosphoSTAT5 levels, activated effector Tregs had the highest expression of CD25, followed by HLA-DRneg effector T
reg and naive
Treg (Figure 2B). These data are in concordance with those reported by Miyara et al. showing higher CD25 expression in activated effector Tregs than in naive Tregs [8]. Further,
Figure 2: Phospho-STAT5 comparison between human Treg subsets. A.-C., G.-H. PBMC from 8 healthy volunteers were
stimulated with 10 IU/ml of recombinant human IL-2, stained with anti-CD4, -CD25, -CD127, -CD45RA and -HLA-DR antibodies, permeabilized with the PerFix EXPOSE method and stained with anti-FoxP3, -KI67 and -phosphoSTAT5 antibodies. A. Comparison of STAT5 phosphorylation level (MFI) between the different Treg subsets with IL-2 stimulation, based on their expression of CD45RA and HLA-DR. B. CD25 expression (MFI) of the different Treg subsets. C. Correlation between STAT5 phosphorylation level (log of MFI) and CD25 expression (log of MFI) in Tconvs and the different Treg subsets. D. Comparison of phosphoSTAT5 MFI between the different Treg subsets without IL-2 stimulation. E. Total T cells were isolated from 3 healthy volunteers, stimulated with various concentrations of IL-2 for 15 min and phosphoSTAT5 level was measured in the different Treg subsets after PerFix EXPOSE permeabilization. Data show mean values with standard deviation. F. Comparison of in vitro suppressive activity between the different human Treg subsets at different Treg:Tconv ratios. Data show mean value of triplicates. G. Comparison of KI67+ cell frequency among the different T
reg subsets. H. Correlation between STAT5 phosphorylation level after stimulation with 10 IU/ml of IL-2 (log of MFI) and KI67+ cell frequency in the different T
reg subsets. Data show median values with interquartile range (* p < 0.05, **p < 0.005, ***p < 0.0005).
taking data from Tconv and Treg subsets together, there was a strong correlation between phosphoSTAT5 and CD25 levels (Spearman r = 0.86, p < 0.0001, Figure 2C). These findings demonstrate that the different Treg subsets are not homogeneous in terms of response to IL-2 stimulation.
In order to verify that these observations remained present in basal conditions, we performed the same analyses with unstimulated Tregs and observed significantly higher phosphoSTAT5 levels in activated effector Tregs than in the two other Treg subpopulations, while no differences were detected between HLA-DRneg effector T
regs and naive
Tregs (Figure 2D).
To further evaluate the response of the various Treg subsets to IL-2, we compared phosphoSTAT5 levels in the three Treg subsets after stimulation with an 8-log range of IL-2 concentration (Figure 2E and Supplemental Figure 2). As observed above, activated effector Tregs had
the highest phosphoSTAT5 levels, followed by HLA-DRneg
effector Tregs and naive Tregs. Specifically, the log half maximal effective concentration (log(EC50)) of activated effector Tregs (-0.165) was lower than the log(EC50) of HLA-DRneg effector T
regs (0.096, p = 0.0495) and naive
Tregs (0.039, p = 0.0768) subsets, supporting a higher proliferative capacity of this Treg subset over the two others. These results are consistent with the differences observed in unstimualted Tregs and further demonstrate the heterogeneity of Treg subsets in terms of response to IL-2 stimulation. In addition, our observations are in line with a recent study reporting that high-dose IL-2 therapy in melanoma patients promoted a Treg subset with an activated phenotype [25]. Interestingly, we observed that the activated effector Tregs had the highest suppressive activity in vitro, while the two other populations presented similar (lower) suppressive activities (Figure 2F). These
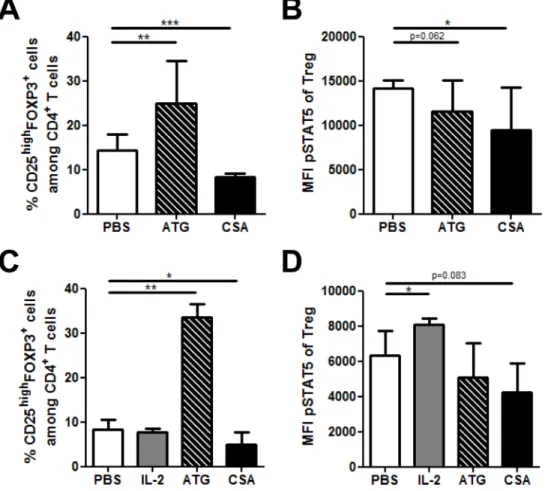
Figure 3: Impact of Anti-thymocyte globulin (ATG) and cyclosporin A (CSA) on Treg phosphoSTAT5 levels in vivo and in vitro. A.-B. Human PBMCs, freshly isolated from 3 healthy donors were cultured in triplicate in the presence of either PBS, CSA (500 ng/
ml) or ATG (100 µg/ml) for 24 hours. The impact of these compounds on CD4+CD25highFOXP3+ cell frequency A. as well as on
phosphoSTAT5 levels in Tregs B. was assessed by flow cytometry using the PFE technique for permeabilization. Data show median values of 9 replicates (3 biological replicates in triplicates / condition) with interquartile range (* p < 0.05, **p < 0.005, ***p < 0.0005). (C-D) NSG mice received 2.5 Gy total body irradiation and were injected with 5x10⁶ human PBMC i.v. 24h later (day 0). They were injected with either PBS (daily from day 4 to 6), 15 mg/kg of cyclosporin A (CSA, daily from day 4 to 6), 10 mg/kg of ATG (day 6) or 50.000 IU of IL-2 (24h, 12h and 1h before sacrifice). At day 7, animals were sacrificed and spleens were collected for flow cytometry comparison of CD4+CD25highFOXP3+ cells frequency A. and phosphoSTAT5 level in Tregs B. between the different treatments (PFE technique was used for permeabilization). Data show median values of 8 biological replicates with interquartile range (* p < 0.05, **p < 0.005, ***p < 0.0005).
www.impactjournals.com/oncotarget
results suggest that phosphoSTAT5 level of Treg subsets might be predictive of their suppressive function.
Finally, we compared KI67 expression between Treg subsets and found the highest frequency of KI67+ cells
within the activated effector Treg fraction, while the HLA-DRneg effector T
regs had a higher KI67 expression than naive
Tregs (Figure 2G), in agreement with previous findings [9]. Given the pivotal function of STAT5 phosphorylation in Treg proliferation, a significant correlation was found between KI67 expression of Treg subsets and their level of
phosphoSTAT5 after low-dose IL-2 stimulation (Spearman r
= 0.82, p < 0.0001, Figure 2H).
Because cryopreserved rather than fresh PBMCs are frequently used in clinical trials, we assessed phosphoSTAT5 levels in Treg subsets recovered from human cryopreserved PBMCs. As observed with freshly isolated PBMCs,
activated effector Tregs from cryopreserved PBMCs
presented the highest levels of phosphoSTAT5, CD25 and KI67 in comparison with the two other subsets, while effector Tregs had significantly higher levels of these markers than naive Tregs (Supplemental Figure 3). These data indicate that the PFE technique is reliable also for thawed PBMC samples.
Altogether these data suggest that the different proliferative capacities of Treg subsets may be dependent upon their divergent capacities to respond to IL-2 through the STAT5 pathway.
Impact of anti-thymocyte globulin (ATG) and cyclosporin A on Treg phosphoSTAT5 levels
Immunosuppressive drugs, such as anti-thymocyte globulin (ATG) and cyclosporin A (CSA) are widely used to prevent or treat pathologies where Tconvs and
Tregs play a critical role such as GVHD [26]. To gain
further insight on the impact of these drugs on Tregs, we
assessed their impact on phosphoSTAT5 levels using the
PFE technique. We first assessed this impact in vitro and observed that ATG dramatically increased the frequency of CD4+CD25highFOXP3+ T
regs (as observed previously
by other investigators [27, 28]), while Treg frequency was
reduced by CSA (Figure 3A). Interestingly, both ATG and CSA significantly reduced phosphoSTAT5 levels in Tregs
(Figure 3B). This suggests that Treg expansion by ATG is
independent of STAT5 signaling and is rather the result of the conversion of Tconvs into Tregs, as previously showed
by other investigators [27]. In addition, the lowered levels of phosphoSTAT5 by CSA are probably the results of its
inhibitory effect on IL-2 production.
We next investigated the impact of these compounds in vivo in NSG mice transplanted with human PBMCs. We observed that, in agreement with in vitro experiments, ATG dramatically increased Treg frequency, while the
opposite was observed with CSA (Figure 3C). Further, while IL-2 significantly increased phosphoSTAT5 levels
in Tregs, the opposite was observed with ATG and CSA (Figure 3D).
Validation of a multicolor staining to monitor
phosphoSTAT5 levels in mouse Treg
We next assessed the capacity of the PFE kit to allow the accurate quantification of phosphoSTAT5 levels
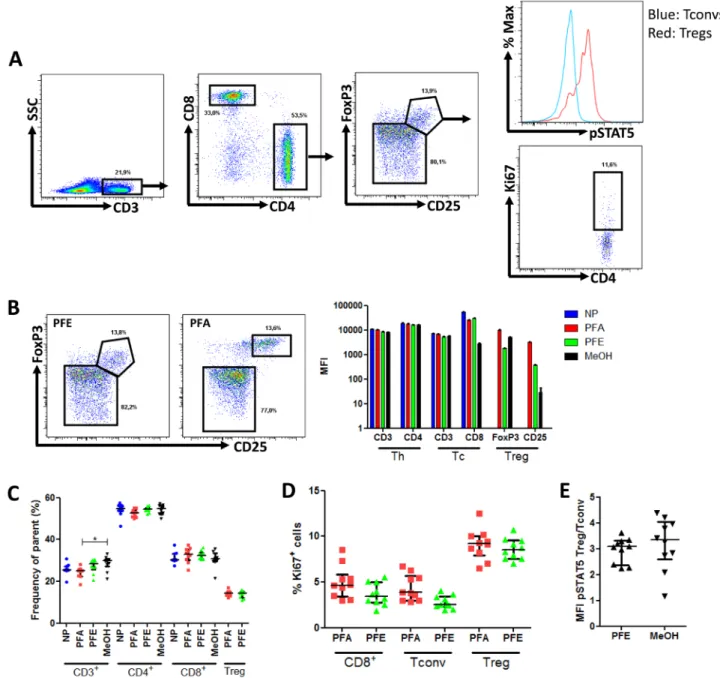
in combination with surface (CD3, CD4, CD8, CD25) and non-phosphorylated intracellular (FOXP3 and Ki67) epitopes in murine splenocytes from 5 B10.D2 and 5 B10.BR mice (Figure 4A). The following combination of antibodies was used: CD3-V500, CD4-eFluor450, CD8-PE-Cy7, CD25-PerCP-Cy5.5, FoxP3-PE, Ki67-FITC and phosphoSTAT5-AlexaFluor647 (detailed in material and
methods).
In slight contrast to what was observed with human PBMCs, the PFE kit slightly reduced the expression (MFI) of both CD25 and FoxP3 by Tregs, while no impact
was observed on CD3, CD4 and CD8 staining (Figure 4B). However, importantly, the frequencies of CD3+,
CD3+CD4+, CD3+CD8+, and CD3+CD4+CD25+FoxP3+
lymphocytes were similar between PFE and either not permeabilized or PFA samples (Figure 4C). Further, the percentage of cells expressing the proliferation marker Ki67 was also comparable with the PFA and PFE kits (Figure 4D). In contrast, methanol-based permeabilization resulted in an almost complete loss of CD25 staining hampering proper gating of CD3+CD4+CD25+FoxP3+
cells.
Next, we compared the Treg/Tconv ratio of phosphoSTAT5
levels between PFE and methanol-based permeabilization and found no significant differences (Figure 4E).
Finally, we investigated whether the alteration of CD25 and FoxP3 staining with PFE could be reproduced with different antibodies than CD25-PerCP-Cy5.5 and FoxP3-PE that were used here above. As shown in Supplemental Figure 4, CD25-PE showed satisfactory staining in comparison to the PFA condition while FoxP3-APC staining was completely lost. These results demonstrate that, for optimal results, the deleterious impact of PFE on specific antibodies should be evaluated before performing any analysis.
Altogether these data validate a 7-color staining
method allowing measurement of phosphoSTAT5 levels
together with Ki67 expression in mouse T-cell samples.
In mouse splenocytes, naive Tregs have higher
phosphoSTAT5 levels than effector Tregs after
stimulation with IL-2
Because IL-2 and phosphoSTAT5 play a major
role in mouse Treg homeostasis [29], we compared the
phosphoSTAT5 response curve of naive and effector mouse
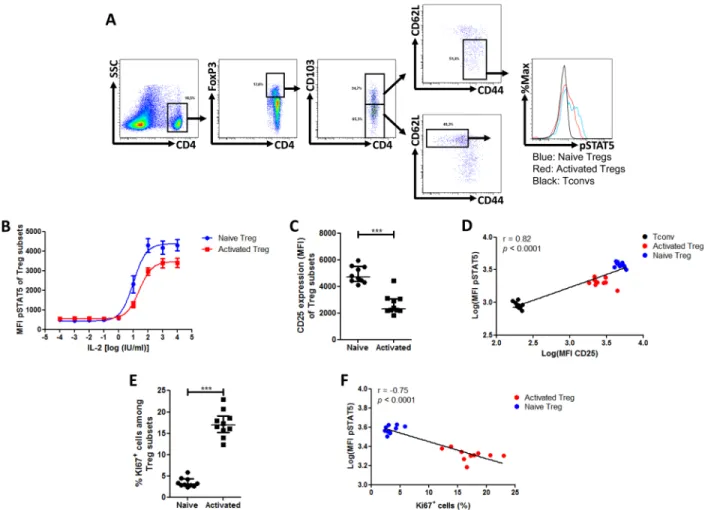
using the following antibodies: CD4-eFluor450, CD25-PE-Cy7, CD62L-APC-eFluor780, CD44-FITC, CD103-BV510, FoxP3-PE, Ki67-PerCP-Cy5.5 and phospho STAT5-AlexaFluor647 (detailed in material and methods). In contrast to what was observed in human Tregs, murine naive Tregs responded to lower concentrations of IL-2 than effector Treg (Figure 5B). This is illustrated by the
significant difference of log(EC50) between the two subsets (naive Tregs: 1.022 +/- 0.105 vs effector Tregs: 1.416 +/- 0.088 (p = 0.0078)). This is consistent with a previous report showing that IL-2 injections in mice stimulated to a higher extent the proliferation of CD44lowCD62LhighCCR7+
than CD44highCD62LlowCCR7- T
regs [30, 31]. Further, we
investigated the respective expression of CD25 in both
Figure 4: Phospho-STAT5 analyzes in murine samples. Splenocytes from 10 mice were surface stained with anti-CD3, -CD4, -CD8 and -CD25 antibodies and were either non permeabilized (NP) or stained with anti-FoxP3, -Ki67 and -phosphoSTAT5 antibodies after permeabilization with either paraformaldehyde (PFA)-based technique, PerFix EXPOSE (PFE) or methanol (MeOH)-based technique. Data show median values of 10 biological replicates / condition with interquartile range (* p < 0.05, **p < 0.005, ***p < 0.0005). A. Gating strategy of tubes permeabilized with the PFE technique. B. Impact of PerFix permeabilization on CD25 and FoxP3 staining (left panel) and on staining of markers of helper (Th), cytotoxic (Tc) and regulatory (Treg) T cells (right panel) C. Comparison of cell frequencies between the different permeabilization techniques: CD3+ T cells among total splenocytes, CD4+ helper and CD8+ cytotoxic cells among CD3+ T cells and CD25highFoxP3+ among CD4+ T cell. D. Comparison of Ki67+ cell frequency within CD8+ T cells, T
convs and Tregs between the PFA-based and PFE techniques. E. Comparison of ratio, for each sample, of phosphoSTAT5 MFI of Tregs versus phosphoSTAT5 MFI of Tconvs in PerFix and methanol-based methods.
www.impactjournals.com/oncotarget
subsets and found that naive Tregs expressed higher levels of CD25 than effector Tregs, in agreement with their response curves to IL-2 (Figure 5C) and with recently reported data [31]. As observed in human samples and taking data from Tconv and Treg subsets together, there was a strong correlation between phosphoSTAT5 and CD25 levels (Spearman r = 0.82, p < 0.0001, Figure 5D). However we found that activated Tregs expressed dramatically higher levels of Ki67 than naive Treg (Figure 5E) and an inverse correlation between phosphoSTAT5 level and Ki67 was observed when taking data from Treg subsets together (Spearman r = -0.75, p < 0.0001, Figure 5F). Because the time of exposure to IL-2 in our experiments (15 min) is insufficient to induce Ki67 expression through the
phosphoSTAT5 pathway (similar frequencies of Ki67 were
found between stimulated and unstimulated Tregs, data not showed), these data suggest that Treg proliferation is
conditioned by their activation status while their capacity to respond to IL-2 is conditioned by their expression of CD25.
In summary, we have validated a multicolor staining method that allows the measurement of STAT5 phosphorylation levels in human and murine Treg subsets. Further, comparison of phosphoSTAT5 levels in response to IL-2 between the different Treg subsets highlighted a striking divergence between the two species. These observations are in line with recent reports showing higher CD25 expression in activated effector Tregs than in naive Tregs in human PMBCs [8], but higher CD25 expression in naive Tregs than in effector Tregs in mouse splenocytes [31]. Further, as IL-2 administration has been previously shown to increase naive Treg frequency in mouse [31] and activated ICOS+ T
reg in humans [25], our work suggest that
ex vivo response curves to cytokines might be predictive
Figure 5: Phospho-STAT5 comparison between murine Treg subsets. Mouse splenocytes were isolated from 10 animals, stimulated with 10 IU/ml IL-2, stained with anti-CD4, -CD25, -CD103, -CD62L, -CD44 surface antibodies, permeabilized with the PerFix EXPOSE method and stained with anti-FoxP3, -Ki67 and -phosphoSTAT5 antibodies. Data show median values of 10 biological replicates / condition with interquartile range (* p < 0.05, **p < 0.005, ***p < 0.0005). A. Gating strategy used to compare the naive (CD4+FoxP3+CD44lowC D62LhighCD103-)and activated (CD4+FoxP3+CD44highCD62LlowCD103+) T
reg subsets. B. Splenocytes were isolated from 3 B10.D2 mice, stimulated with various concentrations of IL-2 for 15 min and phosphoSTAT5 level was measured in Treg subsets after PFE permeabilization.
C. Comparison of CD25 expression (MFI) between the different Treg subsets. D. Correlation between STAT5 phosphorylation level (log of MFI) and CD25 expression (log of MFI) in Tconvs and the different Treg subsets after stimulation with 10 IU/ml of IL-2. E. Comparison of Ki67+ cell frequency among the different T
reg subsets. F. Correlation between STAT5 phosphorylation level (log of MFI) and Ki67+ cell frequency in the different Treg subsets after stimulation with 10 IU/ml of IL-2.
of the impact of specific cytokine administration on the homeostasis Tregs and other T-cell population.
MATERIALS AND METHODS
Volunteers
Blood from healthy adult volunteers (aged 21 to 37 years) was collected following written informed consent (approved by our local Ethic Committee). Peripheral blood mononuclear cells (PBMCs) were immediately isolated by density gradient centrifugation (Ficoll-PaqueTM, GE
Healthcare, Upsala, Sweden) and then resuspended in staining buffer PBS+3%FBS (Lonza, Verviers, Belgium) at a concentration of 1x10⁶/ml.
Animal experiments
For the study assessing the impact of immunosuppressive drugs on human cells in vivo, NOD-scid IL-2Rγnull (NSG) (The Jackson laboratory, Bar Harbor,
ME) mice, aged from 8 to 9 weeks, were irradiated (2.5 Gy total body irradiation) and transplanted i.v. 24h later
with 5x10⁶ human PBMCs (freshly isolated from one
healthy volunteer). Animal weight and survival were monitored daily, in agreement with the recommendation of our ethical committee. Mice were then injected intraperitoneally with either PBS daily on days 4, 5 and 6 post-transplantation, 15 mg/kg of cyclosporin A (CSA, Sandimmune, Novartis, Basel, Switzerland) daily on days 4, 5 and 6 post-transplantation, 10 mg/kg of ATG (ATG-Fresenius, Neovii Biotech GmbH, Gräfelfing, Germany) on day 6 post-transplantation, or 50.000 IU of IL-2 (Proleukin, Novartis), 25h, 15h and 1h before the sacrifice at day 7.
For murine Treg and phosphoSTAT5 analyses, mice of either the B10.BR or B10.D2 strains (aged from 8-10 weeks) were sacrificed according to the local ethics policies without receiving any particular treatment. Spleens of either NSG, B10.BR or B10.D2 mice were collected in RPMI supplemented with 5% FBS and were prepared to a single cell suspension. Cells were washed twice in staining buffer, filtered through a 75 µm nylon mesh to remove aggregates, and were resuspended at a concentration of 1x10⁶ cells/ml in staining buffer. Cell culture and suppression assays
For in vitro drugs assays, freshly isolated human PBMCs from 3 healthy volunteers were activated in triplicate in the presence of anti-CD3/CD28 beads (Bead-Cell ratio 1:1, Invitrogen, Waltham, MA) in complete medium that consisted of RPMI 1640 L-glutamine
(2mM) (Lonza) supplemented with penicillin (100 IU/ ml) (Lonza), streptomycin (10 mg/ml) (Lonza) and 10% human AB serum (Sigma-Aldrich, St. Louis, MO). Culture medium was supplemented with either PBS, 500 ng/ml of CSA, or 100 µg/ml of ATG Fresenius/Neovii. Cells were collected for flow cytometry analysis after 24h of incubation at 37°C, 5% CO2.
For suppression assays, Treg subsets were isolated from human PBMCs by flow cytometry (FACS Aria III, Becton Dickinson (BD), Bedford, MA). Sorted naive Tconvs were loaded with CFSE 5 µM (Invitrogen) and used as responder cells. Assays were performed in complete medium in the presence of anti-CD3/CD28 beads (Bead-Cell ratio 1:8, Invitrogen). Sorted Tregs and responder cells were cultured in mixed lymphocyte reactions at different Treg:Tresp ratios for 72h before analysis by flow cytometry.
IL-2 stimulation
Human PBMCs or murine splenocytes (1x10⁶
cells/ml in staining buffer) were stimulated with human recombinant IL-2 (Peprotech EC ltd., London, UK) because recombinant human IL-2 has been proven to be also efficient in mouse [32, 33]. For all experiments other than dose-response curves, a concentration of 10 IU/ml was used, while for dose-response curve experiments, an 8-log range of concentrations was used for human and a 9-log range was used for murine experiments. Samples were stimulated for 15 min at 37°C and were immediately washed twice with staining buffer before processing for flow cytometry staining. This time of exposure was chosen based on phosphoSTAT5 levels observed in lymphocytes
after different times of stimulation with 10 IU/ml (Supplemental Figure 5), 15 min corresponding to a time point of maximal response.
Flow cytometry
The following antibodies specific for human epitopes were used: CD4-PE-Cy5 (RPA-T4), CD25-BV421 (M-A251, BD), CD127-biotin (eBioRDR5), CD45RA-BV510 (HI100, BD), HLA-DR-APC-efluor780 (LN3), FOXP3-AlexaFluor488 (259D, Biolegend, ImTech Antwerp, Belgium), posphoSTAT5-AlexaFluor647 (p7694, BD), Ki67-FITC (B56, BD), KI67-PerCP-Cy5.5 (B56, BD), KI67-PE (B56, BD) and anti-streptavidin-PE-Cy7. The following antibodies specific for mouse epitopes were used: CD3-V500 (500A2, BD), CD4-eFluor450 (RM4-5), CD8-PE-Cy7 (53-6.7), CD25-PerCP-Cy5.5 (PC61.5), CD25-PE-Cy7 (PC61, BD), CD25-PE (PC61.5), CD103-BV510 (M290, BD), CD44-FITC (IM7), CD62L-APC-eFluor780 (MEL-14), FoxP3-APC (FJK-16s), and FoxP3-PE (FJK-16s) (all from eBioscience, unless indicated otherwise). Cells (1x10⁶
www.impactjournals.com/oncotarget
20 min at 4°C in the dark and washed with staining buffer. This process was repeated for a 15-minute period for the streptavidin staining step. Then, samples were either not permeabilized and kept in PBS at 4°C until analysis by flow cytometry (Non Permeabilized (NP) condition) or were permeabilized by the use of one of three different procedures: the paraformaldehyde (PFA)-based method with FOXP3 Staining Buffer Set (eBioscience); the methanol (MeOH)-based method with Lyse/Fix buffer (Becton Dickinson) followed by Phosflow Perm Buffer III (Becton Dickinson) (Methanol-based method) or the PerFix EXPOSE (PFE, Beckman Coulter, Brea, CA) method. Manufacturer instructions were followed for each procedure. Data were acquired on a FACS Canto II (Becton Dickinson) and were analyzed with FlowJo v7.6.5 (Treestar Inc., San Carlos, CA).
Gating strategy and definition of Treg subsets
In human samples, Tregs were defined as
CD4+CD25+CD127dimFOXP3+ lymphocytes. Naive T regs
were defined as CD45RA+HLA-DRneg T
regs, activated
effector Tregs were defined as CD45RAnegHLA-DR+
Tregs, while HLA-DRneg effector Tregs were defined as
CD45RAnegHLA-DRneg T
regs as recently proposed by
Dong et al. [9]. In murine samples, Tregs were defined as
CD4+CD25+FoxP3+ lymphocytes. Naive T
regs were defined
as CD4+FoxP3+CD44lowCD62LhighCD103- lymphocytes
while effector Tregs were defined as CD4+FoxP3+CD44hig hCD62LlowCD103+ lymphocytes [4].
Statistical analyses
The Mann-Whitney U test was used to compare flow cytometry data from different treatments. The extra sum-of-squares F test was used to compare the half maximal effective concentrations (EC50). The Spearman test was
used to assess correlations. Statistical analyses were carried out with Graphpad Prism 5.0 (Graphpad Software, San Diego, CA). P values < 0.05 were considered as statistically significant.
ACKNOWLEDGMENTS
We are very grateful to Sandra Ormenese from the Imaging and Flow Cytometry Platform of the GIGA for help with flow cytometers.
GRANT SUPPORT
This study was supported by funds from: the National Fund for Scientific Research (FNRS), the Leon Fredericq fund and Anti-Cancer Center at the University of Liège, and the Belgian Federation Against Cancer. GE is Télévie Research Assistant, and FB is senior
research associate of the National Fund for Scientific Research (FNRS) Belgium. SHB is funded by the Fonds Wetenschappelijk Onderzoek (FWO).
CONFLICTS OF INTEREST
The authors declare no conflicts of interest.
Authors’ contributions
Study design: GE, FB, SHB; Data acquisition: GE, MH; Data interpretation: GE, MH, SHB; Ms writing GE, FB; Manuscript editing MH, YB, SHB; Approval of the last version of the manuscript: all authors.
REFERENCES
1. Sakaguchi S, Sakaguchi N, Asano M, Itoh M and Toda M. Immunologic self-tolerance maintained by activated T cells expressing IL-2 receptor alpha-chains (CD25). Breakdown of a single mechanism of self-tolerance causes various autoimmune diseases. Journal of Immunology. 1995; 155:1151-1164.
2. Tian L, Humblet-Baron S and Liston A. Immune tolerance: are regulatory T cell subsets needed to explain suppression of autoimmunity? Bioessays. 2012; 34:569-575.
3. Josefowicz SZ, Lu LF and Rudensky AY. Regulatory T cells: mechanisms of differentiation and function. Annu Rev Immunol. 2012; 30:531-564.
4. Liston A and Gray DH. Homeostatic control of regulatory T cell diversity. Nature reviews Immunology. 2014; 14:154-165.
5. Seddiki N, Santner-Nanan B, Martinson J, Zaunders J, Sasson S, Landay A, Solomon M, Selby W, Alexander SI, Nanan R, Kelleher A and Fazekas de St Groth B. Expression of interleukin (IL)-2 and IL-7 receptors discriminates between human regulatory and activated T cells. The Journal of experimental medicine. 2006; 203:1693-1700. 6. Abbas AK, Benoist C, Bluestone JA, Campbell DJ, Ghosh
S, Hori S, Jiang S, Kuchroo VK, Mathis D, Roncarolo MG, Rudensky A, Sakaguchi S, Shevach EM, et al. Regulatory T cells: recommendations to simplify the nomenclature. Nat Immunol. 2013; 14:307-308.
7. Gratz IK and Campbell DJ. Organ-specific and memory treg cells: specificity, development, function, and maintenance. Frontiers in immunology. 2014; 5:333.
8. Miyara M, Yoshioka Y, Kitoh A, Shima T, Wing K, Niwa A, Parizot C, Taflin C, Heike T, Valeyre D, Mathian A, Nakahata T, Yamaguchi T, Nomura T, Ono M, Amoura Z, et al. Functional delineation and differentiation dynamics of human CD4+ T cells expressing the FoxP3 transcription factor. Immunity. 2009; 30:899-911.
9. Dong S, Maiella S, Xhaard A, Pang Y, Wenandy L, Larghero J, Becavin C, Benecke A, Bianchi E, Socie G and
Rogge L. Multiparameter single-cell profiling of human CD4+FOXP3+ regulatory T-cell populations in homeostatic conditions and during graft-versus-host disease. Blood. 2013; 122:1802-1812.
10. Miyara M, Ito Y and Sakaguchi S. TREG-cell therapies for autoimmune rheumatic diseases. Nature reviews Rheumatology. 2014; 10:543-551.
11. Socie G and Ritz J. Current issues in chronic graft-versus -host disease. Blood. 2014; 124:374-84.
12. Edinger M, Hoffmann P, Ermann J, Drago K, Fathman CG, Strober S, Negrin RS. CD4+CD25+ regulatory T cells preserve versus-tumor activity while inhibiting graft-versus-host disease after bone marrow transplantation. Nat Med. 2003; 9:1144-50.
13. Cohen JL, Trenado A, Vasey D, Klatzmann D and Salomon BL. CD4(+)CD25(+) immunoregulatory T Cells: new therapeutics for graft-versus-host disease. Journal of Experimental Medicine. 2002; 196:401-406.
14. Hannon M, Lechanteur C, Lucas S, Somja J, Seidel L, Belle L, Bruck F, Baudoux E, Giet O, Chantillon AM, Delvenne P, Drion P, Beguin Y, et al. Infusion of clinical-grade enriched regulatory T cells delays experimental xenogeneic graft-versus-host disease. Transfusion. 2014; 54:353-363. 15. Hippen KL, Merkel SC, Schirm DK, Sieben CM, Sumstad
D, Kadidlo DM, McKenna DH, Bromberg JS, Levine BL, Riley JL, June CH, Scheinberg P, Douek DC, et al. Massive ex vivo expansion of human natural regulatory T cells (T(regs)) with minimal loss of in vivo functional activity. SciTranslMed. 2011; 3:83ra41.
16. Sagoo P, Ali N, Garg G, Nestle FO, Lechler RI and Lombardi G. Human regulatory T cells with alloantigen specificity are more potent inhibitors of alloimmune skin graft damage than polyclonal regulatory T cells. Science translational medicine. 2011; 3:83ra42.
17. Di Ianni M, Falzetti F, Carotti A, Terenzi A, Castellino F, Bonifacio E, Del Papa B, Zei T, Ostini RI, Cecchini D, Aloisi T, Perruccio K, Ruggeri L, Balucani C, Pierini A, Sportoletti P, et al. Tregs prevent GVHD and promote immune reconstitution in HLA-haploidentical transplantation. Blood. 2011; 117:3921-3928.
18. Brunstein CG, Miller JS, Cao Q, McKenna DH, Hippen KL, Curtsinger J, DeFor T, Levine BL, June CH, Rubinstein P, McGlave PB, Blazar BR and Wagner JE. Infusion of ex vivo expanded T regulatory cells in adults transplanted with umbilical cord blood: safety profile and detection kinetics. Blood. 2011; 117:1061-1070.
19. Theil A, Tuve S, Oelschlagel U, Maiwald A, Dohler D, Ossmann D, Zenkel A, Wilhelm C, Middeke JM, Shayegi N, Trautmann-Grill K, von Bonin M, Platzbecker U, et al. Adoptive transfer of allogeneic regulatory T cells into patients with chronic graft-versus-host disease. Cytotherapy. 2015; 17:473-86.
20. van der Net JB, Bushell A, Wood KJ and Harden PN. Regulatory T cells: first steps of clinical application in solid
organ transplantation. Transplant international : official journal of the European Society for Organ Transplantation. 2015 May 15. [Epub ahead of print] PMID:25981203. 21. Boyman O and Sprent J. The role of interleukin-2 during
homeostasis and activation of the immune system. Nature reviews Immunology. 2012; 12:180-190.
22. Koreth J, Matsuoka K, Kim HT, McDonough SM, Bindra B, Alyea EP, III, Armand P, Cutler C, Ho VT, Treister NS, Bienfang DC, Prasad S, Tzachanis D, Joyce RM, Avigan DE, Antin JH, et al. Interleukin-2 and regulatory T cells in graft-versus-host disease. New England Journal of Medicine. 2011; 365:2055-2066.
23. Saadoun D, Rosenzwajg M, Joly F, Six A, Carrat F, Thibault V, Sene D, Cacoub P and Klatzmann D. Regulatory T-cell responses to low-dose interleukin-2 in HCV-induced vasculitis. The New England journal of medicine. 2011; 365:2067-2077.
24. Rosenzwajg M, Churlaud G, Mallone R, Six A, Derian N, Chaara W, Lorenzon R, Long SA, Buckner JH, Afonso G, Pham HP, Hartemann A, Yu A, et al. Low-dose interleukin-2 fosters a dose-dependent regulatory T cell tuned milieu in T1D patients. J Autoimmun. 2015; 58:48-58.
25. Sim GC, Martin-Orozco N, Jin L, Yang Y, Wu S, Washington E, Sanders D, Lacey C, Wang Y, Vence L, Hwu P and Radvanyi L. IL-2 therapy promotes suppressive ICOS+ Treg expansion in melanoma patients. J Clin Invest. 2014; 124:99-110.
26. Baron F, Labopin M, Blaise D, Lopez-Corral L, Vigouroux S, Craddock C, Attal M, Jindra P, Goker H, Socie G, Chevallier P, Browne P, Sandstedt A, et al. Impact of in vivo T-cell depletion on outcome of AML patients in first CR given peripheral blood stem cells and reduced-intensity conditioning allo-SCT from a HLA-identical sibling donor: a report from the Acute Leukemia Working Party of the European Group for Blood and Marrow Transplantation. Bone marrow transplantation. 2014; 49:389-396.
27. Feng X, Kajigaya S, Solomou EE, Keyvanfar K, Xu X, Raghavachari N, Munson PJ, Herndon TM, Chen J and Young NS. Rabbit ATG but not horse ATG promotes expansion of functional CD4+CD25highFOXP3+ regulatory T cells in vitro. Blood. 2008; 111:3675-3683. 28. Shimony O, Nagler A, Gellman YN, Refaeli E, Rosenblum
N, Eshkar-Sebban L, Yerushalmi R, Shimoni A, Lytton SD, Stanevsky A, Or R and Naor D. Anti-T lymphocyte globulin (ATG) induces generation of regulatory T cells, at least part of them express activated CD44. J Clin Immunol. 2012; 32:173-188.
29. Pierson W, Cauwe B, Policheni A, Schlenner SM, Franckaert D, Berges J, Humblet-Baron S, Schonefeldt S, Herold MJ, Hildeman D, Strasser A, Bouillet P, Lu LF, Matthys P, Freitas AA, Luther RJ, et al. Antiapoptotic Mcl-1 is critical for the survival and niche-filling capacity of Foxp3(+) regulatory T cells. Nature Immunology. 2013; 14:959-965.
www.impactjournals.com/oncotarget
30. Smigiel KS, Srivastava S, Stolley JM and Campbell DJ. Regulatory T-cell homeostasis: steady-state maintenance and modulation during inflammation. Immunol Rev. 2014; 259:40-59.
31. Smigiel KS, Richards E, Srivastava S, Thomas KR, Dudda JC, Klonowski KD and Campbell DJ. CCR7 provides localized access to IL-2 and defines homeostatically distinct regulatory T cell subsets. The Journal of experimental medicine. 2014; 211:121-136.
32. Rosenberg SA, Lotze MT, Muul LM, Leitman S, Chang AE, Ettinghausen SE, Matory YL, Skibber JM, Shiloni E, Vetto JT, Scipp CA, Simpson C and Reichert CM. Observation on the systemic administration of autologous lymphokine-activated killer cells and recombinant interleukin-2 to patients with metastatic cancer. New England Journal of Medicine. 1985; 313:1485-1492.
33. Tang Q, Adams JY, Penaranda C, Melli K, Piaggio E, Sgouroudis E, Piccirillo CA, Salomon BL and Bluestone JA. Central role of defective interleukin-2 production in the triggering of islet autoimmune destruction. Immunity. 2008; 28:687-697.