Comparative phylogeography of four Apodemus
species (Mammalia: Rodentia) in the Asian Far East:
evidence of Quaternary climatic changes in their
genetic structure
HÉLA SAKKA
1–3, JEAN PIERRE QUÉRÉ
4, IRINA KARTAVTSEVA
5,
MARINA PAVLENKO
5, GALINA CHELOMINA
5, DMITRY ATOPKIN
5,
ALEKSEY BOGDANOV
6and JOHAN MICHAUX
3,4*
1Laboratoire de Génétique Moléculaire, Immunologie et Biotechnologie, Faculté des Sciences de Tunis, Campus Universitaire 2092 El Manar, Tunisie
2Faculté des Sciences de Bizerte, 7021 Zarzouna, Tunisie
3Laboratoire de Génétique des micro-organismes, Université de Liège, Institut de Botanique (Bat. 22) 4000 Liège, Belgium
4
INRA, UMR CBGP 1062, Campus international de Baillarguet, CS 30016, F-34988 Montferrier-sur-Lez cedex, France
5
Institute of Biology and Soil Science, Far East Branch of Russian Academy of Sciences, Vladivostok, 690022, Russia
6Laboratory of Cytogenetics, Koltzov Institute of Developmental Biology, Russian Academy of Sciences, 119334 Moscow, Russia
Received 13 January 2010; revised 15 March 2010; accepted for publication 15 March 2010bij_1477797..821
The phylogeography of four Apodemus species (Apodemus agrarius, Apodemus peninsulae, Apodemus latronum, and Apodemus draco) was studied in the Far East of Asia, based on sequences of the mitochondrial DNA cytochrome b gene. The results obtained show the existence of many different genetic lineages within the studied Apodemus species, suggesting the isolation and differentiation of populations in multiple refuge areas. Higher genetic diversities in some regions such as Yunnan, Sichuan (China), and eastern Russia suggest these areas are potential refuges for these species. The existence of such complex genetic structures could be linked to the presence of many biogeographic barriers (Himalaya Mountains, Tien-shan Mountains, Altai Mountains, Tibetan Plateau, Gobi desert, Yunnan Guizhou Plateau, Dzungaria basin, and others) in these regions, which were probably reinforced during the Quaternary climate changes. These barriers also played an important role concerning the low dispersal abilities of the two studied Apodemus species adapted to forest habitats (A. latronum and A. draco) with respect to colonizing regions other than China. © 2010 The Linnean Society of London, Biological Journal of the Linnean Society, 2010, 100, 797–821.
ADDITIONAL KEYWORDS:China – Russia – glacial refuges.
INTRODUCTION
In recent years, a great number of phylogeogra-phic studies have been published on European plants, insects, amphibians, birds, fishes, and several
mammals (Taberlet et al., 1998; Avise, 2000; Hewitt, 2001). They have shown the importance of Pleistocene climate changes and biogeographic barriers such as mountains, rivers, seas, and deserts for the diver-sification, radiation, and isolation of new genetic lineages within many species (Avise, 2000; Riddle et al., 2000). These climatic oscillations and particular topographies played a major role in shaping of the
present geographical distribution of species, including their genetic structure and diversity (Avise, 1994). This phenomenon has resulted in the extinction of the northern populations of many species during ice ages, followed by subsequent northward expansions from refugia during interglacial periods (Hewitt, 1996, 1999, 2000; Taberlet et al., 1998). Avise (1994) and Hewitt (1996) postulated that the rapid expansion from refugial populations involved periodic bottle-necking with a progressive loss of allelic diversity. This would result in lower genetic diversity in popu-lations present in the more recently colonized places. By contrast, it would be expected that the populations remaining in the refugia would be less affected by climatic changes and would be more genetically diverse. The isolation of populations of many species in separate southern regions during ice ages could have resulted in an allopatric differentiation into several genetic groups that recolonized the western Palaearctic region in different ways at the end of the last ice age.
Many phylogeographic studies were also carried out in other regions such as North America (Funk et al., 2008; Hull et al., 2008; Aubry et al., 2009; Latch et al., 2009; Timpe, Graham & Bonett, 2009), Central and South America (Da Silva & Patton, 1998; Paris et al., 2000; Cabanne et al., 2008; Zemlak et al., 2008), as well as in Australia (Waters & Roy, 2003; Miller & Allsopp, 2005; Carini & Hughes, 2006). Similar to Europe, they demonstrated complex phylogeographic patterns for these regions. These patterns also appear to be linked to the extension of the ice sheets during the Pleistocene climate changes, the fragmentation of forests, and the aridification of some regions, as well as to the presence of biogeographic barriers such as the Rockies, the Appalachian, and the Andean moun-tains (Hewitt, 2000).
Concerning regions in Asian Far East, the glacial advances were not as extensive as in Europe or in America because of the influence of the monsoons from south-east Asia and the increasingly arid climates resulting from the Quaternary uplift of the Tibetan plateau (Zhou et al., 2004). However, geological data have demonstrated that, during the Last Glacial Maximum, ice sheets five- to seven-fold larger than the current ones covered the Tibetan Plateau. Moreover, paleoecological biome reconstructions and palynologi-cal data (Harrison, Yu & Takahara, 2001) have indi-cated that, during the same period, the steppe and desert vegetation extended to the modern coastline of eastern China instead of the temperate deciduous forests currently found over the same area. The bound-ary of coniferous forests probably shifted 300–1000 km south of 30°N during this period (Chen et al., 2008).
Although coniferous and deciduous forests most likely recolonized a part of northern China during the
interglacial periods (Chen et al., 2008), the climate recoveries were unlike those of other regions owing to the continuing uplift of the Tibetan Plateau (Zhou et al., 2004). Indeed, this geological phenomenon, con-sidered to be one of the most important events of the Quaternary period, caused great climatic changes even during the interglacial periods, with grasslands replacing forests in many regions as the climate gradually became drier, colder, and windier (Wu et al., 2001).
Despite the relatively ‘milder’ climate than the one in other regions in the world, the frequent arid phases and changes of vegetation of many Chinese regions during the Quaternary climatic fluctuations probably strongly influenced the evolution and distribution of many species (Duan et al., 2009).
However, excepting partial information on the red deer (Cervus elaphus) (Mahmut et al., 2002; Ludt et al., 2004), the lesser white-toothed shrew (Croci-dura suaveolens) (Dubey et al., 2006), the red panda (Ailurus fulgens) (Li et al., 2005), the harvest mouse (Micromys minutus) (Yasuda et al., 2005), the greater long-tailed hamster (Tscherskia triton) (Xie & Zhang, 2005) or the Caspian tiger (Panthera tigris virgata) (Driscoll et al., 2009), very few phylogeographic studies have been carried out on mammal species from these regions.
To better understand the phylogeographic structure of mammal species from Asian Far East or the east Palaearctic, we chose to study the phylogeographic structure of four Apodemus Kaup, 1829 species (Rodentia, Muridae) from this region: Apodemus agrarius Pallas, 1771, Apodemus peninsulae Thomas, 1906, Apodemus latronum Thomas, 1911, and Apode-mus draco Barrett-Hamilton, 1900 (Smith & Xie, 2008).
Species of the genus Apodemus are the most common rodents in broad-leaf forests in the temper-ate zone of the Palaearctic region (Corbet, 1978; Corbet & Hill, 1992). They generally depend on forest resources, such as seeds and small invertebrates. Apodemus latronum and A. draco are particularly associated with forests (Vaniscotte et al., 2009). By contrast, A. agrarius and A. peninsulae are commonly observed in more open habitats such as shrubs, field banks, slope grass, sparse bushes or steppes (Smith & Xie, 2008; Vaniscotte et al., 2009).
Apodemus species have limited species-specific dis-tributions, with two or more species often cohabiting the same forest (Corbet, 1978). Recent phylogenetic analyses (Michaux et al., 2002; Suzuki et al., 2008) demonstrated that these East Asian Apodemus species appeared after a two-step radiation process: the first step occurring approximately 4.5–5 Mya, gave rise to A. agrarius and the ancestor of A. draco/A. latronum and A. peninsulae. The second
step took place approximately 2 Mya when A. draco and A. latronum diverged, probably after an allopat-ric or parapatallopat-ric speciation (Suzuki et al., 2008). These radiation events were most likely primed by global changes that occurred 5–6 Mya and 2–3 Mya (beginning of the Quaternary period) (Michaux et al., 2002). Therefore, because these species have been present and diversified in this area for several mil-lions of years, they represent interesting models by which to better understand the impact of past climate fluctuations on their genetic diversity.
More precisely, the present study aimed to answer several questions: Do these Apodemus species display intraspecific genetic diversity? If so, is this genetic diversity geographically structured? Could it be asso-ciated with the very complex topography characteriz-ing these regions, particularly in China (i.e. the Himalaya Mountains, the deep river valleys between recently uplifted mountains or the Gobi desert)? As in other regions of the world, did the Quaternary climate fluctuations play a role in this intraspecific genetic differentiation and, if so, at what level? What was demographic history of the species during this period?
MATERIAL AND METHODS
BIOLOGICAL MATERIAL
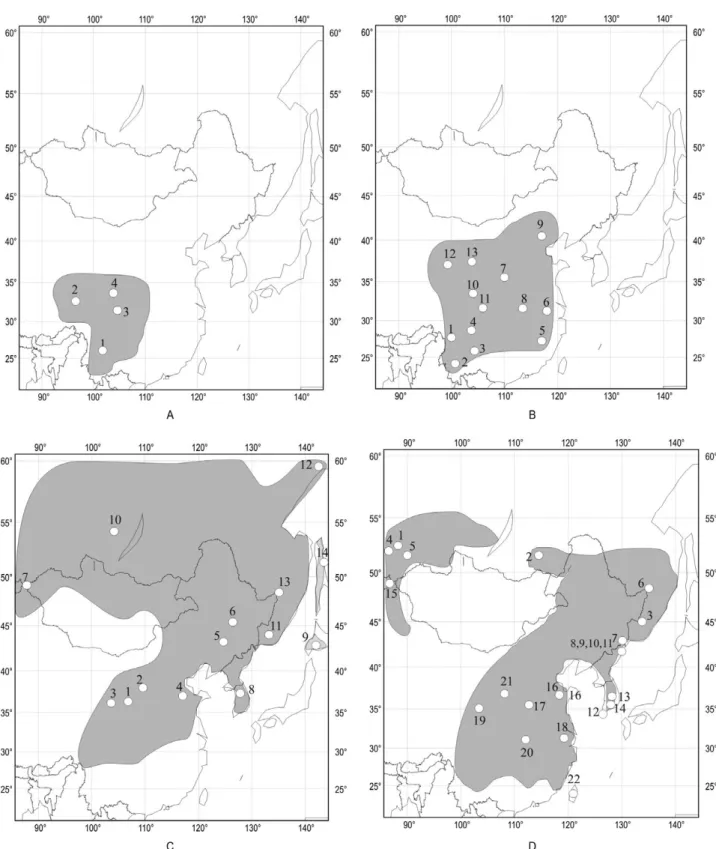
We analyzed the tissues of a total of 118 specimens of four Apodemus species (20 A. draco, 19 A. latronum, 25 A. peninsulae, 54 A. agrarius) from China and the Russian Far East localities (Table 1) and widespread throughout their Asian Far East distribution area (Fig. 1A, B, C, D). These tissues came from the Apo-demus tissue collection of the Center of Biology and Management of Populations of Montpellier (CBGP), France (curator J.P. Quéré) (Giraudoux et al., 2008; Raoul et al., 2008), the collection of Drs M. Pavlenko, I. Kartavtseva, and G. Chelomina (housed at the Institute of Biology and Soil Science, Far East Branch of Russian Academy Science, Vladivostok, Russia), as well as the collection of Dr A. Bogdanov (housed at Koltzov Institute of Developmental Biology, Russian Academy of Sciences, Moscow, Russia).
Other sequences from GenBank were also used in the present study: 20 A. draco, four A. latronum, 40 A. peninsulae, and 11 A. agrarius (Table 1).
DNAANALYSIS
DNA was extracted using the DNeasy Tissue Kit (Qiagen). A large portion of the cytochrome b gene (cyt b) was amplified using the universal polymerase chain reaction (PCR) primers L7 (5′-ACCAATGACATGAAAAATCATCGTT-3′) and H6 (5′-TCTCCATTTCTGGTTTACAAGAC-3′) (Kocher, Thomas & Meyer, 1989). The amplification reactions
were carried out in 50-mL volumes including 12.5 mL of each 2mM primer, 10 mL of 1 mM dNTP, 5 mL of 10¥ reaction buffer, 5 mL of purified water and 0.25 mL of 5 UmL–1Taq DNA polymerase (Promega).
Approxi-mately 100 ng of DNA extract were used per PCR amplification. The amplifications were performed in a Labover PTC100 thermal cycler over 40 cycles (45 s at 94 °C, 45 s at 52 °C, and 2 min at 72 °C) with a final extension cycle of 10 min at 72 °C. The PCR products were purified. Both strands were sequenced using ABI 3700 automated DNA sequencer (Applied Biosystems) in accordance with the manufacturer’s instructions.
The 118 new Apodemus sequences were deposited in the EMBL GenBank under accession numbers AM945740 to AM945857.
PHYLOGENETIC ANALYSIS
The published cyt b gene sequences for the studied Apodemus species were downloaded from GenBank (Table 1) and aligned to the new sequences using BIOEDIT, version 7.0.0 (Hall, 1999). The aligned sequences were analyzed using distances [Neighbour-joining (NJ); Saitou & Nei, 1987], maximum-parsimony (MP) (Fitch, 1971) using PAUP4b8 (Swofford, 2000), and the maximum likelihood (ML) criterion implemented in PHYML (Guindon & Gascuel, 2003). The most suitable models of DNA substitution for the distance and ML analyses were calculated using MODELTEST, version 3.0 (Posada & Crandall, 1998). MP analysis was con-ducted with the heuristic search algorithm, tree-bisection–reconnection (TBR) swapping and a maximum number of trees constrained to 1000. The robustness of the trees was assessed by bootstrap resampling (1000 random replications for NJ, MP, and ML analyses; Felsenstein, 1985).
PHYLOGEOGRAPHICAL AND GENETIC
STRUCTURE ANALYSIS
A mismatch distribution of substitutional differences between pairs of haplotypes was calculated within each of the main populations of each species and compared with a fit to the Poisson model using DNASP, version 4.0 (Rozas et al., 2003). This analysis provided an estimate of the population dynamics (either in recent expansion or rather stable in time) for the different lineages. Fu’s FSstatistic (Fu, 1997) analyses
were also used to detect population demographic expansion. The significance was evaluated by 1000 random permutations in ARLEQUIN, version 2.0 (Schneider, Roessli & Excoffier, 2000).
Haplotype (Hd) and nucleotide diversities (Nei,
1987) and their SD (Tajima, 1993) were estimated using DNASP, version 4.0.
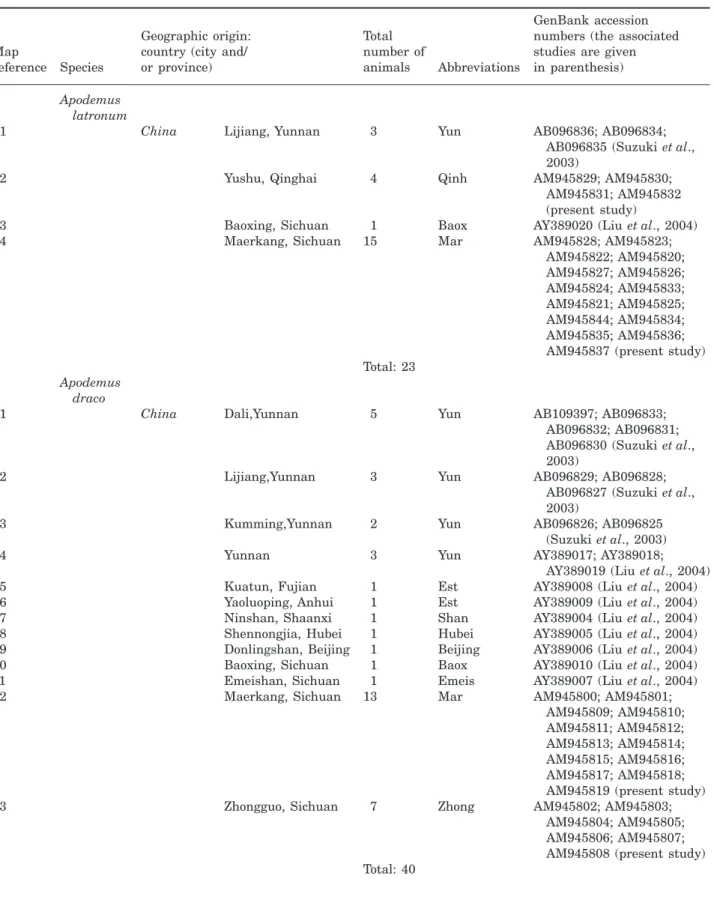
Table 1. Map references, geographical locations, sample abbreviations, and GenBank Accession numbers of Apodemus haplotypes used in the present study
Map
reference Species
Geographic origin: country (city and/ or province)
Total number of
animals Abbreviations
GenBank accession numbers (the associated studies are given in parenthesis)
Apodemus latronum
1 China Lijiang, Yunnan 3 Yun AB096836; AB096834;
AB096835 (Suzuki et al., 2003)
2 Yushu, Qinghai 4 Qinh AM945829; AM945830; AM945831; AM945832 (present study)
3 Baoxing, Sichuan 1 Baox AY389020 (Liu et al., 2004) 4 Maerkang, Sichuan 15 Mar AM945828; AM945823;
AM945822; AM945820; AM945827; AM945826; AM945824; AM945833; AM945821; AM945825; AM945844; AM945834; AM945835; AM945836; AM945837 (present study) Total: 23
Apodemus draco
1 China Dali,Yunnan 5 Yun AB109397; AB096833;
AB096832; AB096831; AB096830 (Suzuki et al., 2003)
2 Lijiang,Yunnan 3 Yun AB096829; AB096828; AB096827 (Suzuki et al., 2003)
3 Kumming,Yunnan 2 Yun AB096826; AB096825 (Suzuki et al., 2003)
4 Yunnan 3 Yun AY389017; AY389018;
AY389019 (Liu et al., 2004) 5 Kuatun, Fujian 1 Est AY389008 (Liu et al., 2004) 6 Yaoluoping, Anhui 1 Est AY389009 (Liu et al., 2004) 7 Ninshan, Shaanxi 1 Shan AY389004 (Liu et al., 2004) 8 Shennongjia, Hubei 1 Hubei AY389005 (Liu et al., 2004) 9 Donlingshan, Beijing 1 Beijing AY389006 (Liu et al., 2004) 10 Baoxing, Sichuan 1 Baox AY389010 (Liu et al., 2004) 11 Emeishan, Sichuan 1 Emeis AY389007 (Liu et al., 2004) 12 Maerkang, Sichuan 13 Mar AM945800; AM945801;
AM945809; AM945810; AM945811; AM945812; AM945813; AM945814; AM945815; AM945816; AM945817; AM945818; AM945819 (present study) 13 Zhongguo, Sichuan 7 Zhong AM945802; AM945803;
AM945804; AM945805; AM945806; AM945807; AM945808 (present study) Total: 40
Table 1. Continued
Map
reference Species
Geographic origin: country (city and/ or province)
Total number of
animals Abbreviations
GenBank accession numbers (the associated studies are given in parenthesis)
Apodemus peninsulae
1 China Rangtang, Sichuan 10 Rang AM945779; AM945842; AM945786; AM945840; AM945789; AM945790; AM945791; AM945798; AM945799; AM945843 (present study 2 Xiji, Ningxia 11 Ning AM945792; AM945793;
AM945794; AM945795, AM945796; AM945797; AM945780; AM945781; AM945841; AM945787; AM945788 (present study) 3 Baiyu, Sichuan 1 Baiy AY389001 (Liu et al., 2004) 4 Taishan, Shandong 1 Shand AY389002 (Liu et al., 2004) 5 Changchun, Jilin 1 Jilin AY388999 (Liu et al., 2004) 6 Haili, Heilongjiang 1 Haili AY389000 (Liu et al., 2004) 7 Baihaba, Xinjiang 4 Ping AM945782; AM945783;
AM945784; AM945785 (present study)
8 Korea South Korea 4 Kor AB073809; AB073810;
AB073811; AB073818 (Serizawa et al., 2002) 9 Japan Hayakita, Japan 4 Japan AB032850 (Serizawa et al.,
2000); AB073790; AB073788; AB073789 (Serizawa et al., 2002)
10 Russia Siberia 8 Sib AB073806; AB073802;
AB073807; AB073803; AB073805; AB073808; AB073801; AB073804 (Serizawa et al., 2002)
11 Primorye 12 Pri AB073797; AB073796;
AB073813; AB073794; AB073812; AB073800 ; AB07381 ; AB073799 ; AB073815; AB073816; AB073817; AB073798 (Serizawa et al., 2002) 12 Magadan 1 Mag AB073795 (Serizawa et al.,
2002)
13 Khabarovsk 4 Kha AF427337; AF427338;
AF427336; AF427335 (Dekonenko & Ivanov, Unpubl.
14 Sakhalin island 3 Sak AB073793; AB073792; AB073791 (Serizawa et al., 2002)
Table 1. Continued
Map
reference Species
Geographic origin: country (city and/ or province)
Total number of
animals Abbreviations
GenBank accession numbers (the associated studies are given in parenthesis)
Apodemus agrarius
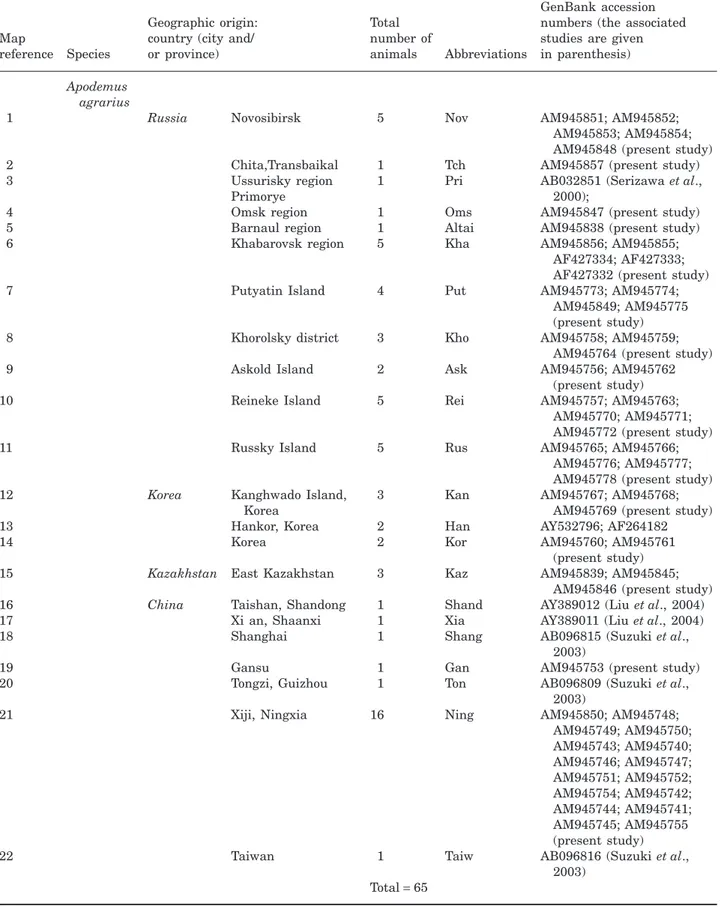
1 Russia Novosibirsk 5 Nov AM945851; AM945852;
AM945853; AM945854; AM945848 (present study) 2 Chita,Transbaikal 1 Tch AM945857 (present study) 3 Ussurisky region 1 Pri AB032851 (Serizawa et al.,
2000); Primorye
4 Omsk region 1 Oms AM945847 (present study) 5 Barnaul region 1 Altai AM945838 (present study) 6 Khabarovsk region 5 Kha AM945856; AM945855;
AF427334; AF427333; AF427332 (present study) 7 Putyatin Island 4 Put AM945773; AM945774;
AM945849; AM945775 (present study) 8 Khorolsky district 3 Kho AM945758; AM945759;
AM945764 (present study)
9 Askold Island 2 Ask AM945756; AM945762
(present study) 10 Reineke Island 5 Rei AM945757; AM945763;
AM945770; AM945771; AM945772 (present study) 11 Russky Island 5 Rus AM945765; AM945766;
AM945776; AM945777; AM945778 (present study) 12 Korea Kanghwado Island,
Korea
3 Kan AM945767; AM945768; AM945769 (present study) 13 Hankor, Korea 2 Han AY532796; AF264182
14 Korea 2 Kor AM945760; AM945761
(present study) 15 Kazakhstan East Kazakhstan 3 Kaz AM945839; AM945845;
AM945846 (present study) 16 China Taishan, Shandong 1 Shand AY389012 (Liu et al., 2004) 17 Xi an, Shaanxi 1 Xia AY389011 (Liu et al., 2004) 18 Shanghai 1 Shang AB096815 (Suzuki et al.,
2003)
19 Gansu 1 Gan AM945753 (present study)
20 Tongzi, Guizhou 1 Ton AB096809 (Suzuki et al., 2003)
21 Xiji, Ningxia 16 Ning AM945850; AM945748; AM945749; AM945750; AM945743; AM945740; AM945746; AM945747; AM945751; AM945752; AM945754; AM945742; AM945744; AM945741; AM945745; AM945755 (present study)
22 Taiwan 1 Taiw AB096816 (Suzuki et al.,
2003) Total= 65
Figure 1. Geographic distribution of the Apodemus samples. A, Apodemus latronum. B, Apodemus draco. C, Apodemus
Networks were constructed using minimum span-ning network (MINSPNET in ARLEQUIN, version 2.0; Schneider et al., 2000) and median-joining network (MJ) (Bandelt, Forster & Röhl, 1999; Network 4.000, available at http://www.fluxus-engineering.com) methods.
FST values were calculated with DNASP, version 4
(Rozas et al., 2003) to analyse the genetic differentia-tion and estimate the gene flow among populadifferentia-tions.
DIVERGENCE TIME
Relative-rate tests and an approximate time of diver-gence between the observed mitochondrial (mt)DNA lineages were calculated sensu Michaux et al. (2003). The genetic distance between two different lineages was corrected for ancestral mtDNA polymorphism using the formula of Edwards (1997). Two calibration points derived from paleontological data were used for this analysis. First, the divergence time between A. mystacinus and all the ‘small’ Sylvaemus was esti-mated at approximately 7 Mya (Aguilar & Michaux, 1996; Michaux et al., 1997) and, second, the diver-gence between A. sylvaticus and A. flavicollis was estimated at approximately 4 Mya (Michaux & Pas-quier, 1974; J. Michaux, pers. comm.).
RESULTS
SICHUAN FIELD MOUSE, A. LATRONUM
A total of 14 haplotypes were identified among the 23 A. latronum cytb sequences. Among the 1138 bp sequenced, 69 sites were variable and 44 were parsi-mony informative. The nucleotide frequencies were 32.6%, 24.7%, 12.5%, and 30.6 % for A, C, G, and T, respectively.
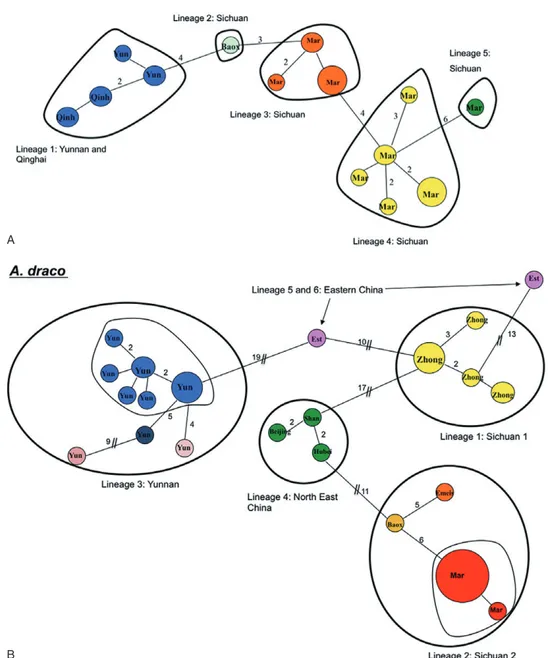
The minimum spanning network (Fig. 2A) revealed five genetic lineages separated by at least four muta-tional steps: one corresponds to animals from the Yunnan province (southern China) (lineage 1), but also surprisingly from the Qinghai province (Yushu, south-western China) (Figs 2A, 3A). The other lineages (lin-eages 2, 3, 4, and 5) correspond to woodmice from the Sichuan province (central China). These results are confirmed by the MJ network and the phylogenetic reconstructions performed using maximum parsimony algorithms, NJ and ML methods (not shown): the composition of the major lineages is identical to the one formed by the minimum spanning network (with a high bootstrap support in the range 72–82%).
To demonstrate potential regional refuge regions in China as suggested by other zoogeographic (Udvardy, 1969) and phylogeographic studies (Song et al., 2009; Zhang et al., 2009), we defined three groups within our dataset and tested whether they were character-ized by high levels of nucleotide diversity as generally
observed in refugia. The first group corresponds to animals from Sichuan and is characterized by quite a high level of nucleotide diversity (p) (0.00576) compared to the second group of specimens from Yunnan (0.00387) and the third group of animals from Qinghai (0.00356) (Table 2). The intrapopula-tional genetic diversity follows the same pattern, with values of 0.6% K2P genetic divergence for the Sichuan population and 0.4%–0.3% for the Yunnan-Qinghai ones, respectively (Table 2).
By contrast, the Yunnan/Qinghai populations are separated by 1.5% of K2P genetic distance from the Sichuan ones (Table 3). This pattern is corroborated by high FST values among these populations (0.66),
suggesting low gene flow among them (Table 4). However, these latter results must be considered with caution because the samplings for the Yunnan and Qinghai populations was low.
The mismatch distribution analyses (Fig. 4A) tends to a bell-shaped distribution for the Sichuan popula-tion, suggesting its sudden expansion. The Fu’s FS
statistic confirmed a demographic expansion for this last population (Table 5). Animals from the Yunnan and Qinghai populations were not tested with these methods because the samplings were too low (three and four animals, respectively).
The divergence time between the Sichuan and Yunnan/Qinghai lineages was estimated to have taken place approximately 350 000 years ago.
SOUTHERNCHINESE FIELD MOUSE, A. DRACO
A total of 22 haplotypes were identified among the 40 A. draco cyt b sequences analyzed. Of the 1135 bp sequenced, 204 sites were variable and 141 were parsimony informative. The nucleotide frequencies are 32.3%, 24.5%, 12.6%, and 30.6%, for A, C, G, and T, respectively.
The minimum spanning network (Fig. 2B) revealed six different lineages separated by 10 to 19 muta-tional steps. Two of them correspond to two popula-tions from the Sichuan province (lineage 1 from Zhongguo and lineage 2 from Maerkang, Emeishan and Baoxing). Moreover, lineage 2 is divided into three sublineages separated by at least five muta-tional steps. Lineage 3 corresponds to animals from the Yunnan province (Dali, Kumming, and Lijiang) and is divided into four sublineages separated by four to nine mutational steps. Lineage 4 associates speci-mens from north-east China (Beijing and Hubei provinces), whereas lineages 5 and 6 correspond to specimens collected in eastern China (Kuatun, Fujian province, and Yaoluoping, Anhui province) (Figs 2B, 3B).
Similar to A. latronum, the MJ network and the phylogenetic reconstructions (not shown) also confirm
these complex results: the composition of the major lineages is identical to those formed by the minimum spanning network (with a high bootstrap support in the range 75–100%).
Again, to assess whether nucleotide diversity was higher within the potential regional refuge regions, we defined four groups within our dataset: a Sichuan group (associating lineages 1 and 2),
which showed a high level of nucleotide diversity compared to a second group including the animals from Yunnan (lineage 3), a third group of speci-mens from north-eastern China and a fourth one corresponding to the animals from eastern China (Table 2). The level of K2P genetic divergence gives similar results (Table 3). However, the results for eastern China must be taken with caution A
B
Figure 2. Minimum spanning networks of the mitochondrial DNA haplotypes demonstrated in the studied Apodemus species. A, Apodemus latronum. B, Apodemus draco. C, Apodemus peninsulae. D, Apodemus agrarius. The number of mutations (greater than one) between haplotypes is indicated in branches. Haplotype designations are provided in Table 1. Symbols correspond to the different genetic groups observed within each species (Fig. 3).
because the sampling for this region was very low (N= 2).
The mismatch distribution analyses (Fig. 4B) revealed a heterogeneous distribution for animals
from Sichuan (lineages 1 and 2) and Yunnan (lineage 3), suggesting that these populations are relatively stable. This analysis was not possible on the other lineages because of their low sampling.
C
D Figure 2. Continued
The K2P genetic distances observed among the animals from the different regions were very high (average of 6.3%; Table 3). The FSTvalues were also
very high among the observed populations (Table 4). The divergence time estimated between the main lineages corresponds to periods from 1.5–1.7 Myrs (north-eastern China/Sichuan) to 2.0–2.2 Myr (Sichuan/Yunnan).
KOREAN FIELD MOUSE, A.PENINSULAE
We identified a total of 38 haplotypes among the 66 A. peninsulae cyt b sequences. Within the 1126 bp of the matrix, 208 sites (21%) were variable and 122 (12%) were parsimony informative. The nucleotide frequen-cies are 31%, 25.5%, 12.7%, and 30.8%, for A, C, G, and T, respectively.
The minimum spanning network (Fig. 2C) revealed three main lineages and another one separated by more than four mutational steps. Lineage 1 comprises animals from the Sichuan province (Baiyu and Rang-tang). Lineage 2 corresponds to northern (Ningxia province) and eastern Chinese (Shandong province), Korean, and Siberian animals (Fig. 3C). Lineage 3 is represented by the Russian Far East (Primorye, Khabarovsk, Sakhalin island, Magadan, Siberia), north-western (Xinjiang province) and north-eastern Chinese (Jilin province), as well as the Japanese specimens (Figs 2C, 3C). Finally, the fourth lineage
corresponds to an individual from the Heilongjiang province (north-eastern China).
Again, the MJ network and the phylogenetic recon-structions (not shown) gave the same topology, and the major lineages were supported with a high boot-strap value in the range 86–99%.
As for two previous species, we defined six groups within our dataset to assess whether the nucleotide diversity was higher within the potential refuge regions: the first one corresponding to the Sichuan Chinese province, the second to specimens from the Ningxia Chinese province, the third to populations from the Russian Far East (Primorye, Khabarovsk), a fourth group of animals from the Sakhalin island, the fifth comprising the Japanese population, and, finally, the last one corresponding to animals from the Magadan region, southern Siberia, and the Altai region (Xinjiang province).
The animals from the Taishan (Shandong) region as well as from Korea were not taken into account in this analysis because the samplings were too low (one and four animals, respectively).
The Sichuan group as well as the animals from Japan and the Sakhalin Island have a rela-tively weak level of nucleotide diversity compared to the second group (Xinjiang) and the Siberian populations (Table 2). The animals from the Russian Far East (group 3), southern Siberia, and the Altai region (group 6) showed intermediate values Table 2. Genetic variability observed within the main groups of Apodemus latronum, Apodemus draco, Apodemus
peninsulae, and Apodemus agrarius
Species Genetic groups Number of samples % Genetic diversity (K2P) Number of haplotypes Hd± SD p ± SD Apodemus latronum Yunnan (lineage 1) 3 0.4 3 0.857 ± 0.102 0.00387 ± 0.00070 Sichuan (lineages 2 to 5) 16 0.6 10 0.933 ± 0.040 0.00576 ± 0.00089 Qinghai 4 0.3 2 0.656 ± 0.120 0.00356 ± 0.00065 Apodemus draco
Sichuan (lineages 1 and 2) 22 1.2 9 0.814 0.03088 ± 0.00473
Yunnan (lineage 3) 13 1.3 10 0.949 ± 0.051 0.01282 ± 0.00276
North-eastern China (lineage 4) 3 0.5 3 1 ± 0.272 0.00575 ± 0.00169
Eastern China (lineages 5 and 6) 2 4.1 2 1 ± 0.5 0.05179 ± 0.02589
Apodemus peninsulae
Sichuan, China (lineage 1) 17 0.8 10 0.875 ± 0.070 0.00489 ± 0.00046
Ningxia, China 11 0.9 11 1 ± 0.039 0.01477 ± 0.00206
Russian Far East 16 0.5 12 0.942 ± 0.048 0.00636 ± 0.00105
Magadan, south Siberia and Altai 11 0.6 8 0.927 ± 0.042 0.00876 ± 0.00081
Japan 4 0.0 3 0.833 ± 0.222 0.00132 ± 0.00048
Sakhalin 3 0.2 3 1 ± 0.272 0.00292 ± 0.00048
Apodemus agrarius
China (lineages 1 to 5) 21 1.2 14 0.948 ± 0.031 0.01144 ± 0.00127
Central Asia (lineages 6 and 9) 10 0.5 10 1 ± 0.045 0.00553 ± 0.00125
Russian Far East (lineages 7 and 8) 26 0.9 10 0.772 ± 0.078 0.00843 ± 0.00117
Korea (lineages 10 and 11) 7 0.9 6 0.952 ± 0.096 0.00829 ± 0.00151
# # # # # # # # # # # # # # Xi'an Seoul Hanoi Urumqi Sapporo Magadan Kunming Iakutsk Chengdu Beijing Shanghai Irkoutsk Ulaanbaatar Novossibirsk Mar Yun Baox Qinh Tien shan Tien shan Tarim basin Tarim basin Gobi deserts Gobi deserts Dzungar basin Dzungar basin (Himalaya Mts) (Himalaya Mts) Tibetan plateau Tibetan plateau Altai mountains Altai mountains 70°E 70°E 80°E 80°E 90°E 90°E 100°E 100°E 110°E 110°E 120°E 120°E 130°E 130°E 140°E 140°E 150°E 150°E 20°N 20°N 30°N 30°N 40°N 40°N 50°N 50°N 60°N 60°N 70°N
A
A. latronum
70°NA. draco
B
# # # # # # # # # # # # # # Mar Est Est Yun Yun Yun Yun Baox Shan Zhong Emeis Hubei Beijing Xi'an Seoul Hanoi Urumqi Sapporo Magadan Kunming Iakutsk Chengdu Beijing Shanghai Irkoutsk Ulaanbaatar Novossibirsk Tien shan Tien shan Tarim basin Tarim basin Gobi deserts Gobi deserts Dzungar basin Dzungar basin (Himalaya Mts) (Himalaya Mts) Tibetan plateau Tibetan plateau Altai mountains Altai mountains 70°E 70°E 80°E 80°E 90°E 90°E 100°E 100°E 110°E 110°E 120°E 120°E 130°E 130°E 140°E 140°E 150°E 150°E 20°N 20°N 30°N 30°N 40°N 40°N 50°N 50°N 60°N 60°N 70°N 70°NFigure 3. Geographic distribution of the different genetic lineages observed on the studied Apodemus species. A,
Apodemus latronum. B, Apodemus draco. C, Apodemus peninsulae. D, Apodemus agrarius. The genetic lineages are
described according to the colours given in Fig. 2. The codes of the different sampling localities are given according to Table 1 and Fig. 2. The names of the main cities and biogeographical barriers are also shown.
70°E 80°E 90°E 100°E 110°E 120°E 130°E 140°E 150°E
70°E 80°E 90°E 100°E 110°E 120°E 130°E 140°E 150°E
A. peninsulae
C
20°N 30°N 40°N 50°N 60°N 70°N 20°N 30°N 40°N 50°N 60°N 70°N # # # # # # # # # # # # # # sak Kha Mag Pri Sib Kor Ping Baiy Ning Rang Japan Haili Jilin Shand Xi'an Seoul Hanoi Urumqi Sapporo Magadan Kunming Iakutsk Chengdu Beijing Shanghai Irkoutsk Ulaanbaatar Novossibirsk Tien shan Tien shan Tarim basin Tarim basin Gobi deserts Gobi deserts Dzungar basin Dzungar basin (Himalaya Mts) (Himalaya Mts) Tibetan plateau Tibetan plateau Altai mountains Altai mountains Yunnan Guizhou pl. Yunnan Guizhou pl.70°E 80°E 90°E 100°E 110°E 120°E 130°E 140°E 150°E 70°E 80°E 90°E 100°E 110°E 120°E 130°E 140°E 150°E
A. agrarius
D
20°N 30°N 40°N 50°N 60°N 70°N 20°N 30°N 40°N 50°N 60°N 70°N # # # # # # # # # # # # # # Ton Gan Xia Kaz Kor Han Kan Rus Rei Ask Kho Put Kha Oms Pri Tch Nov Taiw Ning Shang Shand Altai Xi'an Seoul Hanoi Urumqi Sapporo Magadan Kunming Iakutsk Chengdu Beijing Shanghai Irkoutsk Ulaanbaatar Novossibirsk Tien shan Tien shan Tarim basin Tarim basin Gobi deserts Gobi deserts Dzungar basin Dzungar basin (Himalaya Mts) (Himalaya Mts) Tibetan plateau Tibetan plateau Altai mountains Altai mountains Yunnan Guizhou pl. Yunnan Guizhou pl. Figure 3. Continued(Table 2). The levels of K2P genetic divergence are summarized in Table 2. They once again demon-strated that the Sakhalin and Japan populations are characterized by a weak level of genetic diversity. However, this result must be taken with caution because the samplings for these regions were low (three and four animals, respectively). By con-trast, the Sichuan animals and specimens from Ningxia (China) showed higher values (0.8–0.9% K2P distances).
The mismatch distribution analyses (Fig. 4C) revealed that the population from Sichuan (lineage 1) was stable. This result was corroborated by Fu’s FS
analyses. By contrast, mismatch distribution and Fu’s FSanalyses demonstrated that animals from Ningxia
(China), as well as from the Russian Far East and the Magadan-Siberia-Altai region, presented a signal of expansion (Table 5).
A high value of FST (in the range 0.57–0.81) was
obtained between the main groups, suggesting a weak gene flow between these regions. However, FSTis low
between the Russian Far East animals and those from Sakhalin (0.25915) or the populations from Siberia-Magadan-Altai, suggesting recent contacts between these regions (Table 4).
The divergence time estimated between the main lineages corresponds to relatively recent periods, in the range 105 000–115 000 years (Japan/Russian Far East) to 140 000–150 000 years (Sakhalin/Russian Far East).
STRIPED FIELD MOUSE, A. AGRARIUS
A total of 37 haplotypes among the 65 A. agrarius cytb sequences were identified. Within the 1113 bp of the matrix, 141 sites (13%) were variable and 68 (6.1%) were parsimony informative. The nucleotide frequencies are 30.1%, 27.2%, 13.4%, and 29.3%, for A, C, G, and T, respectively.
The minimum spanning network (Fig. 2D) of A. agrarius showed an important genetic structure with twelve lineages separated by at least four muta-Table 3. Genetic divergences (K2P distances) between the main groups of Apodemus latronum, Apodemus draco,
Apodemus peninsulae, and Apodemus agrarius
Apodemus latronum Sichuan
Yunnan/Qinhai 0.015/0.010 Apodemus draco Yunnan (lineage 3) Sichuan (lineages 1 and 2) North-eastern China (lineage 4) Sichuan (lineages 1 and 2) 0.064/0.055
North-eastern China (lineage 4) 0.061/0.052 0.051/0.032
Eastern China (lineages 5 and 6) 0.064/0.037 0.043/0.029 0.056/0.032
Apodemus peninsulae Japan
Russian Far East Magadan, southern Siberia and Altai Sakhalin island Ningxia (China) Russian Far East 0.006/0.003
Magadan, southern Siberia and Altai 0.009/0.006 0.007/0.001
Sakhalin island 0.005/0.004 0.005/0.001 0.008/0.003
Ningxia (China) 0.023/0.019 0.024/0.017 0.027/0.019 0.023/0.017
Sichuan (China, lineage1) 0.037/0.033 0.036/0.029 0.039/0.032 0.031/0.026 0.033/0.025
Apodemus agrarius Central Asia (lineages 6 and 9) China (lineages 1 to 5) Russian Far East (lineages 7 and 8) Taiwan (Lineage 12) China (lineages 1 to 5) 0.015/0.007
Russian Far East (lineages 7 and 8) 0.012/0.005 0.014/0.003
Taiwan (lineage 12) 0.023/0.021 0.019/0.013 0.022/0.018
Korea (lineages 10 and 11) 0.013/0.006 0.014/0.004 0.011/0.003 0.023/0.018 The two values correspond to the Pmeanand P distances.
Table 4. Genetic differentiation (Fst values) between the main groups of Apodemus latronum, Apodemus draco,
Apodemus peninsulae, and Apodemus agrarius
Apodemus latronum Sichuan
Yunnan/Qinhai 0.66489 Apodemus draco Yunnan (lineage 3) North-eastern China (lineage 4) Eastern China (lineages 5 and 6) North-eastern China (lineage 4) 0.8623
Eastern China (lineages 5 and 6) 0.57915 0.57143
Sichuan (lineages 1 and 2) 0.68958 0.56922 0.26229
Apodemus peninsulae Japan
Sakhaline island Russian Far East Magadan, south Siberia and Altai Ningxia (China) Sakhaline island 0.800
Russian Far East 0.57931 0.25915
Magadan, southern Siberia and Altai 0.64138 0.44474 0.17644
Ningxia (China) 0.81039 0.75965 0.70753 0.71764
Sichuan (China, lineage 1) 0.89171 0.83666 0.81910 0.77287 0.74707
Apodemus agrarius Central Asia (Lineage 6 and 9) China (Lineage 1 to 5) Russian Far East (Lineage 7 and 8) China (lineages 1 to 5) 0.43285
Russian Far East (lineages 7 and 8) 0.38708 0.22033
Korea (lineages 10 and 11) 0.46303 0.26092 0.22039
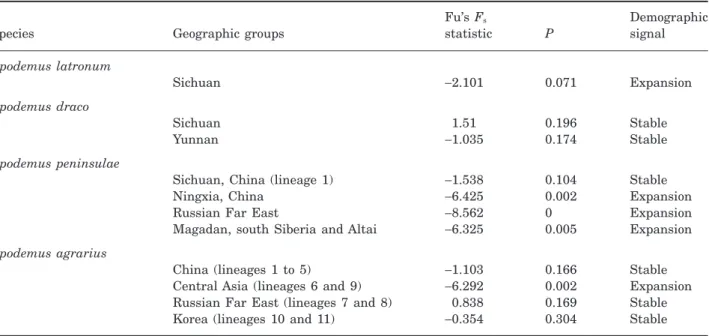
Table 5. Fu’s Fs values for the main groups of Apodemus latronum, Apodemus draco, Apodemus peninsulae, and
Apodemus agrarius
Species Geographic groups
Fu’s Fs statistic P Demographic signal Apodemus latronum Sichuan -2.101 0.071 Expansion Apodemus draco Sichuan 1.51 0.196 Stable Yunnan -1.035 0.174 Stable Apodemus peninsulae
Sichuan, China (lineage 1) -1.538 0.104 Stable Ningxia, China -6.425 0.002 Expansion Russian Far East -8.562 0 Expansion Magadan, south Siberia and Altai -6.325 0.005 Expansion
Apodemus agrarius
China (lineages 1 to 5) -1.103 0.166 Stable Central Asia (lineages 6 and 9) -6.292 0.002 Expansion Russian Far East (lineages 7 and 8) 0.838 0.169 Stable Korea (lineages 10 and 11) -0.354 0.304 Stable The lineages characterized by a too low sampling were not tested using this analysis.
Sichuan
Sichuan : stable population
Yunnan : stable population
Ningxia: population in expansion
Magadan, south Siberia and Altai :
population in expansion
Russian Far East : population in expansion
Sichuan: stable population
A
B
C
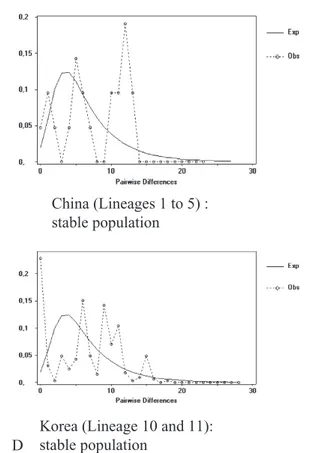
Figure 4. Mismatch distribution analysis for the main lineages evidenced in the studied Apodemus species. A, Apodemus
latronum. B, Apodemus draco. C, Apodemus peninsulae. D, Apodemus agrarius. Lineages represented by too few
tional steps. The Chinese specimens are spread in five different genetic lineages distributed all over the country (Fig. 3D): central (Shaanxi, Ningxia, Gansu provinces) and southern (Guizhou province) China (lineages 1, 2 and 3) and eastern China (Shandong province, Shanghai) (lineages 4 and 5).
The Chinese lineages do not form a particular monophyletic group but are rather dispersed all over the network, where they are connected to the Russian Far East haplotypes. This suggests close relationships between populations from these two regions.
The individuals from Russia and Kazakhstan are distributed in three main lineages (lineages 6, 7 and 8). With the exception of one individual from Kazakhstan (lineage 9), which appears to be genetically differenti-ated, no particular geographic structure can be observed within and among these lineages: all the populations appear to be mixed (Fig. 3D). The animals from Central Asia and Kazakhstan are strongly linked to populations from the Russian Far East and west Siberia (lineage 6) (Figs 2D, 3D). This result suggests a closer relationship between animals from these regions than for those from China or Korea.
Korean animals are split into two genetic lineages (lineages 10 and 11), also suggesting an important genetic diversity.
The MJ network and the phylogenetic reconstruc-tions (not shown) gave the same topology, and the major lineages were supported with a high bootstrap value in the range 88–100%.
Four main groups were defined within our dataset to analyse the genetic diversity within the potential refuge regions: China, Korea, Russian Far East, and Central Asia. The Chinese populations are character-ized by the highest level of nucleotide diversity in contrast to the populations of Central Asia, and Kaza-khstan presenting the lowest values of p (Table 2). Animals from the Russian Far East and Korea gave intermediate values. The levels of K2P genetic diver-gence within each of these population groups gave similar tendencies (Table 2). The values of this last index were quite similar among these population groups (between 1.2–1.5% of K2P distance) (Table 3). However, the sample from Taiwan (lineage 12) appears to be slightly more differentiated from all the others, with values in the range 1.9–2.3% K2P distance. However, these data must be interpreted with caution because the sampling for this region was very low (N= 1).
The mismatch distribution analyses revealed that the Chinese (lineages 1 to 5), Korean (lineages 10 and 11) and Russian Far East (lineages 7 and 8) popula-tions are stable (heterogeneous pattern; Fig. 4D). By
China (Lineages 1 to 5) :
stable population
Central Asia (Lineages 6 and 9) :
population in expansion
Russian Far East (Lineage 7 and 8) :
stable population
Korea (Lineage 10 and 11):
stable population
D
contrast, animals originating from west Siberia and Kazakhstan (lineages 6 and 9), presented a bell-shaped distribution, suggesting a sudden expansion. Fu’s FS index (Table 5) corroborates these patterns.
The separation between Chinese–Russian Far East–Korean animals and central Asian animals is estimated to have taken place approximately 175 000– 192 000 years ago. The Taiwan population appears to have been isolated from the Chinese continental popu-lations for 450 000–500 000 years.
DISCUSSION
ACOMPLEX PHYLOGEOGRAPHIC STRUCTURE
ASSOCIATED WITH THEQUATERNARY PERIOD
The present study clearly demonstrated the existence of an important geographic structure of the genetic variability within each of the studied species. Accord-ing to the divergence time analyses, this genetic differentiation could have occurred during the Quater-nary. Therefore, although a great part of China was not covered by continental ice sheets during the Quater-nary cold phases (Axelrod, Ai-Shehbaz & Raven, 1996; Zhou, 1997; Zhou et al., 2004), it is probable that the cold and dry climates, which nevertheless character-ized these last periods (Harrison et al., 2001), played an important role in the isolation of field mice popu-lations in different regions of China and the Russian Far East. This later led to the appearance of different genetic lineages through allopatric differentiations. This scenario is similar to that generally proposed for other regions, such as Europe or Northern America, to explain the intraspecific genetic structure of many organisms (Avise, 2000). This would also explain the genetic structure of the few other mammal species that were studied in the Asian Far East regions (Mahmut et al., 2002; Li et al., 2005; Oshida et al., 2005), as well as of the birds (Phasianus colchicus and Alcippe mor-risonia: Qu et al., 2009; Song et al., 2009), amphibians (Pelophylax nigromaculata; Zhang et al., 2008) or plants (Dysosma versipellis; Qiu et al., 2009).
However, compared to the other continents, these isolation processes have probably been enhanced by the particular complex geology and topography of China and the Russian Far East. Indeed, different paleoecological and geological data (Harrison et al., 2001; Rousseau D. D., pers. comm.) indicate that the uplift of the Tibetan plateau led to the broadening of several desert regions (such as the Gobi desert) during the Quaternary cold phases (Chen et al., 2008). For example, this phenomenon resulted in the repeated isolation of the Russian Far East and the Korean peninsula. According to the results of the present study, this would have led to the isolation of some populations of A. peninsulae and A. agrarius
within this last region. The complicated topology of southern China, and particularly the existence of deep river valley systems (Zhang et al., 2009) (Fig. 3), also probably led to the isolation and the differentia-tion of several genetic lineages of field mice, as already suggested for other species such as the bird A. morrisonia (Song et al., 2009).
The combination of these historical and geological processes would therefore be at the origin of the very complex phylogeographic structure of the Asian Far East field mice populations (e.g. 12 different genetic lineages within A. agrarius).
Although each species seems to give a particular phylogeographic pattern, some general trends seems to appear. First, populations of A. draco and A. latronum from the Yunnan (southern China) appear to be highly divergent from those from the other regions (Fig. 3A, B). Second, the same trend is also observed for the populations from the Sichuan (central China) (A. draco, A. latronum, and A. peninsulae) or the eastern part of China (A. draco, A. agrarius) (Fig. 3). Finally, particular lineages appear to be also present in A. agrarius and A. peninsulae from the Russian Far East (Fig. 3).
These results suggest that the above regions could correspond to refuge areas for the field mice. Other factors appears to corroborate this hypothesis. Indeed, even if at least three glaciations were detected in the south-western Chinese Plateau (comprising the Sichuan and Yunnan), the ice cover could have been permanent during these periods only in the higher altitude and central regions of the Tibetan Plateau (Shi, Zheng & Li, 1990). Therefore, some areas located in the eastern margin of this plateau were free of ice cover or less covered by ice (Shi, 1996) and would have provided suitable refugia for temperate species. Alpine meadow and grassland could have extended in these regions during the extensive glaciation periods (Liu et al., 2004). This is probably why many relict floras of the Tertiary still survive in these areas that are considered as a refuge for temperate and subtropical floras (Zheng & Liu, 1995). Moreover, the eastern regions were also proposed as refuges for temperate and tropical–subtropical faunas during the Quater-nary cold stages (Zhang, 2004; Zhang et al., 2009). For example, pikas (Ochotona spp.) survived in these regions (Li, 1986), providing indirect evidence for the occurrence of eastern refugia.
According to the present data, two main phylo-geographic patterns can be observed among the four studied species of field mice:
• A phylogeographic history of Chinese endemics. This pattern is observed in A. latronum and A. draco. Indeed, their particular ecological habits, adapted to subtropical or temperate forests appear
to have allowed these species to colonize neither the western mountainous Chinese regions, nor north-east China, nor the Russian Far East. There-fore, they appear to have evolved for several million years in regions covering central, southern, and eastern China.
• A phylogeographic history covering not only China, but also the Russian Far East, southern Siberia, and Central Asia. This pattern is observed in A. agrarius and A. peninsulae. Indeed, their more generalist ecology, adapted to forest but also open habitats (steppe regions), probably allowed these species to colonize broader distributions areas and survive there.
These two patterns will be developed below.
PHYLOGEOGRAPHY OF ENDEMIC CHINESE SPECIES
(A. LATRONUM ANDA. DRACO)
Apodemus draco
Six main lineages widespread in different Chinese regions (Sichuan, Yunnan, Beijing region, and the Eastern Pacific coast) were demonstrated in A. draco (Fig. 3B). This complex phylogeographic structure is probably the result of past population fragmentations all over China, which could again be associated with early Quaternary glaciations. Indeed, the divergence time analyses gave an estimation of at least 1.5 Mya for the separation of the different lineages. The genetic differentiation of this species would therefore be much older than that of the other Chinese Apodemus species. The isolation of these lineages in different refuges that were probably localized in the south-western Chinese plateau and eastern China could have been enhanced by the presence of deep river valleys (Chang Jiang, Yalong Jiang, Wu Jiang) and the Hengduan Mountains (Li & Su, 1996) of southern and western China. Indeed, these could have acted as a barrier to gene flow for this species. The west–east boundary found in the present study also appears to exist for other organisms dispersed over China such as plants (e.g. D. versipellis; Qiu et al., 2009), birds (e.g. P. colchicus; Qu et al., 2009) or amphibians (e.g. P. nigro-maculata; Zhang et al., 2008). These species would have experienced the same continuous cooling periods and gene flow barrier through the Pleistocene.
The Yunnan-Guizhou plateau underwent gra-dual uplifting during the last million years, exhibiting topographical complexity and a variety of elevations and climates, ranging from tropical to arctic (Suzuki et al., 2003). Therefore, these particular topographies and climates may also have contributed to isolate some populations of A. draco, leading to the differen-tiation of particular lineages in this region (Fig. 3B). Such a scenario was already proposed to explain
the complex genetic differentiation observed on the montane frog Leptobrachium ailaonicum (Zhang et al., 2009).
The existence of two highly differentiated lineages in eastern coastal China (Fig. 3B) could be explained by the cyclic arid phases of the climate and the extension of the desert to the Pacific regions during the Quaternary cold phases (Zhou et al., 2004; Chen et al., 2008). These would have led to the isolation of populations in different coastal refuges, which later led to the differentiation of several A. draco genetic lineages. Indeed, eastern China is generally consid-ered as a territory having moister and warmer cli-mates, even during the Quaternary cold phases (Zhang et al., 2008). Such eastern refuges were also proposed for the black spotted frog (P. nigromaculata) (Zhang et al., 2008).
Finally, the isolation of the two Sichuan groups of A. draco from Zhongguo, Maerkang, and Baoxing (Fig. 3B) could be explained by the presence of deep river valleys isolating these Sichuan regions (Zhang et al., 2008). This isolation would have been particu-larly important during the Quaternary glaciations. This hypothesis of past isolation is corroborated by the divergence data analysis, which suggests a sepa-ration of the Sichuan populations from the eastern ones at least 1.5 Mya.
Apodemus latronum
The phylogeographic pattern observed in A. latronum demonstrated strong differentiated populations in the Sichuan and Yunnan regions (Fig. 3A). Similar to A. draco, this result could be explained by the pres-ence of many refuges in the south-western Chinese Plateau (Song et al., 2009; Zhang et al., 2009), which would have played an important role for the genetic differentiation of this Apodemus species. This hypoth-esis was already set forth to explain the important geographical structure of the tree Juniperus przewal-skii (Cupressaceae) endemic to the Tibetan Plateau (Zhang et al., 2005).
Moreover, the animals from Yushu (Qinghai prov-ince) appeared to be strongly linked to the Yunnan ones (Fig. 3A), suggesting gene flow between these two regions, although they are separated by several hundred kilometres. This suggests that field mice could cross these mountainous regions, probably through the valleys systems (e.g. the Chang Yangtze River).
Similar to A. draco, the high level of nucleotide diversity observed in Sichuan and Yunnan suggests that these regions could represent a refuge for A. latronum. This result is corroborated by the mis-match distribution analysis suggesting that the popu-lations from Yushu Qinghai and Yunnan are stable. It reinforces the hypothesis of the south-western
Chinese region as an important refuge for many organisms (Zheng & Liu, 1995; Zhang, 2004; Zhang et al., 2009). This information is of prime interest from a conservation point of view.
PHYLOGEOGRAPHY OF THEASIANFAREAST SPECIES:
A. AGRARIUS AND A.PENINSULAE
Apodemus agrarius
Apodemus agrarius showed a very complex genetic structure in the studied regions. China, the Russian Far East, and Korea appear to represent important centres of diversification for this species because no less than 12 different genetic lineages were found within these regions.
As suggested by the divergence time analyses, this diversification could be the result of the isolation of several populations during the Quaternary ice ages leading to allopatric differentiation processes.
The cooler climate periods allowed the extension of the Gobi desert to the Pacific areas and probably led to the isolation of the Russian Far East (Primorye and Khabarovsk regions), as well as of the Korean peninsula populations (Harrison et al., 2001; Zhou et al., 2004; Zhang et al., 2008). This last region, char-acterized by south temperate mountain climate, was not deeply affected by the global Quaternary climate changes (Liu & Li, 1996) and therefore could have allowed many organisms to survive, even during the coldest phases. Some morphological (Jones & Johnson, 1965) and genetic studies (Koh et al., 1999) have suggested that the striped field mice from the Korean peninsula could be differentiated from the other Far East populations, and they were proposed as two particular subspecies: Apodemus agrarius pallescens in South Korea and Apodemus agrarius corea in central Korea. The results of the present study tend to confirm this hypothesis because the studied animals appear to be isolated in two different lineages separated by at least four mutational steps (Fig. 2D). According to Zhou et al. (2004), the exten-sion of the arid zones during the ice ages was prob-ably linked to an important discordant state of the mode of monsoons. Such an isolation of populations from the Korean peninsula was also observed on the black spotted frog (Pelophylax nigromaculata) (Zhang et al., 2008).
The Russian Far East could have also been a poten-tial refuge for A. agrarius. This result is corroborated by the high values of genetic, haplotype, and nucle-otide diversities (Table 2), as well as by the mismatch distribution and Fu’s FS indices.
The same tendencies (Table 2) were observed in China, suggesting that this region was probably also a refuge for the striped field mouse during the Quaternary glaciations, similar to A. draco and A.
latronum. This result is corroborated by the mis-match distribution and Fu’s FS analyses suggesting
stable A. agrarius populations that did not suffer from recent bottlenecks within this region. However, our sampling does not allow to locate the Chinese refuges precisely and clearly. These hypotheses follow the results obtained in other studies carried out on the Asian Apodemus species (Suzuki et al., 2003).
Recent fragmentation of A. agrarius
The distribution area of A. agrarius is divided into two main and geographically well isolated parts. The first one corresponds to China and the Russian Far East (group 1) and the other comprises a large region, starting from the western part of the Baikal Lake to Central Europe (group 2).
There are important questions concerning the genetic relationships between populations of these two distribution ranges: Are these populations geneti-cally related with frequent gene flow between them or have they been separated for a long time? What is the region of origin of A. agrarius? What are demographic histories of these population groups?
Our results demonstrate a closer relationship between the central–western Palearctic populations (group 2) and those from the Russian Far East com-pared to animals from China (Fig. 3D). Moreover, the levels of nucleotide and haplotype diversities are sig-nificantly higher in group 1 compared to populations from group 2. This result is similar to others previ-ously obtained using proteins and the random ampli-fication of polymorphic DNA-PCR method (Atopkin, Bogdanov & Chelomina, 2007). Demographic param-eters (mismatch distribution analyses, Fu’s FSindices)
also show that group 1 is characterized by a signal of stable populations, whereas group 2 corresponds more to populations that have recently expanded.
These combined data lead to the following scenario for the evolutionary history of A. agrarius: this species appeared approximately 5 Mya (Michaux et al., 2002; Suzuki et al., 2003) in the Asian Far East and probably in China (higher number of genetic lineages, higher genetic and nucleotide diversities, signal of stable populations). Subsequently, it could have colonized other extreme East Asian areas, such as Ussuriland (Russian Far East) (important relationships between populations of these two regions). Approximately 175 000–190 000 years ago, A. agrarius was able to colonize the Central Palearc-tic region, probably via Russian Far East populations. Indeed, the network demonstrates closer relation-ships between these latter populations. Moreover, as observed in several other organisms (Stakel, 1998), a western colonization via the Chinese striped field mice is very unlikely because this region is
sur-rounded by important biogeographic barriers, such as the Himalayan Mountains or the Gobi desert (Fig. 3D).
Finally, the low levels of genetic and nucleotide diversities as well as the signal of recent expansion observed in the mismatch distribution analysis, suggest that the central–western Palearctic popula-tions expanded relatively recently.
This scenario must however be confirmed by studies on larger sets of specimens, particularly from the western part of the striped field mouse distribution area.
Phylogeographic structure of A. peninsulae
The results obtained demonstrate an important level of genetic diversity for the Chinese populations (two main lineages, high levels of genetic and nucleotide diversities). Similar to the other Apodemus species, this result suggests that China was a refuge for A. peninsulae.
The Korean populations appear to be closely related to the central Chinese animals, suggesting frequent gene flow between populations from these regions (Fig. 3C). By contrast, the Korean animals appear to be highly differentiated from the Russian Far East popu-lations (Fig. 3C). This latter result is in agreement with previous molecular (Serizawa et al., 2002) and paleogeographical data (Tsukada, 1985; Nazarenko, 1990) and is quite surprising because these last two regions are geographically very close compared to China. The study of a larger number of specimens from this area will probably help to better understand this particular genetic structure.
As already observed for A. agrarius, Eastern Russia and Siberia could also have been refuge areas for A. peninsulae. This result is corroborated by the high values of nucleotide diversities evidenced in these regions.
The Japanese animals appear to be closely related to populations from the Russian Far East and are characterized by a very low level of genetic and nucle-otide diversities. This result was already reported in other studies (Pavlenko, 1989, 1994a,b; Serizawa et al., 2000, 2002). It may be explained by a recent colonization of Japan by a reduced number of coloniz-ers probably originating from a single refuge located in Eastern Russia (Pavlenko, 1989, 1994a,b). This colonization would have been favoured by the appear-ance of land bridges between continental Asia and the Japanese archipelago during the last Quaternary cold phases (Chinzey & Machida, 2001). A similar phylo-geographic pattern has been described for the costal tiger beetle (Satoh et al., 2004), termites (Park et al., 2006), the red fox (Tsuda et al., 1997), the sable (Martes zibellina) (Hosoda et al., 1999), and the flying squirrel (Pteromys volans) (Oshida et al., 2005).
Finally, the important genetic homogeneity between populations from the Russian Far East, southern Siberia, and central Asia strongly suggests that A. peninsulae may have colonized southern Siberia in the same way as A. agrarius (i.e. via Far eastern Russia). This colonization pattern could be explained by the same factors as for those of A. agrarius and, particularly, the important biogeo-graphic barriers isolating China in the west and in the north. The isolation of Chinese populations of A. peninsulae was already suggested by Serizawa et al. (2002) who proposed two subspecific levels for this species in the mainland part of East Asia: A. P. peninsulae in Korea, Manchuria and eastern Siberia and A. P. sowerbyi in central China.
CONCLUSIONS
The present study demonstrated the existence of an important geographic structure of the genetic vari-ability within each of the studied Apodemus species. This genetic differentiation could be linked not only to the cold and dry climates that characterized the Qua-ternary period in the Asian Far East, but also to the particular complex geology and topography of China and the Russian Far East.
In light of these results, China and, more generally, the Far East regions appear to be an important centre of diversification for the Apodemus species and a hot spot of biodiversity for this group of rodents, and probably for several hundreds of mammal species that occur there (Myers et al., 2000; Wu et al., 2000; Yu et al., 2000; CI, 2007).
ACKNOWLEDGEMENTS
This work was supported by grants from the Islamic Development Bank (Reference: FN: 24/TUN-05/PD26) and from the Tunisian Ministère de l’Enseignement Supérieur et de la Recherche Scientifique et de la Technologie (Projet LabB02). The authors would like to thank Professor Marrakchi Mohamed, director of the Laboratory of Molecular Genetics, Immunology and Biotechnology (who died on 2 April 2008) for his help and fruitful advice. Particular thanks are also extended to Mr Sylvain Piry for the creation of topo-graphic maps. We would also like to thank Jeremy Jacobs from the Museum of Washington for providing Apodemus samples. Finally, we thank Ms Marie Britton for correction of the English. This publica-tion has been funded under the EU Sixth Framework Program for Research, Technological Develop-ment and Demonstration, Priority 1.1.6.3. Global Change and Ecosystems (European Commission, DG Research, GOCE-CT-2003-010284 EDEN) and is offi-cially catalogued by the EDEN Steering Committee as
EDENxxx. The content of this paper does not represent the official position of the European Commission and is entirely under the authors’ responsibility. This work was also supported by a Belgian FNRS fellowship granted to J. R. Michaux (mandat chercheur qualifié). The research described was supported by Grant Number RO1 TW001565 from the Fogarty Interna-tional Centre (the content is solely the authors’ respon-sibility and does not necessarily represent the official views of the Fogarty International Centre or of the National Institutes of Health), the European Union (TS3-CT94-0270) and the French–Chinese Programme of Advanced Research (PRA E95-01). These pro-grammes have been coordinated by P. Giraudoux and F. Raould, University of Franche-Comté, France. The collecting of samples in Russia and Kazakhstan was also supported by the Russian Foundation for Basic Research (Grants Numbers 06-04-48969, 04-48001, 06-04-49575, 08-04-00937); the Program of Russian Academy of Sciences ‘Dynamics of gene pools of plants, animals and man’; and also by a grant from The Far Eastern Branch, Russian Academy of Sciences (Project 07-III- -06-048).
REFERENCES
Aguilar JP, Michaux J. 1996. The beginning of the age of Muridae (Mammalia: Rodentia) in southern France. Acta Zoologica Cracoviensa 3: 35–45.
Atopkin DM, Bogdanov AS, Chelomina GN. 2007. Genetic variation and differentiation in striped field mouse Apode-mus agrarius inferred from RAPD-PCR analysis. Russian Journal of Genetics 43: 665–676.
Aubry KB, Statham MJ, Sacks BN, Perrine JD, Wisely SM. 2009. Phylogeography of the North American red fox: vicariance in Pleistocene forest refugia. Molecular Ecology 18: 2668–2686.
Avise JC. 1994. Molecular markers, natural history and evo-lution. New York, NY: Chapman and Hall.
Avise JC. 2000. Phylogeography. The history and formation of species. Cambridge, MA: Harvard University Press. Axelrod DI, Ai-Shehbaz I, Raven PH. 1996. History of the
modern flora of China. In: Zhang AL, Wu SC, eds. Floristic characteristics and diversity of East Asian plants. Beijing: China Higher Education Press/Springer, 43–55.
Bandelt HJ, Forster P, Röhl A. 1999. Median-joining net-works for inferring intraspecific phylogenies. Molecular Biology and Evolution 16: 37–48.
Cabanne GS, d’Horta FM, Sari EH, Santos FR, Miyaki CY. 2008. Nuclear and mitochondrial phylogeography of the Atlantic forest endemic Xiphorhynchus fuscus (Aves: Dendrocolaptidae): biogeography and systematics implica-tions. Molecular Phylogenetics and Evolution 49: 760–773.
Carini G, Hughes JM. 2006. Subdivided population
structure and phylogeography of an endangered freshwater snail, Notopala sublineata (Conrad, 1850) (Gastropoda:
Viviparidae), in Western Queensland, Australia. Biological Journal of the Linnean Society 88: 1–16.
Chen K, Abbott RJ, Milne RI, Tian X-M, Liu J. 2008. Phylogeography of Pinus tabulaeformis Carr. (Pinaceae), a dominant species of coniferous forest in northern China. Molecular Ecology 17: 4276–4288.
Chinzey H, Machida H. 2001. Landform evolution of Japan. In: Yonekura N, Kaizuka S, Nogami M, Chinzei K, eds. Introduction to Japanese geomorphology. Tokyo: University of Tokyo Press, 297–322. (In Japanese).
CI (Conservation International). 2007. Biodiversity
hotspots. Available at http://www.biodiversityhotspots.org/ xp/Hotspots/indo-burma/pages/defaults.aspx
Corbet GB. 1978. The mammals of the Palaearctic Region: a taxonomic review. London and Ithaca, NY: British Museum (Natural History) and Cornell University Press.
Corbet GB, Hill JE. 1992. The mammals of the Indomalayan Region: a systematic review. London: Oxford University Press.
Da Silva MN, Patton JL. 1998. Molecular phylogeography and the evolution and conservation of Amazonian mammals. Molecular Ecology 7: 475–486.
Driscoll CA, Yamaguchi N, Bar-Gal GK, Roca AL, Luo S, Macdonald DW, O’Brien SJ. 2009. Mitochondrial phylo-geography illuminates the origin of the extinct caspian tiger and its relationship to the amur tiger. PLoS One 4: 4125. Duan Z, Zhao K, Peng Z, Li J, Diogo R, Zhao X, He S.
2009. Comparative phylogeography of the Yellow River schizothoracine fishes (Cyprinidae): vicariance, expansion, and recent coalescence in response to the Quaternary envi-ronmental upheaval in the Tibetan Plateau. Molecular Phy-logenetics and Evolution 53: 1025–1031.
Dubey S, Cosson JF, Magnanou E, Vohralik V, Benda P, Frynta D, Hutterer R, Vogel V, Vogel P. 2006. Mediter-ranean populations of the lesser white-toothed shrew (Crocidura suaveolens group): an unexpected puzzle of Pleis-tocene survivors and prehistoric introductions. Molecular Ecology 16: 3438–3452.
Edwards SV. 1997. Relevance of microevolutionary process to higher level molecular systematics. In: Mindell DP, ed. Avian molecular evolutionary systematics. New York, NY: Academic Press, 251–278.
Felsenstein J. 1985. Confidence limits on phylogenies: an approach using the bootstrap. Evolution 39: 783–791. Fitch WM. 1971. Towards defining the course of evolution:
minimum change for a specific tree topology. Systematic Zoology 20: 406–416.
Fu YX. 1997. Statistical tests of neutrality of mutations against population growth, hitchhiking and background selection. Genetics 147: 915–925.
Funk WC, Pearl CA, Draheim HM, Adams MJ, Mullins TD, Haig SM. 2008. Range-wide phylogeographic analysis of the spotted frog complex (Rana luteiventris and Rana pretiosa) in northwestern North America. Molecular Phylo-genetics and Evolution 49: 198–210.
Giraudoux P, Zhou H, Quéré JP, Raoul F, Delattre P, Volobouev V, Déforêt T, Ito A, Mamuti W, Scheifler R, Craig PS. 2008. Small mammal assemblages and habitat