a new tool to prevent bankruptcy ?
Authors :
Van Caillie Didier, Associate Professor, School of Business Administration, University of Liège (Belgium)
Dighaye Andrée, Research Assistant, School of Business Administration, University of Liège (Belgium)
Paper presented at the European Accounting Association Congress, Copenhagen (Denmark), 25th – 27th April 2002
Contact and correspondence :
Prof. D. Van Caillie, School of Business Administration, University of Liège Boulevard du Rectorat, 7 - B 31 - Bte 53 - 4000 Liège (Belgium)
The concept of "Economic Added Result",
a new tool to prevent bankruptcy ?
ABSTRACT
Business failure has been one of the most investigated topics in the finance and the strategic literature during the last seven decades. However, most of this literature has been heavily focused on business failure prediction (with a clear focus on short-term prediction) and, simultaneously, only a few studies have investigated business failure prevention, focusing on understanding how a company may fail through "failure paths" and on the identification of very early warning financial and non-financial signals and symptoms.
This may be explained by a conceptual difficulty to exactly represent what business failure prevention may mean and by a practical difficulty to build a financial indicator really allowing to announce a bankruptcy at least three years or more in advance, giving then time to potential corporate recovery.
With this paper, we then propose an investigation of this concept of "Business Failure Prevention" and we test on a sample of 6 250 Belgian SMEs the ability of a specific financial indicator (referred as "Economic Added Result" and based on the amount of accounting value added which remains within a company when it has paid for its internal and external production factors) to effectively predict a business failure at least three years before it happens.
KEYWORDS
Business Failure, Bankruptcy Prediction, Bankruptcy Prevention, Financial Statement Analysis, Failure Path, Added Result
1. INTRODUCTION
Since the Fitz Patrick's (1932) early papers, business failure has been one of the most investigated topics in the finance and the strategic literature. However, most of this literature has been heavily focused on business failure prediction (with a clear focus on short-term prediction) and, simultaneously, only a few studies have investigated business failure prevention, focusing on understanding how a company may fail through "Failure Paths" (Argenti, 1976) and on the identification of very early warning financial and non-financial signals and symptoms.
This may be explained by a conceptual difficulty to exactly represent what business failure prevention may mean and by a practical difficulty to build a financial indicator really announcing a bankruptcy three years or more in advance, allowing then to build a true prevention and recovery strategy.
With this paper, we first propose an investigation of this concept of "Business Failure Prevention", showing why business failure prediction has up to now dominated all the specialized literature and how the multiple elements characterizing both the “financial view” and the “organizational view” of business failure processes may be organized to efficiently build effective corporate recovery strategies. We then deduct the optimal characteristics of an ideal theoretical financial indicator allowing to effectively detect in the long term any business failure risk and we test on a sample of 6 250 Belgian SMEs the ability of a specific financial indicator (referred as "Economic Added Result" and based on the amount of accounting value added which remains within a company when it has paid for its internal and external production factors) to effectively predict a business failure at least three years before it happens.
2. FROM BUSINESS FAILURE PREDICTION TO BUSINESS FAILURE PREVENTION : A CRITICAL LOOK AT THE LITERATURE
2.1. Business failure prediction : the reasons of a success
As stated by Morris (1997), the reasons explaining why business failure has become one of the most investigated topics, both in the finance and in the strategic literature, may be found both at an economic level and at a technical one :
1. First, economically, corporate (under)performance (and its origin) became one of the most investigated topics due to the progressive emergence of an extremely fast moving environment that disturbed the conditions in which most companies had generated relatively constant and high rates of return for a long period (Kaplan, Norton, 1996) (Copeland e.a., 2000) ; as a result, due to the magnitude of its external consequences on global employment and on economic regional welfare, financial and organizational business decline perceived more and more attention from both researchers and economic authorities (Morris, 1997).
2. Second, technically, an increased availability of credible data derived from financial statements published by an ever-growing number of companies, coupled with a strong development in mathematical and statistical techniques and an exponential evolution of informatics, has resulted in a strong and steady flow of accounting quantitative researches exploring this appealing "Business Failure" theme (Dimitras e.a., 1996).
Methodologically, this has had two disturbing consequences :
- First, most of these quantitative studies suffer from an intrinsic "statistical bias", focusing on the ability of some techniques to correctly predict business failure one to five years prior a legal bankruptcy and considering almost
systematically (and often implicitly) that managers were deterministically unaware of the problems their companies face and unable to take corrective decisions ; so, attention was excessively focused on the technical aspects of business failure prediction, neglecting a more explanatory effort nevertheless necessary to take efficient preventive and recovey actions (Koenig, 1985).
- Second, insidiously, most of these studies focus on (very) short-term business failure prediction due to the high classification performance of most near-to-failure models ; indeed, taking generally into account as a dependent variable a variable based on a legal and official statement of bankrupcty (Ooghe, Van Wymeersch, 1996), most of these studies emphasize the role of many solvency and liquidity variables as explaining or announcing business failure, while at the same time these two dimensions are explicitly integrated in most legislations into the legal definition of bankruptcy 1. De facto, these models
tend thus to explain business failure by the two factors that are included in its legal definition, inducing so a strong growth in the predictive power of short-term models … and a poor relevant information to effectively prevent very early a potential bankruptcy .
Fundamentally, business failure was then too often reported as an almost discrete event due to "mismanagement" and companies were frequently considered as "black boxes" moving in the hands of their environment and their stakeholders (Altman, 1984) (Morris, 1997).
Simultaneously, only a few studies (Argenti, 1976) (Keasey, Watson, 1991) (Laitinen, 1991) (Sharma, Mahajan, 1980) have considered business failure as a dynamic process :
- characterized by a progressive but systematic deterioration in the values of some specific ratios (Laitinen, 1991) (Van Wymeersch, Wolfs, 1996) reflecting a deterioration in the effectiveness of some internal management processes within the company,
- and, above all, a process on which managers may act with some judicious strategic decisions and characterized by many potential business failure patterns (frequently referred as "Failure Paths") made of a sequence of multiple successive and integrated events (Argenti, 1976) (Koenig, 1985) (Morris, 1997) (Ooghe, Van Wymeersch, 1996).
In fact, as stated by Dimitras e.a. (1996), "a unifying theory of business failure has not been developed, in spite of a few notable efforts" which were materialized in a steady flow of many hundred papers, each of them being contingent on two complementary (but very rarely associated) dimensions :
- a financial view of business failure (logically mainly present in the finance or the accounting literature)
- and an organizational one (mainly present in the strategic literature) (Hansen, Wernerfelt, 1989) (Morris, 1997).
2.2. The dominant views of business failure research
Most reviews of the literature, either global (Altman, 1996) (Dimitras e.a., 1996) (Guilhot, 2000) (Morris, 1997) (Ooghe e.a., 1995) (Zavgren, 1983) or SMEs-oriented (Berryman, 1983) (Keasey, Watson, 1991), show that :
- conceptual papers and empirical researches take essentially into account a financial vision of business failure from an outsider's or external viewpoint : this may be explained by an easier access to data (financial data, especially in biggest companies, are frequently audited and largely published, so easily available and
credible) (Morris, 1998) and by the fact that most of these studies, largely financed by banks or financial institutions, are consequently and logically focused more on an external credit-risk perspective than on a managerial one (business failure prediction with a short-term horizon is then privileged, while business failure prevention with a long term perspective is generally neglected) ;
- when focusing on an internal and organizational viewpoint, the most important explanatory factors of corporate collapse have to be found inside the company, both (and essentially) in the personnality of its manager(s)/founder(s) and in the inappropriate management processes implemented within the company.
2.2.1. The core results of the financial view of business failure
Two authors, Beaver (1966) and Altman (1968), play undoubtedly an invaluable role in the elaboration of a true conceptual financial framework allowing to understand how a company enters in a failing path and propose two complementary approaches : - The "funds flows approach" developed by Beaver (1966) considers the firm as a
reservoir of cash, which is drained by operations and capital expenditures and is fuelled by revenues from operations : if this reservoir is initially too small due to undercapitalization and / or if cash drains are far more important than cash gains, then the firm goes bankrupt. Insufficient cash flow (especially when reported to debts) and a weak liquidity position are then, in an univariate perspective, the essential drivers explaining the evolution through a failure process.
- The multivariate approach developed by Altman (1968), who is the first to use a specific multivariate data analysis technique (i.e. discriminant analysis) to determine which combination of financial factors differentiate at best bankrupt and non-bankrupt firms, supposes that business failure results from a conjunction of different phenomenons linked to solvency, liquidity, profitability and assets
turnover in the firm, each of them influencing partially the complete business failure process. But no assumption is made as for which is the first phenomenon to cause the beginning of a failing path (Slatter, 1984) and the emphasis is put on the short-term predictive ability of this model.
Most of the papers published since these two fundamental works have only refined this conceptual framework or have focused on the application of new statistical or mathematical tools to the problem of bankruptcy prediction (Dimitras e.a., 1996) (Altman, 1984) ; generally, most of them have validated the models proposed by Beaver and Altman, so that it's reasonable to consider that :
- financial business failure is the result of a conjunction of a liquidity, a solvency and a profitability position rapidly degrading ; however, despite the existence of some financial "failure paths" illustrating how these factors may interact and succeed one another (such as those proposed by Marco (1989) or Ooghe and Van Wymeersch (1996)), links between these positions have still to be refined in a longitudinal perspective ;
- the nearest the date of the legal statement of failure, the worst the liquidity and the solvency situation of the firm ; this is once again logically explained by the fact that most of the national commercial legislations define corporate bankruptcy as resulting exclusively from both insolvency and absence of liquidity (Ooghe, Van Wymeersch, 1996) ;
- three alternative types of financial failure processes are emerging (Laitinen, 1991) (Ooghe, Van Wymeersch, 1996) :
o the first type is ‘a chronic failure firm’ where “almost all financial ratios are poor already in the fourth year before failure” (Laitinen, 1991),
o the second type is ‘a revenue financing failure firm’, “whose indebtedness and static liquidity were on an average level in every year before failure ; however, the sufficiency of revenue financing was rather low because of poor profitability and slow accumulation of revenues” (Laitinen, 1991),
o the third type was an ‘acute failure firm’ where almost all the financial ratios dramatically deteriorated in the first year before failure, without any other early warning signal.
2.2.2. The core results of the organizational view of business failure
Many authors confirm that business failure is contingent on both external (conjonctural) influences increasing economic uncertainty (and thus resulting in an increased corporate risk and vulnerability) and on internal factors, strongly linked to internal responsibilities inherent to any company (Koenig,1985) (Marco, 1989) (Morris, 1998) (Ooghe, Van Wymeersch, 1996).
This explains why, in an organizational view of the business failure process, many authors explore some of the internal organizational and entrepreneurial micro-aspects first depicted by Argenti (1976) as characterizing business decline. Most of these studies highlight the role of multiple and frequently extremely redundant explanatory factors that we may classify into three categories (Keasey, Watson, 1991) (Sharma, Mahajan, 1980) :
- Factors linked to the "corporate governance" system of the firm : The entrepreneur (especially in SMEs) or the Board of Directors (in more important firms where there is a clear separation between ownership and management of the firm) play a major role in the elaboration of the management processes implemented within any company ; their personality and their objectives are thus
strongly reflected in these management processes and a lack of technical ability, insufficient education, some weaknesses in management skills, a lack of motivation or of self-confidence or, on the contrary, too optimistic attitudes are then factors affecting rapidly the magnitude and the professionalism of these management processes which were highlighted as explaining many failure processes, especially in SMEs (Berryman, 1983) (Cromie, 1991).
- Factors linked to its strategic management and policy : An inadequate vision of the future of the company and inappropriate resulting strategies are also considered as explaining many bankruptcies : globally, strategic and long-term management appears to have received too few attention from managers at the top of failing companies (Sheppard, 1994), while at the same time the environment in which any company evolves is developing faster and is becoming more and more complex (Porter, 1985). So, a gap appears between the low magnitude of strategic actions and decisions in failing company and the requirements of an always more complex environment : a weak understanding of the complexity of this environment, the absence of innovating strategies, a lack of planning, a weak information system are, amongst others, factors depicted as critical to prevent bankruptcy (Robinson, Pearce, 1984). As for the relations between the failing firm and the major components of its environment (Sheppard, 1994), an intensive competition on the company's main markets, turnover depending excessively on one or a few failing clients, depending too much on some specialized suppliers, poor relations with the bank or the banker, a weak adequacy between the products developed and the requirements of investigated markets and a poor marketing plan are the reported main factors inducing a possible near bankrupt (Cromie, 1991) (Hall, Young, 1991) (Smallbone, 1990).
- Factors linked to its operational management : These factors are clearly the most investigated in the literature (Berryman, 1983) (Keasey, Watson, 1991) (Morris, 1997) : a poor daily management of operations and strong weaknesses in some critical operational functions (essentially finance and production functions) have largely been considered as the main explanatory factors that justify the death of a company. As examples (Hall, Young, 1991) (Cromie, 1991),
o a persistent lack of equities, excessive short-term borrowing, depending too much on bank credit and too few on commercial credit, a difficult access to credit and a weak bargaining position to negotiate the terms of this credit have been pointed out as major financial factors explaining bankruptcy ;
o difficulties to master and calibrate production process, having too much stocks, depending too much on suppliers to gain access to critical supplies or raw materials, difficulties to master lead times, weak or unstable quality of some products, too high production costs are also operational factors frequently underlined in the specialized literature ;
o and, at least, as for the general management process, depending too much on some key people, a lack of responsibility delegation and difficulties to develop human skills are the main factors that explain bankruptcy in many failing firms.
When analyzing and organizing all these multiple and extremely diversified organizational factors, it rapidly appears that any business failure process associated with the failure of a specific firm has its own organizational determinant factors, depending essentially on the nature of the corporate governance system implemented
(or not implemented) within the company and on the true characteristics of its particular environment, making then extremely difficult and not really relevant the elaboration of organizational typologies highlighting the most typical business failure processes in order to build preventive policies or strategies.
In this context, due the elaboration of preventive strategies seems then to have to be rooted preferably in a (more normative) financial view of the business failure phenomenon.
2.3. From business failure prediction to business failure prevention : a missing link ?
As stated in Section 2.2.1., current finance or accounting literature doesn’t really allow for such a focus on long-term business failure risk detection. As stated by Ooghe e.a. (1995), “to improve the predictive ability of the models, one might examine the existence of alternative failure processes. This means that there is a difference in the behavior of the financial ratios prior to failing for each process. Identifying these processes will make it possible to develop models with higher performance for the alternative types of failure processes or to increase the prediction power of the model by taking into account the frequency of each failure process” (Laitinen, 1991) (Ooghe e.a., 1995).
Research on corporate failure is then controntated with a methodological problem : there is a large variety of failing paths, each of them being characterized by a large diversity of organizational factors and as a result by different combinations of relevant ratios reflecting defects in these organizational factors. But, up to now, researchers don't have elaborated a single indicator, explicitly focused on very early warning financial determinants announcing a potential business failure and allowing to measure how fast a company is evolving towards a fatal failure, despite its failure
path : as stated by Laitinen (1991), in business failure research, “the selection of financial ratios is generally left as an empirical question and financial ratios are rarely used to test hypotheses and theories of economic and financial behaviour”, so that researchers are confrontated with a “missing link” really allowing to move from a largely explored business failure prediction perspective towards a more promising business failure prevention perspective.
3. A CONCEPTUAL FRAMEWORK TO MASTER THE CONCEPT OF BUSINESS FAILURE PREVENTION
3.1. From the concept of “Business Failure Prevention” to the concept of “Economic Added Result”
In order to prevent business failure, it is first necessary to clearly define what is a failing company. Many authors have proposed similar or very close definitions :
- Altman (1971) considers that a company is failing when its profitability is significantly and constantly less than what can be observed in similar circumstances : so, business failure comes from the inability of the firm to generate on a long run a profitability at least comparable with the profitability generated by its competitors ;
- Koenig (1985) considers that a failing firm is suffering from an absence of liquidity resulting from an economic inefficiency and thus from a weak profitability : once again, a strong link between liquidity and profitability is established, as well as an explicit reference to the economic environment of the firm ;
- at least, Ooghe and Van Wymeersch (1996) consider that a company is failing when it is unable to create a strong and steady flow of value added
over time, allowing it to pay at least at the market price for the different internal production factors effectively used.
If we confront these definitions with the lessons gained from the organizational view of the business failure process described in Section 2.2.2. and with the concept of “Value Added” such as described by Porter (1985), including its progressive creation through the value chain of the firm, literature suggests then that a firm is economically failing (and thus, as a result, financially and potentially legally failing) when it doesn’t generate, on a steady and continuous basis, an amount of value added sufficient to pay at least at the market price for all the producive factors used, both internal (the different assignments for value added, such as labor, equipment and its amortization, cost of financial resources, taxes, know-how, …) or external (goods and furnitures, external know-how, …, of which cost reduces the value added generated within the company).
3.1.1. Definition of the concept
So a clear concept emerges from this definition of a failing firm : this concept refers to the amount of Value Added (= Turnover less Cost of Purchases and Cost of Furnitures and External Resources & Know-How) remaining available within a company when it has paid at an economically fair price (= at the market price if markets are perfect) for its internal production factors or resources left at its disposal (Labor, Capital, Equipment and Infrastructure). This concept may then be referred as the “Economic Added Result” created by a firm due to its operations, after having paid correctly all its producive factors : a company that doesn’t create a steady and continuous Economic Added Result (EAR), either due to mismanagement or to inadequacy of its products with the requirements of its markets, is then a firm which
is economically failing and, on the contrary, the more important this EAR, the more efficient the company.
3.1.2. Limits of the concept
This theoretical concept presents unhappily some limits that prevent an easy empirical use :
- it is based on an explicit reference to the market price to pay for the use of the different production factors : so, it implies implicitly that this price gives a true and fair value for the use of these factors (which is not the case if markets present some imperfections) and, empirically, it is necessary, when using external financial data to implement this concept, to use a proxy, the “Accounting Added Result”, based on the strong hypothese that accounting information reflects at best a true and fair view of the cost of these internal resources 2 ;
- to be fully significant and to give a true representation of the efficiency with which a company uses its assets, this amount ought still to be compared to the amount of total assets ; the concept of “Economic Added Result / Total Assets” (EARTA) appears then :
o it allows to integrate, especially in a longitudinal perspective (inherent to any business risk prevention perspective), the evolution of the size of the company, induced both by its internal strategic intents (such as growth or corporate restructuration) and by external factors (such as pressure from industry and/or market or technological innovation)
o it allows comparison between companies with different sizes (and this aspect of benchmarking is explicitly taken into account in the definitions of “business failure” presented above)
3.1.2. Conceptual interest of the concept
Two main reasons justify essentially the conceptual interest of this “Economic Added Result” concept :
- Firstly, it is strongly linked to the value added created by a company, and, as stated by Ooghe e.a. (1995), “because of the important economic significance of the value-added concept, value-added ratios provide much information” which remains largely unexplored in the business failure literature, while “a firm is in serious trouble when its costs cannot be covered (the firm is unable to create enough value added)” ; so, “by analyzing the components of the value added, one gets insight into certain (dis-)proportions in costs : personnel charges, debt charges, and depreciation” especially.
- Secondly, while derived from the value added by the firm (which is thus at the origin of its economic survival), this concept is also largely independent from the solvency and the liquidity perspectives that are explicitly taken into account in the legal statement of business failure : so, this concept appears to be close to the economic definition of business failure and relatively far from its legal definition, getting then a double characteristic that makes it attractive in a (long-term) prevention perspective.
Furthermore, more empirically, Van Wymeersch and Wolfs (1996) state a significant decrease in value added in failing firms, both in Belgian industrial and commercial firms, up to five years before bankruptcy, inducing that fixed costs (i.e. labor costs and financial expenses) represent an extremely large proportion of this value added. Moreover, economic added result appears to be significatively discriminant as soon as five years before legal failure.
3.2. Research questions
To test empirically the interest of the concept of “Economic Added Result” in a business failure risk prevention perspective, it seems coherent to test four research questions :
1. Is business failure risk really predictable with some early warning indicator ? Thus, is business failure risk stable over time, allowing then to build effective and efficient prevention strategies ?
2. Are EAR and EARTA really announcing business failure risk up to three years in advance and thus are they indicators allowing to implement recovery strategies in companies with low EAR or EARTA ?
3. If so, do the concepts of “Economic Added Result” (EAR) and of “Economic Added Result / Total Assets” (EARTA) contain the same information ?
4. Are they redundant with information provided by the amount of Value Added generated by the company or by its Rate of Value Added (= Value Added / Turnover) ?
3.3. Research methodology 3.3.1. Population
Due to the importance of the business failure phenomenon in this type of firms in Belgium (Ooghe e.a., 1995) (Ooghe, Van Wymeersch, 1996) and due to the importance of the impact of such a failure on local and regional economic development, our population is restricted to any SME employing between 10 and 250 people, being in going concern from 1995 to 1998 and delivering exhaustive and controlled financial statements to the National Bank of Belgium. This population contains 6.215 SMEs and is selected by using the following successive criteria :
- all private-owned companies, located somewhere in Belgium, and employing between 10 and 250 people in 1998, are first selected, a SME being defined as a private firm employing less than 250 people ;
- all companies delivering their financial data in a short format 3 in 1995, 1996,
1997 or 1998 are then excluded, to warranty comparability of data between firms and over time ;
- any company not delivering financial data in 1995, 1996, 1997 or 1998 is also excluded, to eliminate new firms of which behaviour is extremely specific (Storey, 1985), dead or almost dead companies of which accounts are not available or validated by the National Bank of Belgium, and restructuring companies that benefit from larger delays to deliver their accounts.
3.3.2. Measures
As early mentioned, the Belgian Bankrupcty Act is based on the liquidity and solvency aspects, which are coupled in the legal statement of “Business Failure” : but, as information on legal failures is frequently reported very lately and as many companies with illiquidity and insolvency problems are only declared as "legally failed" after a long time (due to the complexity of the bankrupcty legal procedure and to frequently long administrative and information procedures), it is necessary to use a specific indicator measuring the risk of legal failure.
This “Legal Failure Risk” indicator (LFR) is based on the joint use of the solvency ratio (Equity / Total Assets) and the quick ratio (liquidity ratio) :
- the values of these two ratios are first calculated, year by year, for each company in our sample,
- then they are ranked 4 respectively on these two variables,
- and the sum of these two resulting deciles is calculated to build our "Legal Failure Risk" indicator (LFR indicator).
So, companies are ranking from 2 (i.e. with a solvency classified in the worst decile for the solvency ratio and with a liquidity classified in the worst decile for the quick ratio) to 20 (i.e. with a solvency classified in the best decile for the solvency ratio and with a liquidity classified in the best decile for the quick ratio).
To really focus on the difference between failing and non-failing firms (Ooghe e.a., 1995), we classify then this indicator in a discrete ranked variable with five categories, ranging from the highest legal failure risk (with the lowest values of LFR) to the lowest legal failure risk (Risk = 1 when LFR = 2, 3, 4 or 5 , Risk = 2 when LFR = 6, 7, 8 or 9, Risk = 3 when LFR = 10, 11 or 12 (the median values), Risk = 4 when LFR = 13, 14, 15 or 16, Risk = 5 when LFR = 17, 18, 19 or 20) ; this new variable, called RISKnn, is then used to measure the Legal Failure Risk associated with each company for year nn and is calculated both in 1998 and three years before, in 1995.
We also compute the values of EAR (by using its accounting proxy defined in Note 2), the values of EARTA (as Economic Added Result / Total Assets), the volume of value added (VA = turnover – cost of purchases – cost of furnitures and external resources) and, at least, the rate of value added (RVA = Value Added / Turnover). All these values are calculated for each company in 1995, 1996, 1997 and 1998 ; to allow for a coherent statistical treatment, these values are then cross-sectionnally ranked and replaced by their deciles : each statistical series used in our results is thus classified into deciles.
3.4. Results and discussion
1. Is business failure risk really predictable with some early warning indicator ? Thus, is business failure risk stable over time, allowing then to build effective and efficient prevention strategies ?
To test this question, we analyze Table 1 (“Legal Failure Risk and its evolution on a 3-years period”) and we use a chi-square test to verify statistical independence between legal failure risk in 1995 and three years later (see Table 2).
The following facts emerge from this analysis :
- Legal failure risk in 95 and three years later are clearly dependent : especially, in more than 53.47 % of all the cases, the risk associated with a company is the same three years later (see the numbers on the diagonal) ; both the gamma coefficient as the Spearman rank test establish a strong link between LFR95 and LFR98, affecting almost 80 % of all the companies (see the value of the gamma coefficient 5 ).
- In 15 % of the cases, firms with an extremely high risk in 1995 succeeded in gaining new liquidities or bettering their solvency, so that they are associated with low legal failure risk three years laters (with a Risk98-level of 3 or more).
- Simultaneously, in 5 % of the cases only, firms with an extremely low risk in 1995 encountered strong risk (with a Risk98-level of 1 or 2 only) three years later.
- At least, about 25 % of firms are moving from one Risk-level to an other adjacent level between 1995 and 1998, either by worsening their position for the healthiest in 1995 or by bettering their position for the most risky.
As a result, legal failure risk appears to be extremely stable over time and potential evolution are ordinarily very slow ; so, legal failure risk being detectable at least
three years in advance, it appears reasonably feasible and efficient to search to build preventive strategies to impede business failure.
2. Are EAR and EARTA really announcing business failure risk up to three years in advance and thus are they indicators allowing to implement recovery strategies in companies with low EAR or EARTA ?
If we examine the last part of Table 4 (“Legal Failure Risk – Risk98 – and its determinants”), we state that :
- For each of the four years (1995, 1996, 1997 and 1998), there is a highly significant correlation 6 between the level of RISK98 and the level of both
EAR and EARTA : statistical series on the RISK98-level and the respective levels of EAR and EARTA present then a similar information and the concepts of “Economic Added Result” and of “Economic Added Result / Total Assets” appear then to be good predictors of future LFR-levels.
- Both EAR and EARTA present their higher level for the gamma coefficient in 1997, i.e. one-year before the measure of LFR, but, both for EAR and for EARTA, there is a clear volatility in the values of the gamma coefficient from year to year.
- If we consider then the average of the EAR values for the period 1995-1998 (respectively EARTA), if we rank this new value into deciles (variable EAR_M, respectively EARTA_M) and if we test its correlation with RISK98, we state at least a strong growth, both in the gamma coefficient as in the Pearson Chi-Square and this growth is especially high for EARTA, which appears then to be the best predictor for future LFR-level.
As a result, both EAR and EARTA appear to be good predictors of future LFR-level, especially when they are calculated as an average of values on a long term period (i.e. for a three-years period) ; such an indicator has indeed the advantage to erase any conjonctural or hazardous variation in the level of EAR or EARTA and to concentrate on the true ability of the firm to generate steady EAR-levels over time.
Furthermore, the mean of the EARTA indicator appears to be more efficient than the mean of the EAR indicator : this may be explained by the fact that this indicator integrates explicitly the size of the company in its calculation, what confirms the influence of the size as a major determinant of the business risk failure (Laitinen, 1991) (Ooghe e.a., 1995).
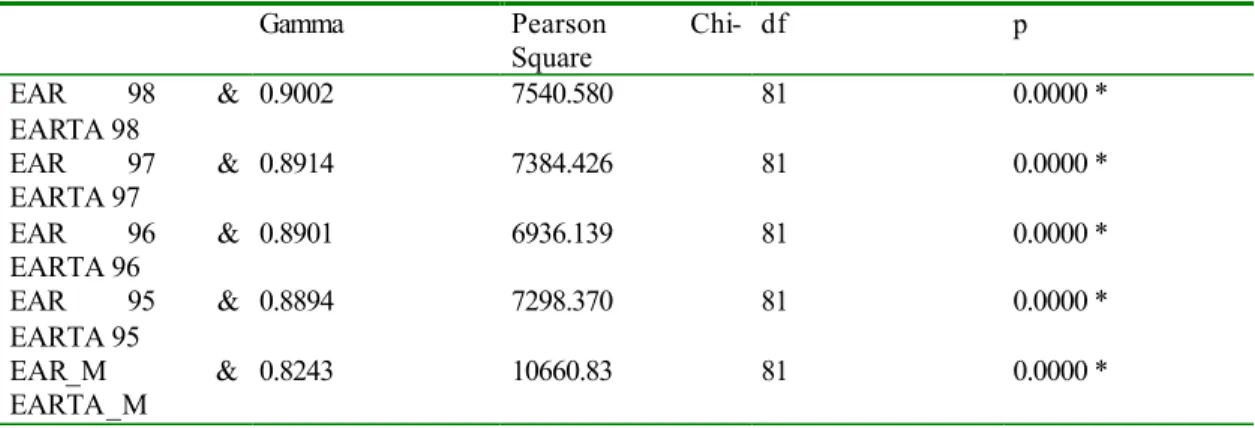
3. If so, do the concepts of “Economic Added Result” (EAR) and of “Economic Added Result / Total Assets” (EARTA) contain the same information ?
It results from Table 3 (“Gamma and Pearson Chi-Square for EAR and EARTA”) that :
- these two indicators are largely redundant from year to year ;
- however, when comparing the information reported in the mean of EAR and of EARTA respectively over the period, it also appears that these variables are still more redundant than the variables calculated from year to year (see the Pearson Chi-Square coefficient, almost 50 % higher than the annual Pearson coefficients) but also diverge largely for some cases (see the gamma coefficient, less than the annual gamma coefficients, showing then that listings on these two average variables are less redundant than comparable listings on these variables taken from year to year).
So, EAR and EARTA appear to be used essentially on an average basis, being calculated as an average on a long period and these two indicators appear to be largely convergent information, although sometimes completely divergent.
4. Are they redundant with information provided by the amount of Value Added generated by the company or by its Rate of Value Added (= Value Added / Turnover) ?
At least, it results from Table 4 that
- information resulting from the amount of Value Added generated from year to year is relatively independent from the level of LFR associated with a company, except one year before its measure : the concept of value added, which is however at the origin of the economic added result generated within a company, appears so to be unsufficient to completely integrate all the long-term fundamental aspects that determine business failure risk (due to the fact that this concept ignores the cost of the internal productive factors used within the company) ;
- information resulting from the rate of value added appears to be significantly linked to the LFR indicator, showing then the role of industry appartenance (which is one of the key determinants of the rate of value added (Porter, 1985)) as a determinant of the business failure risk. So, both value added and the rate of value added generated appear to be from a relatively weak utility when searching to anticipate as early as possible a potential legal failure and the use of the concepts of EAR or EARTA appear to be far more useful.
Business failure has clearly been one of the most investigated topics in the finance and the strategic literature during the last seven decades ; this literature has been heavily focused on business failure prediction (with a clear focus on short-term prediction) and, simultaneously, only a few studies have investigated business failure prevention, focusing on understanding how a company may fail through "failure paths" and on the identification of very early warning financial and non-financial signals and symptoms.
This may be explained by a conceptual difficulty to exactly represent what business failure prevention may mean and by a practical difficulty to build a financial indicator really allowing to announce a bankruptcy at least three years or more in advance, giving then time to potential corporate recovery.
In this paper, we have proposed an investigation of this concept of "Business Failure Prevention" and we have tested on a sample of 6 250 Belgian SMEs the ability of a specific financial indicator (referred as "Economic Added Result" and based on the amount of accounting value added which remains within a company when it has paid for its internal and external production factors) to effectively predict a business failure at least three years before it happens : it results from this study that this concept of Economic Added Result, especially when reported to Total Assets used in the firm and when calculated on a long-term period (i.e. three years in our study), appears to be both an efficient concept to understand why a company is failing and an efficient empirical tool to measure as early as possible the business failure risk associated to a company in the future.
APPENDIX
Table 1 : Legal Failure Risk and its evolution on a 3-years period
STAT. Summary Frequency Table (eaa - va.sta)
RISK95 RISK95 RISK95 RISK95 RISK95 Row RISK98 G_1:1 G_2:2 G_3:3 G_4:4 G_5:5 Totals G_1:1 453 209 71 30 11 774 Column % 59,06% 12,59% 4,61% 2,18% 1,26% Total % 7,29% 3,36% 1,14% ,48% ,18% 2,45% G_2:2 207 879 386 118 30 1620 Column % 26,99% 52,95% 25,08% 8,56% 3,45% Total % 3,33% 14,14% 6,21% 1,90% ,48% 6,07% G_3:3 65 394 686 326 74 1545 Column % 8,47% 23,73% 44,57% 23,64% 8,51% Total % 1,05% 6,34% 11,04% 5,25% 1,19% 4,86% G_4:4 35 154 322 673 216 1400 Column % 4,56% 9,28% 20,92% 48,80% 24,83% Total % ,56% 2,48% 5,18% 10,83% 3,48% 2,53% G_5:5 7 24 74 232 539 876 Column % ,91% 1,45% 4,81% 16,82% 61,95% Total % ,11% ,39% 1,19% 3,73% 8,67% 4,09% All Grps 767 1660 1539 1379 870 6215 Total % 12,34% 26,71% 24,76% 22,19% 14,00%
Table 2 : Independence test : Risk 95 * Risk 98
STAT. Statistics: RISK98(5) x RISK95(5) (eaa - va.sta)
BASIC STATS Statistic Chi-square df p Pearson Chi-square 5295,074 df=16 p=0,0000 M-L Chi-square 4419,940 df=16 p=0,0000
Kendall's tau b & c b=,6065893 c=,5942385
Gamma ,7382784
Spearman Rank R ,6897877 t=75,097 p=0,0000
Table 3 : Gamma & Pearson Chi-Square : EAR & EARTA
Gamma Pearson
Chi-Square df p EAR 98 & EARTA 98 0.9002 7540.580 81 0.0000 * EAR 97 & EARTA 97 0.8914 7384.426 81 0.0000 * EAR 96 & EARTA 96 0.8901 6936.139 81 0.0000 * EAR 95 & EARTA 95 0.8894 7298.370 81 0.0000 * EAR_M & EARTA_M 0.8243 10660.83 81 0.0000 *
Table 4 : Legal Failure Risk and its long-term determinants : RISK98
Gamma Pearson
Chi-Square
Df p
VA95r -0.0064 50.8519 36 0.0515
VA97r -0.0294 57.6915 36 0.0123 * VA98r -0.0337 49.1017 36 0.0715 RVa95r 0.0105 128.1942 36 0.0000 * RVa96r 0.0154 101.9909 36 0.0000 * RVa97r 0.0180 125.7226 36 0.0000 * RVa98r 0.0220 119.2231 36 0.0000 * EAR95r 0.1930 244.2410 36 0.0000 * EAR96r 0.1884 221.8348 36 0.0000 * EAR97r 0.2172 284.2228 36 0.0000 * EAR98r 0.1878 218.3605 36 0.0000 * EARTA95r 0.1751 329.4392 36 0.0000 * EARTA96r 0.1789 363.4005 36 0.0000 * EARTA97r 0.2011 442.9817 36 0.0000 * EARTA98r 0.1851 415.0214 36 0.0000 * M_EARTAr 0.2254 557.2780 36 0.0000 * NOTES
1 Indeed, as stated by Laitinen (1991) or Ooghe and Van Wymeersch (1996),
conceptually “failure is based on the cash insolvency concept, which is defined as the inability of the firm to pay its financial obligations when they come due”.
2 This “Accounting Added Result” may be defined as :
Turnover
- Cost of Purchases
- Cost of Furnitures & External Resources Value Added
- Cost of Internal Labor (= salary costs)
- Cost of Financial Resources ( = interests + dividends)
- Cost of Equipment and Internal Infrastructure (= amortization & provisions)
- Cost of External Infrastructure (approximated by the amount of taxes paid to local and regional Authorities)
Accounting Added Result
3 Belgian SMEs have the right to deliver their financial statements in a short format if
they don't occupy more than 50 people, it their total assets is less than about 2.5 Mio Euros and their turnover is less than about 4 Mio Euros, one of these three criteria
may be however exceeded. Information disclosed in a short format don't include data on turnover, on detailed cost structure, on detailed financial revenue and on exceptional results, which reduces interest of such information for scientific purposes ; as financial statements in a short format are essentially present in the smallest companies, especially those occupying less than 10 people, this restriction has a relatively weak impact on the exhaustiveness of our sample.
4 "Rank transformation of observations as been shown to be useful in linear modeling
because the models so constructed are less sensitive to outliers and/or non-normal distributions than are models constructed using standard methods" (Kane e.a., 1998).
5 The Gamma statistic is preferable to Spearman R when the data contain many tied
observations, which is the case in our sample, but in terms of the underlying assumptions, Gamma is equivalent to Spearman R. Pratically, Gamma is also a probability : it is computed as the difference between the probability that the rank ordering of the two variables agree minus the probability that they disagree, divided by (1 – the probability of ties).
6 As we compare two statistical series of which values are already ranked, Pearson
Chi-Square test appears to be more pertinent than the Sperman Rank R test, that implies a second rank listing for the two variables (which means a loss in information, as Risk98 is ranked in 5 categories and the other variable is ranked in 10 deciles).
REFERENCES
Altman E.I. (1996) Corporate financial distress and bankruptcy, 2nd Edition. New-York: John Wiley & Sons
Altman E.I. (1984) "The success of business failure prediction models : an international survey." Journal of Banking and Finance 8 : 171-198
Altman E.I. (1968) "Financial ratios, discriminant analysis and the prediction of corporate bankruptcy;" Journal of Finance 23(4): 589-609
Argenti J. (1976) Corporate collapse : the causes and symptoms. London : Mc Graw-Hill
Beaver W. (1966) "Financial ratios as predictors of failure." Empirical Research in
Accounting, Selected Studies, Supplement to the Journal of Accounting Research : 71-111
Bernstein L., J.J. Wild (1998) Financial statement analysis : theory, application and interpretation. International Edition, Sixth edition. New-York: Irwin/Mc Graw Hill
Berryman J. (1983) "Small business failure and bankruptcy : a survey of the literature." International Small Business Journal 1(4): 47-59
Copeland T., T. Koller, J. Murrin (2000) Valuation : measuring and managing the
value of companies. University Edition, 3rd edition. New-York: Wiley Finance, John Wiley & Sons
Cromie S. (1991) "The problems experienced by young firms." International Small Business Journal 9, May-June: 43-61
Dimitras A., S. Zanakis, C. Zopounidis (1995) "A survey of business failures with an emphasis on prediction methods and industrial applications." European Journal of Operational Research 90 : 487-513
Fitz Patrick P. (1932) "A comparison of ratios of successful industrial enterprises with those of failed firms (I, II & III)." Certified Public Accountant : 598-605, 656-662, 727-731
Guilhot B. (2000) "Défaillances d’entreprise: soixante-dix ans d’analyses théoriques et empiriques." Revue Française de Gestion. Septembre-Octobre : 52-67
Hall G., B. Young (1991) "Factors associated with insolvency amongst small firms." International Small Business Journal 9, March-April : 54-63
Hansen G., B. Wernerfelt B. (1989) "Determinants of firm performance : the relative importance of economic and organizational factors." Strategic Management Journal 10, September-October : 399-411
Kane G., Richardson F., Meade N. (1998) "Rank transformations and the prediction of corporate failure." Contemporary Accounting Research 15(2) : 145 - 166
Kaplan R., D. Norton (1996) The Balanced Scorecard - Translating strategy into action. Boston, Massachusetts : Harvard Business School Press
Keasey K., R. Watson (1991) "The State of the Art of Small Firm Failure Prediction: Achievements and Prognosis." Journal of Small Business Management 9, July-August : 11-29
Koenig G. (1985) «Entreprises en difficultés: des symptômes aux remèdes.» Revue Francaise de Gestion. Janvier-Février : 84-92.
Laitinen E. (1991) "Financial ratios and different failure processes." Journal of Business, Finance and Accounting, September : 649-673
Marco L. (1989) La montée des faillites en France: XIXe - XXe siècle. Collection "Logiques Economiques", First Edition. Paris : Editions L'Harmattan.
Morris R. (1997) Early warning indicators of business failure. Aldershot: Ashgate Publishing
Morris R. (1998) "Forecasting bankruptcy : how useful are failure prediction models ?" Management Accounting. 76(5) : 22-24
Ooghe H., P. Joos P., C. De Bourdeaudhuij (1995) "Financial distress models in Belgium : the results of a decade of empirical research." The International Journal of Accounting 30 : 245-274
Ooghe H., C. Van Wymeersch (1996) Traité d'analyse financière. 6th Edition. Brussels: Wolters Kluwer Belgique & Presses Universitaires de Namur
Porter M. (1985) Competitive advantage : creating and sustaining superior performance. New-York : The Free Press
Sharma S., V. Mahajan (1980) "Early warning indicators of business failure." Journal of Marketing 44 : 80-89
Sheppard J.P. (1994) "Strategy and bankruptcy : an exploration into organizational death." Journal of Management 20(4) : 795-833
Slatter S. (1984) Corporate recovery, successful turnaround and their implementation. London : Penguin Books
Smallbone D. (1990) "Success and failure in new business start-ups." International Small Business Journal 8, March-April : 34-47
Van Wymeersch Ch., Wolfs A. (1996) "La 'trajectoire de faillite' des entreprises : une analyse chronologique sur base des comptes annuels." Cahiers de la Faculté des
Sciences Economiques et Sociales des Facultés Universitaires Notre-Dame de la Paix à Namur 172
Zavgren C. (1983) "The prediction of corporate failure : the state of the art." Journal of Accountancy Literature. 2 : 1- 38.