Cod: 2.1042
REVISITED SAMPLE PREPARATION APPROACH FOR DIOXIN MEASUREMENTS IN HUMAN SERUM SAMPLES
C. Calaprice1, J.F. Focant1
1University of Liège, OBiAChem - Organic and Biological Analytical Chemistry Introduction
When a major chemical accident occurred on Saturday July 10th 1976 at the ICMESA chemical plant located in a small Italian city named Seveso, it not only irrevocably changed our view of chemical plant safety, but it heavily exposed the local population to unprecedented levels of ‘dioxins’ (Hay, 1976). From the early days, measuring TCDD levels in human blood was a key aspect to appreciate to which extend the population health would have been impacted. It however took several years to develop and validate serum methods based on studies that demonstrated that serum sample levels correlated in an excellent way with routinely analysed adipose tissue levels (Patterson et al., 1988). Still today, these 1976 samples are amongst the highest blood TCDD levels (up to 56,000 ppt) ever recorded (Needham et al., 1998). Measuring levels of polycholrinated dibenzo-p-dioxins (PCDDs), polychlorinated dibenzofurans (PCDFs), and polychlorinated biphenyls (PCBs) in human serum is still of prime interest for biomonitoring of the general population. If early 1980’s approaches (Smith et al., 1984) are still followed for sample preparation, methods have evolved to adapt to smaller sample amounts and larger numbers of target analytes.
Although the ultimate goal is to be able to carry out such measurements in µL amounts of serum (L’Homme and Focant, 2016), sensitivity issues remain and will take more time to be solved. In that context, the aim of the present work was to revisit one of the most used sample preparation approach (solid-phase extraction followed by multiple column clean-up and fractionation) in order to minimize solvent consumption and related costs while maintaining the adequate efficiency.
Materials and methods
Solvents (hexane, toluene, methanol) were Picograde® reagents (LGC Promochem, Wesel, Germany). Nonane puriss analytical-reagent grade standard for GC was purchased from Fluka (Steinheim, Germany). Water was obtained from a Milli-Q Ultrapure water purification system (Millipore, Brussels, Belgium). Disposable 2 g/15 ml non-end capped [Si(Me3)] C18 SPE cartridges were purchased by Biotage (Biotage GmbH, Düsseldorf, Germany). Disposable PTFE columns for the automated clean-up were obtained from Fluid Management Systems (FMS Inc., Waltham, MA, USA). Standard solutions for regulated PCDDs, PCDFs, DL-PCBs and NDL-PCBs were the same used in our routine laboratory and described elsewhere (L’Homme et al., 2015).
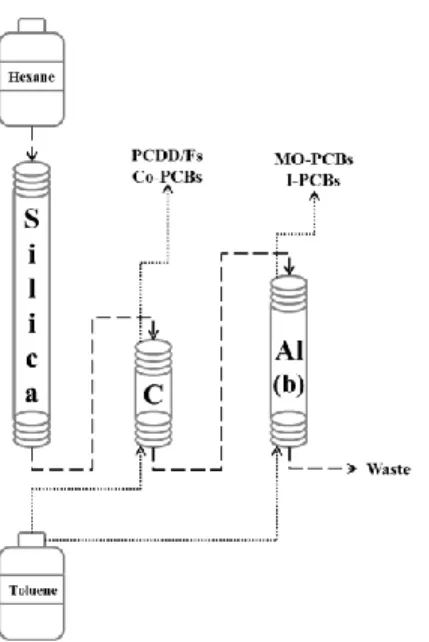
Solid phase extraction (SPE) was carried out using VacMaster-10 Sample Processing Manifold (Argonaut-Sopachem, Brussels, Belgium) according to a validated procedure used in our laboratory and described elsewhere (Focant et al., 2006). For preliminary tests, 4 serum quality control (QCS), 1 procedural blank and 3 real samples were processed. Each sample consisted of 20 g of human serum, weighed in 100 ml glass bottles. Blank samples consisted in 20 ml of Milli-Q water following the same procedure as the samples. Extracts were clean-up and fractionated using the new EconoPrep® from FMS equipped with 3 columns connected in line as follows: multi-layer silica column (6 g, fat capacity <1 g), connected to carbon-celite column (0.34 g) followed by basic alumina column (3 g). Clean-up method details are discussed in the following section and reported in Figure 1. Collected fractions, both in toluene, were evaporated with a sensor-equipped TurboVap II Workstation (Caliper Life Science, Teraflene, Belgium) up to approximately 500 µL and then transferred in GC vials containing nonane as keeper (90 µL for MO-PCBs and NDL-PCBs fraction, and 4 µL for the PCDD/Fs and NO-PCBs fraction). Solvent exchange to nonane was done in RapidVap under-vacuum evaporator (Labconco, Kansas City, MO, USA). Recovery standard was added to each fraction prior instrumental analysis with GC-HRMS (1300 Trace Series GC and Double Focusing Sector, DFS) from Thermo-Fisher Scientific (Thermo Fisher Scientific, Bremen, Germany). Measurements of “fraction 2” with 7 PCDDs, 10 PCDFs and 4 non-ortho DL-PCBs were carried out on a DB-5ms 60 m × 250 µm × 0.25 µm column from Agilent (Palo Alto, CA, United States) connected to the mass spectrometer by a heated transfer line (270 °C). Helium was used as the carrier gas at constant flow rate of 1.2 mL/min. A volume of 2 µl out of the final extract in nonane (9 µl) were injected in a split/spliteless injector working in splitless mode at 290°C, with split flow 70 mL/min for 2 minutes and purge flow 5 mL/min for 2 minutes. The oven temperature
was maintained at 120 °C for 2 min, ramped at 25 °C/min to 250 °C and then ramped at 3.0 °C/min to 285 °C for 15 minutes. The total separation time was 40 min. The HRMS instrument was operated in selected ion monitoring (SIM) mode with mass resolution of at least 10,000 at a 10 % valley; FC43 was used as reference gas. Measurements of “fraction 1” of the 8 WHO mono-ortho PCBs and 6 I-PCBs were carried out HT-8 chromatographic column (25 m × 0.22 mm ID × 0.25 µm film thickness) from SGE (Villebon, France). Helium was used as the carrier gas at constant flow rate of 0.8 mL/min. A volume of 2 µl from the final extract in nonane (100 µl) was injected into a split/splitless injector held at 275 °C in splitless mode. The oven temperature was maintained at 140 °C for 2 min, ramped at 15.0 °C/min to 220 °C held for 7.5 min, ramped at 6.0 °C/min to 250 °C, ramped at 2.0 °C/min to 265 °C, and finally ramped at 28 °C/min to 320 °C. The total separation time was 30 min. The HRMS instrument was operated in selected ion monitoring (SIM) mode with a static resolving power of 10,000. Two ions were monitored for both native and labelled compounds for isotope ratio check.
Results and discussion
Serum samples were first extracted with SPE and then cleaned-up according to a revisited procedure using the new EconoPrep® from FMS. The plumbing diagram is reported in Figure 1 and it was different from the classical one, as carbon-celite column (different from the classical PX-21 0.34 g carbon column) was placed between the silica and the alumina, which were not directly connected. Clean-up sequence and performances are reported in Table 1. Only two solvents, namely hexane and toluene, were used, avoiding the use of dichloromethane. Two fractions were collected out of the system, both eluted wit toluene in backflush: one containing PCDD/Fs and co-PCBs backflushing the carbon column, and the other containing MO- and I-PCBs backflushing alumina column. This clean-up approach, using “mini” column was suitable for matrices with fat content lower than 1 g and, in comparison to the classical, validated clean-up procedure used in our laboratory for such matrices, it allowed 58% time saving and 76% solvent saving, as shown in Table 2. It is interesting to notice that, as both fractions were collected in 30 ml of toluene each one, also the time required for final evaporation and solvent exchange was drastically reduced in comparison to our classical procedure.
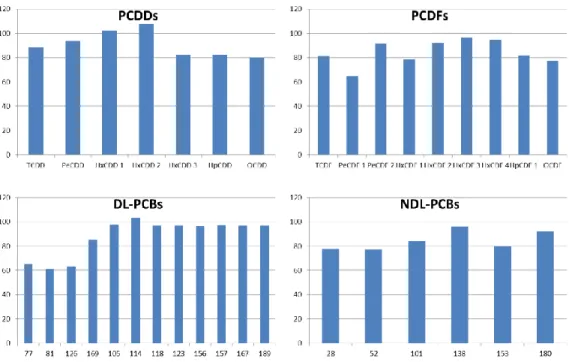
Recoveries, calculated as the average over 4 QCs, 1 procedural blank and 3 real samples, ranged between 60 and 120 %, according to the requirements of the EU Regulation (Figure 2).
Control charts reported in Figure 3 show that TEQ values obtained for 4 QC samples processed according the alternative method proposed here (the last 4 points of each control chart), were not statistically different from the results obtained with our validated procedure.
Acknowledgements
This work was possible thanks to instrumental support of FMS Inc. and Thermo Fisher Scientific.
References
Focant JF, Eppe G, Massart AC, Scholl G, Pirard C, De Pauw E., 2006. High-throughput biomonitoring of dioxins and polychlorinated biphenyls at the sub-picogram level in human serum. J Chromatogr A, 1130:97–107.
Hay, A., 1976. Toxic Cloud Over Seveso. Nature 262, 636-638.
L’Homme , B. and Focant, J.-F., 2016. Cryogenic zone compression GC-HRTOFMS for the measurement of PCB-153 and DDE in 20 mL serum
samples. Anal. Methods 8, 249-255.
L’Homme, B., Scholl, G., Eppe, G. & Focant, J. F. 2015. Validation of a gas chromatography-triple quadrupole mass spectrometry method for confirmatory analysis of dioxins and dioxin-like polychlorobiphenyls in feed following new EU Regulation 709/2014. Journal of Chromatography A, 1376, 149-158.
Needham, L.L., Gerthoux, P.M., Patterson Jr., D.G., Brambilla, P., Turner, W.E., Beretta, C., Pirkle, J.L., Colombo, L., Sampson, E.J., Tramacere, P.L., Signorini, S., Meazza, L., Carreri, V., Jackson, R.J., Mocarelli, P., 1998. Serum Dioxin Levels in Seveso, Italy, Population in 1976. Teratog. Carcinog. Mutagen. 17, 225-240.
Patterson Jr., D.G., Needham, L.L., Pirkle, J.L., Roberts, D.W., Bagby, J., Garrett, W.A., 1988. Correlation Between Serum and Adipose Tissue Levels of 2,3,7,8-Tetrachlorodibenzo-p-Dioxin in 50 Persons From Missouri. Arch. Environ. Contam. Toxicol. 17, 139-143.
Smith, L.M., Stalling, D.L., Johnson, J.L., 1984. Determination of Part-per-Trillion Levels of Polychlorinated Dibenzofurans and Dioxins in Environmental Samples. Anal. Chem. 56, 1830-1842.
Figure 1: plumbing diagram of the new EconoPrep®
step Flow mL/min Volume mL Time minsolv Si C Al coll Description
1 10 20 2 1 1 1 1 w Conditioning
2 5 / 2** 0 1 1 1 w load sample
3 5 60 12 1 1 1 1 w elute hexane
4 5 30 6 2 0 2 0 2 elute C backflush
5 5 30 6 2 0 0 2 1 elute Al backflush
solv: 1 = hexane, 2 = toluene, 0 = sample loading
Si, C, Al: 1 = forward elution, 2 = backflush elution, 0 = skipped
coll: w = waste, 2 = fraction 2 of PCDD/Fs and co-PCBs; 1 = fraction 1 of MO- and I-PCBs
Table 1: Clean-up method sequence in the automated system
Table 2: Alternative approach performances and saving.
Time min Volume mL Hexane mL DCM mL Toluene mL Method Classical procedure* 67.7 587 373 72 142 Alternative procedure 28** 140 80 0 60Saving Alternative procedure 58% 76% 78% 100% 57%
*validate procedure used in our laboratory ** estimated time for sample loading = 2 minutes