Atmosphere 2020, 11, 185; doi:10.3390/atmos11020185 www.mdpi.com/journal/atmosphere Article
Assessment of the Outdoor Thermal Comfort in
Oases Settlements
Mohamed Elhadi Matallah 1,2, Djamel Alkama 3, Atef Ahriz 4 and Shady Attia 2,*
1 Laboratory of Design and Modelling of Architectural and Urban Forms and Ambiances (LACOMOFA),
Department of Architecture, University of Biskra, Biskra 07000, Algeria; [email protected]
2 Sustainable Building Design (SBD) Lab, Department of UEE, Faculty of Applied Sciences, Université de
Liège, 4000 Liège, Belgium
3 Department of Architecture, University of Guelma, Guelma 24000, Algeria; [email protected]
4 Department of Architecture, University of Tebessa, Constantine Road, Tebessa 12000, Algeria;
* Correspondence: [email protected]
Received: 14 December 2019; Accepted: 03 February 2020; Published: 10 February 2020
Abstract: Oases throughout the world have become important ecosystems to replenish food and water supplies. The Saharan Oases exist above the largest underground water supplies in the World. In North Africa, oases witness significantly growing populations in the oasis towns and receive thousands of tourists yearly. In oasis settlements, the majority of the population spends most of the time outdoors, in extremely hot conditions; however, few studies have investigated urban outdoor thermal comfort conditions. Therefore, this study aimed to assess thermal comfort in the Tolga Oasis Complex and test the validity of the ‘oasis effect’ concept. The methodology is based on comparative field measurement and calculation approaches in the heart of Tolga Palm Grove and in different urban settlements. Results indicate highest heat stress levels (Physiologically Equivalent Temperature (PET) index) in the oases Palm Grove in July, PET = 41.7 °C, and urban settlements, PET = 40.9 °C. Despite the significant difference between the old and new settlement fabrics, our measurements and calculation did not identify any noticeable variation of thermal comfort. Thus, the oasis effect on the outdoor thermal comfort was insignificant (during July and August 2018). Finally, the study discusses ways to improve outdoor spaces design and relieve heat stress in the settlements of Tolga.
Keywords: urban form; sky view factor; heat stress; oasis effect; physiologically equivalent temperature; RayMan
1. Introduction
The African Sahara oases are increasingly urbanized, and their future will not be shaped in the surrounding desert but in the dense vibrant palm groves of Ghardaia (Algeria), Siwa (Egypt), Awjila (Libya), Tafilalt, (Morroco), Timia (Niger), and Tozeur (Tunisia). An oasis is the combination of a human settlement and a cultivated area in a desert or semi-desert environment [1]. The oasis is also a socio-spatial settlement in the middle of the desert, with a cultural identity characteristic to a particular human settlement [2]. Urban settlements around oases are growing increasingly, with enormous implications on cooling energy needs, lifestyle, tourism, economy, governance and public services—as well as rising risks if urban growth is poorly managed. According to the World Bank, urbanization and climate change are the two most important transformations the Saharan oases will undergo this century [3,4]. In the same time, the outdoor environment is deteriorating in many oases settlements, where most of human activities take place [5]. People cannot find shade in the middle of the day and excessive heat build-up during the day results in shifting the human activities to the
night and halting any economic activity during summer. The influence of heat stress limits productivity and forces a large part of oasis population to migrate to cooler areas during the summer, replicating the older tradition of nomadism in a modern way. Every summer, across the Saharan desert oases, several families leave their home seeking cooler cities, in their countries. However, this modern seasonal nomadism, which is mainly due to heat stress, is not sustainable and many families find it more and more difficult to maintain [6]. Therefore, there is a need to assess the outdoor thermal comfort in oases settlements and investigate the means to provide livable urban environments for their inhabitants [7]. In this study, we investigated outdoor urban comfort in an oasis defined as a fertile spot in a desert, where water is found with more than 500,000 date palm trees. The scale of our study and its findings confirm the need to define oases and their thermal oasis effects. The research questions corresponding to the research objective are:
• What are the outdoor thermal comfort conditions in oases settlements during summer?
• How far is the oasis effect beneficial for improving thermal comfort conditions in oases
settlements during summer?
• How to improve outdoor spaces design and relieve heat stress in the urban oasis Complex of
Tolga, one of the largest oasis complexes of the Saharan Desert in North Africa and Algeria? Our comparative approach allowed answering the questions above and testing several assumptions and refuting the presence of the ‘oasis effect’ during the months of July and August. The study shows a common similarity of the heat stress levels (PET index) in the oases settlements fabrics
and Palm Grove in August 2018: ∆ PET urban fabric.August = 36.3 °C; ∆ PET palm grove.August = 36.2 °C. The heat
stress level (PET index), evaluated in July, is slightly higher in the Palm Grove than in the oases
settlements fabrics: ∆ PET palm grove.July = 41.7 °C; ∆ PET urban fabric.July = 40.9 °C. However, our study
measurements are limited to daytime hours and should be extended to cover nighttime hours and other seasons of the year. The ‘oasis effect’ might be present in other climatic conditions and under other humidity, solar radiation and temperature thresholds.
In this paper, we present the results of a research that was designed to assess thermal comfort in four oases settlements in Tolga Oasis Complex and compare it with thermal comfort in a palm grove. More specifically, the study tested the validity of the ‘oasis effect’ following a comparative field measurement and calculation approach.
2. Literature Review
Several studies investigated outdoor thermal comfort in hot arid climates [8,9]. Venhari et al. (2019) investigated the correlation between the physiological equivalent temperature (PET) which is defined as the air temperature at which, in a typical indoor setting (without wind and solar radiation), the energy budget of human body is balanced with the same core and skin temperature as under the complex outdoor conditions to be assessed (Mayer and Höppe 1987, Höppe 1999, Matzarakis et al. 1999); The mean radiant temperature (Tmrt) represents an equivalent temperature, that summarizes the effect of all the different short and longwave radiation fluxes, and the sky view factor (SVF) which is the fraction of visible sky, seen from certain point in Isfahan, Iran [10]. Biqaraz et al. (2019) compared the outdoor thermal comfort in historical and contemporary urban fabrics of Lar, Iran [11]. Potchter et al. (2013) studies combined effect of urban warming and global warming in the desert city of Beer Sheva (Israel) and proved their noticeable impact using the PET and Discomfort Index (DI) [12]. Some years later Cohen et al. (2019) assessed the urban outdoor perception in the same city and suggested modified PET ranges between 17 °C and 26 °C (arid climate) which is wider than Mediterranean and hot, humid climates [13]. In Cairo, Egypt, Elnabawi et al. (2016) evaluated the thermal perception of outdoor urban spaces and indicated that the preferred temperatures were 29 °C PET in summer and 24.5 °C PET in winter [14]. In Ghardaia, Algeria, Ali-Toudert et al. (2006) assessed the outdoor thermal comfort in relation to the urban street canyon aspect ratio and orientation [15]. Similarly, Johanssen et al. (2006) investigated the influence of urban geometry on outdoor thermal comfort in Fez, Morroco [16]. More specifically Zhao et al. (2018) investigated the
effect of tree locations and arrangement on outdoor microclimate and Middel et al. (2016) investigated the effect shade in Arizona, USA [17,18].
The most common index used among the above listed studies is the PET [19]. The study of Potchter et al. (2018) demonstrated that out of 165 human thermal indices that have been developed, only four (PET, PMV, UTCI, SET*) are widely in use for outdoor thermal perception studies for different climates [20]. Additionally, Binarti et al. (2020) confirmed the frequent use of PET in most review studies. They reviewed the frequently used outdoor thermal comfort indices in hot-humid regions and neutral thermal ranges including PET, mPET, UTCI, SET*, and OUT_SET* [21]. Furthermore, Hirashima et al. (2018) indicated the importance of comparing thermal comfort in different climate regions and calibrating the PET index scale [22]. Roshan et al. (2017 and 2019) shared the same recommendation in their studies to estimate the different outdoor ranges and sensation scales in different regions in Iran [23,24]. Moreover, the study of Matzarakis et al. (2007) confirmed that the most important meteorological parameter affecting the human energy balance during sunny weather conditions is the mean radiant temperature (Tmrt) [25]. With the help of the RayMan model only a limited number of meteorological and other input data can be used to calculate radiation flux densities, sunshine duration, shadow spaces and thermo-physiologically relevant assessment indices [6].
Despite the advancement of methods and means to assess outdoor thermal comfort in hot climates, so far, only limited attention has been paid to outdoor comfort in oases settlements [26].
Saaroni et al. (2004) examined the ‘oasis effect’ which refers to the phenomenon of the cooling effect caused by vegetation, in a new rural farm settlement within the Negev Desert [27,28]. Similarly, Potchter et al. (2008) examined the ‘oasis effect’ and its diurnal dynamics in a rural settlement in Southern Israel [29]. But both studies investigated the oasis effect in urban small settlements compared to the North African oases settlements. Thus, the scope of those studies and the scale of the investigated Israeli oasis settlements do not correspond to the nature and scale of the oases in North Africa. In the same time, the studies that investigated the outdoor thermal comfort in North Africa’s Oases are limited. In a study dedicated to assess the vegetation effect on the formation of an ‘oasis cool island’ Boudjellal et al. (2018) aimed to quantify the oasis cooling effect on two urban settlements [30]. The study was based on remotely sensed data. Rchid et al. (2012), examined the influence of palm groves during summer on microclimate in Ghardaia, Algeria and measured only air temperature as the only meteorological variable [31]. In Tunisia, Sellami et al. (1998) measured the global radiation and net radiation inside the oasis [32]. However, none of the previous studies assessed the overall outdoor urban comfort in oases urban settlements. On the other hand, the most relevant study that we found in literature, is the study of Ali-Toudert et al. (2005) [33]. The study assessed thermal comfort using the PET index [33]. On-site meteorological measurements were carried out in the old Saharan city of Beni-Isguen, Algeria (32.40° N). The study investigated the effectiveness of traditional design solutions in ensuring comfortable outdoor conditions but did not address the ‘oasis effect’. This study is almost the only study that focused on large scale oasis in the Sahara.
The type of findings presented above, contribute to the controversial reputation of thermal oases effects, which may be one of the reasons why the cooling potential of such landscape strategy is largely unused in practice [7]. Considering this overview of literature, it is clear that there is a need for continuous measurements to establish the dependence between air temperature and the urban fabrics in oasis settlements.
3. Methodology
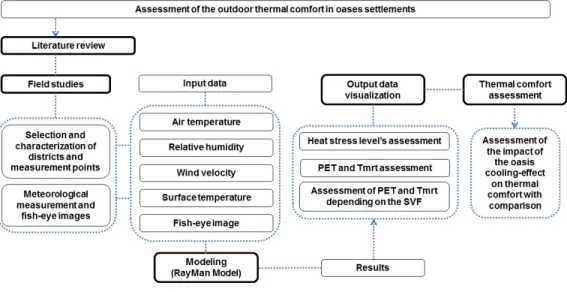
In this research, three methods were used comprising a literature review, field measurements and modeling. In order to assess the oasis effect on the outdoor thermal comfort we followed an empirical methodological approach. Figure 1 illustrates the major methodological stages from data collection to data processing and modeling until the final step of output visualization. The following subsections explain in detail the methodology.
Figure 1. Conceptual study framework.
3.1. Literature Review
A literature review is conducted including recent publications that aimed to assess outdoor thermal comfort in desert regions worldwide. The publications include scientific manuscripts that focus on the thermal effects of oasis in desert climates. Our initial Scopus and Web of Science research resulted in more than 40 publications. To narrow and concentrate the scope of our study, the publications are under three categories: outdoor thermal comfort in hot climate, outdoor thermal comfort assessment methods, oasis urban climate. In addition, recent studies conducted in Algeria, are reviewed to improve our knowledge uptake regarding the local context. The results of the literature review are presented in Section 2.
3.2. Field Studies
The context of this study is a complex of oasis settlements in Biskra Province, situated in the South of Algeria. The study area is Tolga city (34° 43′ 00′′ N and 5° 23′ 0′′ E) positioned within a six oasis Complex, situated at elevation 147 m above sea level and located in south-east Algeria, 363 km south of the capital Algiers. Tolga city is located at an altitude of 87 m in the northern part of the Sahara Desert. The Oasis Complex has a population of 150,036 according to the census of 2017. The study area has a hot arid climate (Koppen BWh) with a variation between summer and winter temperatures. In an average for a period of 30 years (1987–2017) the warmest month is July with an average of 34.6 °C and the coldest is January with average of 11.8 °C. According to the meteorological station WMO 605265, the highest temperature registered in the last decade is 46.8 °C in July and the lowest is 3.0 °C in January. The monthly average of sunshine duration between 2007 and 2017 is 268 h/month, with 358 h/month in July (WMO 605265). Thus, the highest global radiation is taken in July
with 246 Kw/m2. Tolga Oasis Complex does not have a heavy rainfall. The average rainfall is 126 mm
millimeters yearly. Tolga is well-known internationally for high-quality dates (Deglet Nour) with a production of 1,356,202 quinto of dates in 2017. It has more than 1,006,600 date palm trees. The study context is considered as one of the largest oasis Complex of the Saharan Desert in North Africa [6]. In this study, two municipalities related to the urban oasis Complex of Tolga territory are selected,
namely Tolga and Lichana .
3.2.1. Site’s Selection Criteria
Overall, five sites are selected to conduct a measurement campaign in order to assess outdoor thermal comfort and investigate the oasis effect on urban climate. The selection of the five sites is
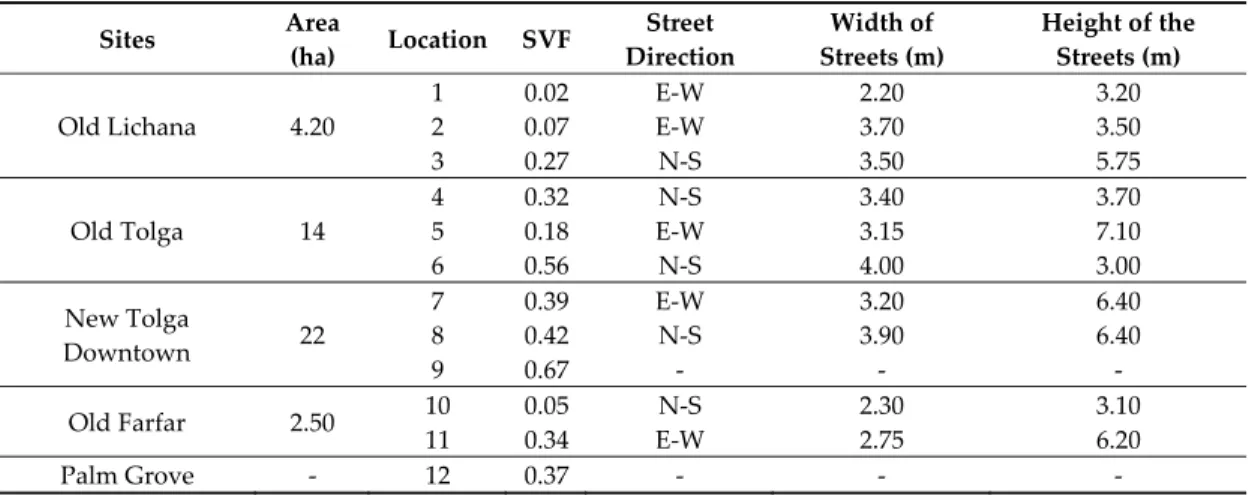
based on four main criteria: (i) level of vegetation and oases settlement fabric [10,34], (ii) the age of the oases settlement fabric [16], (iii) the size of the built-up settlement, and (iv) the relation between the built-up settlement and the Palm Grove. The differences between the old and new urban fabrics are mainly related to the urban form and the connection with palm grove. Most of old oasis settlements have an irregular urban form and close to the palm grove (<100 m). Thus, the urban density is high (<15 ha), streets are narrow (<4 m). In contrary, the new oasis settlements have regular urban form, far from the Palm Grove (>1000 m), with a large built area (>20 ha). The urban characteristics of the old settlements (Old Lichana, Old Tolga, and Old Farfar) are showed on the irregular urban form, streets are between 2.20–4.00 m, and occupancy of built-up area is around 0.80. Building materials are generally with local materials (stone, lime, and palm trunk), no asphalt inside streets. Old settlements are closer to the palm grove than the new ones (<100 m). In the other hand, the new settlements (New Tolga Downtown), the urban form has a regular geometry, streets are wider >3.20, urban occupancy is <0.60, and farther from the palm grove (>1000 m). Thus, the housing materials are modern; houses are built on brick, concrete, with a reflective color. Inside the most of the new settlements we can see some little green areas: grass, Ficus rubiginosa. We would like to confirm that the site’s urban morphological details are more explained in the Table 1.
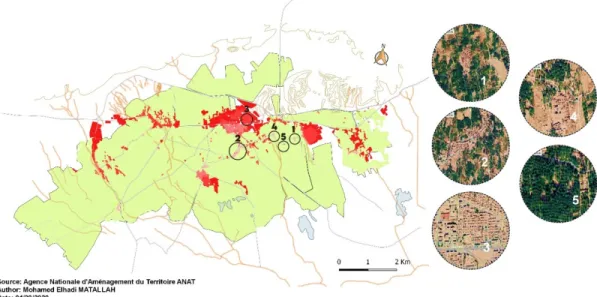
After applying all these criteria, on the Oasis Complex of Tolga, five different oases settlements are identified as case studies: (1) Old Tolga, (2) Old Lichana, (3) New Tolga Downtown, (4) Old Farfar, and (5) a Palm Grove, as a reference point (Figure 2). Appendix A provides further details on the study site.
Figure 2. Map of the selected sites in Tolga oasis Complex.
To assess the oasis effect, measurement of several outdoor climate parameters was done simultaneously together with fish-eye images. In total, twelve measurement points were selected:
• Three points in Old Lichana (1, 2, 3),
• Three points in Old Tolga (4, 5, 6),
• Three points in New Tolga Downtown (7, 8, 9),
• Two points in Old Farfar (10, 11), and
Table 1. Morphological characteristics of sites and measurement points in Tolga Oasis Complex, July and August 2018. Sites Area (ha) Location SVF Street Direction Width of Streets (m) Height of the Streets (m) Old Lichana 4.20 1 0.02 E-W 2.20 3.20 2 0.07 E-W 3.70 3.50 3 0.27 N-S 3.50 5.75 Old Tolga 14 4 0.32 N-S 3.40 3.70 5 0.18 E-W 3.15 7.10 6 0.56 N-S 4.00 3.00 New Tolga Downtown 22 7 0.39 E-W 3.20 6.40 8 0.42 N-S 3.90 6.40 9 0.67 - - - Old Farfar 2.50 10 0.05 N-S 2.30 3.10 11 0.34 E-W 2.75 6.20 Palm Grove - 12 0.37 - - -
3.2.2. Meteorological Measurements and Fish-Eye Images
The parameters measured during the study are: air temperature (Ta), relative humidity (RH), air
velocity (Va), and surface temperature (Ts). The measurements were taken using the Testo 480
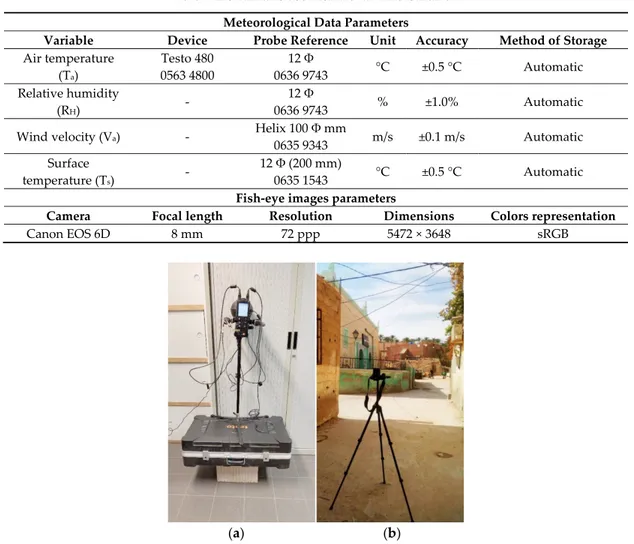
measurement station (Figure 4), which is a reliable and validated instrument for data acquisition (Table 2) [35]. The sensors were kept at 1.40 m height from the ground to avoid the effect of surface contact [33]. The fish-eye images are picked by using Canon EOS 6D camera (Table 2) at each measurement point (Figure 3). The fish-eye images took the degree of the opening to sky inside the street, in consideration. The camera was oriented to the sky (Figure 4). To calculate the SVF in RayMan the images were treated by the software.
Figure 3. Fish-eye images of 12 studied points: (1, 2, 3) Old Lichana; (4, 5, 6) Old Tolga; (7, 8, 9) New
Table 2. Instruments used for the data measurement. Meteorological Data Parameters
Variable Device Probe Reference Unit Accuracy Method of Storage
Air temperature (Ta) Testo 480 0563 4800 12 Φ 0636 9743 °C ±0.5 °C Automatic Relative humidity (RH) - 12 Φ 0636 9743 % ±1.0% Automatic
Wind velocity (Va) - Helix 100 Φ mm
0635 9343 m/s ±0.1 m/s Automatic
Surface
temperature (Ts) -
12 Φ (200 mm)
0635 1543 °C ±0.5 °C Automatic
Fish-eye images parameters
Camera Focal length Resolution Dimensions Colors representation
Canon EOS 6D 8 mm 72 ppp 5472 × 3648 sRGB
(a) (b)
Figure 4. Instruments used for the study fields: (a) meteorological station, (b) fish-eye camera.
The meteorological measurements which are: air temperature, relative humidity, wind velocity also to the surface temperature, this one is necessary to calculate Tmrt. The measurements are performed between July, 20th to 29th (except 27th) and August, 10th to 17th, 2018, which represent the hottest period of the year. This period was selected to estimate the impact of the oasis effect on the outdoor thermal comfort during extreme hot days of the year, which is the main aim of this study. The measurements were taken at 05:00 a.m., 09:00 a.m., 01:00 p.m., 05:00 p.m., and 09:00 p.m. following the study of (Sebti et al., 2013) in Ouargla city in the South of Algeria [36].
3.3. Modeling Process (RayMan Model)
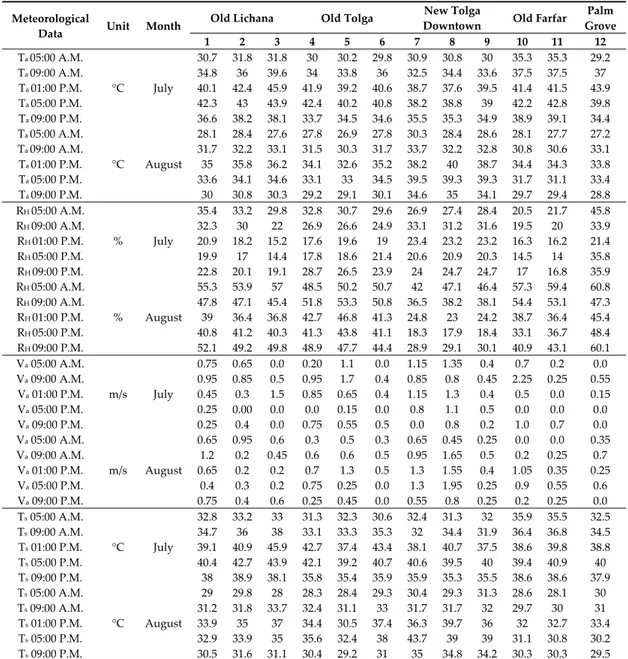
RayMan Pro 3.1 Beta software is a micro-scale model developed for environmental meteorology [25,37]. The program is used to calculate the mean radiant temperature (Tmrt) and Physiologically Equivalent Temperature (PET) thermal comfort index at the twelve studied points. GIMP 2.10 (GNU Image Manipulation Program) developed for the image’s manipulation, is used for processing of the fish-eye images, which are modelled on a square shape. For the SVF calculation it’s necessary to process the fish-eye image with the GIMP on square shape with high resolution (300 dpi) and transfer it into the RayMan software. All the studied meteorological and fish-eye images are inserted in RayMan model (Input data) to calculate Tmrt, PET, and SVF indices (Table 3). PET and SVF values are performed in RayMan output data tables. Simultaneously, to the meteorological measurements and fish-eye images, other geographical data is used in this study as: longitude (°E) 4°56′, the latitude (°N) 34°38′, the altitude (m) 147, and the time zone (UTC + h) 1.0. The RayMan output data are visualized in tables (data tables).
Table 3. Summary of meteorological data input in RayMan.
Meteorological
Data Unit Month
Old Lichana Old Tolga New Tolga
Downtown Old Farfar Palm Grove 1 2 3 4 5 6 7 8 9 10 11 12 Ta 05:00 A.M. °C July 30.7 31.8 31.8 30 30.2 29.8 30.9 30.8 30 35.3 35.3 29.2 Ta 09:00 A.M. 34.8 36 39.6 34 33.8 36 32.5 34.4 33.6 37.5 37.5 37 Ta 01:00 P.M. 40.1 42.4 45.9 41.9 39.2 40.6 38.7 37.6 39.5 41.4 41.5 43.9 Ta 05:00 P.M. 42.3 43 43.9 42.4 40.2 40.8 38.2 38.8 39 42.2 42.8 39.8 Ta 09:00 P.M. 36.6 38.2 38.1 33.7 34.5 34.6 35.5 35.3 34.9 38.9 39.1 34.4 Ta 05:00 A.M. °C August 28.1 28.4 27.6 27.8 26.9 27.8 30.3 28.4 28.6 28.1 27.7 27.2 Ta 09:00 A.M. 31.7 32.2 33.1 31.5 30.3 31.7 33.7 32.2 32.8 30.8 30.6 33.1 Ta 01:00 P.M. 35 35.8 36.2 34.1 32.6 35.2 38.2 40 38.7 34.4 34.3 33.8 Ta 05:00 P.M. 33.6 34.1 34.6 33.1 33 34.5 39.5 39.3 39.3 31.7 31.1 33.4 Ta 09:00 P.M. 30 30.8 30.3 29.2 29.1 30.1 34.6 35 34.1 29.7 29.4 28.8 RH 05:00 A.M. % July 35.4 33.2 29.8 32.8 30.7 29.6 26.9 27.4 28.4 20.5 21.7 45.8 RH 09:00 A.M. 32.3 30 22 26.9 26.6 24.9 33.1 31.2 31.6 19.5 20 33.9 RH 01:00 P.M. 20.9 18.2 15.2 17.6 19.6 19 23.4 23.2 23.2 16.3 16.2 21.4 RH 05:00 P.M. 19.9 17 14.4 17.8 18.6 21.4 20.6 20.9 20.3 14.5 14 35.8 RH 09:00 P.M. 22.8 20.1 19.1 28.7 26.5 23.9 24 24.7 24.7 17 16.8 35.9 RH 05:00 A.M. % August 55.3 53.9 57 48.5 50.2 50.7 42 47.1 46.4 57.3 59.4 60.8 RH 09:00 A.M. 47.8 47.1 45.4 51.8 53.3 50.8 36.5 38.2 38.1 54.4 53.1 47.3 RH 01:00 P.M. 39 36.4 36.8 42.7 46.8 41.3 24.8 23 24.2 38.7 36.4 45.4 RH 05:00 P.M. 40.8 41.2 40.3 41.3 43.8 41.1 18.3 17.9 18.4 33.1 36.7 48.4 RH 09:00 P.M. 52.1 49.2 49.8 48.9 47.7 44.4 28.9 29.1 30.1 40.9 43.1 60.1 Va 05:00 A.M. m/s July 0.75 0.65 0.0 0.20 1.1 0.0 1.15 1.35 0.4 0.7 0.2 0.0 Va09:00 A.M. 0.95 0.85 0.5 0.95 1.7 0.4 0.85 0.8 0.45 2.25 0.25 0.55 Va01:00 P.M. 0.45 0.3 1.5 0.85 0.65 0.4 1.15 1.3 0.4 0.5 0.0 0.15 Va05:00 P.M. 0.25 0.00 0.0 0.0 0.15 0.0 0.8 1.1 0.5 0.0 0.0 0.0 Va09:00 P.M. 0.25 0.4 0.0 0.75 0.55 0.5 0.0 0.8 0.2 1.0 0.7 0.0 Va 05:00 A.M. m/s August 0.65 0.95 0.6 0.3 0.5 0.3 0.65 0.45 0.25 0.0 0.0 0.35 Va09:00 A.M. 1.2 0.2 0.45 0.6 0.6 0.5 0.95 1.65 0.5 0.2 0.25 0.7 Va01:00 P.M. 0.65 0.2 0.2 0.7 1.3 0.5 1.3 1.55 0.4 1.05 0.35 0.25 Va05:00 P.M. 0.4 0.3 0.2 0.75 0.25 0.0 1.3 1.95 0.25 0.9 0.55 0.6 Va09:00 P.M. 0.75 0.4 0.6 0.25 0.45 0.0 0.55 0.8 0.25 0.2 0.25 0.0 Ts 05:00 A.M. °C July 32.8 33.2 33 31.3 32.3 30.6 32.4 31.3 32 35.9 35.5 32.5 Ts09:00 A.M. 34.7 36 38 33.1 33.3 35.3 32 34.4 31.9 36.4 36.8 34.5 Ts01:00 P.M. 39.1 40.9 45.9 42.7 37.4 43.4 38.1 40.7 37.5 38.6 39.8 38.8 Ts05:00 P.M. 40.4 42.7 43.9 42.1 39.2 40.7 40.6 39.5 40 39.4 40.9 40 Ts09:00 P.M. 38 38.9 38.1 35.8 35.4 35.9 35.9 35.3 35.5 38.6 38.6 37.9 Ts 05:00 A.M. °C August 29 29.8 28 28.3 28.4 29.3 30.4 29.3 31.3 28.6 28.1 30 Ts09:00 A.M. 31.2 31.8 33.7 32.4 31.1 33 31.7 31.7 32 29.7 30 31 Ts01:00 P.M. 33.9 35 37 34.4 30.5 37.4 36.3 39.7 36 32 32.7 33.4 Ts05:00 P.M. 32.9 33.9 35 35.6 32.4 38 43.7 39 39 31.1 30.8 30.2 Ts 09:00 P.M. 30.5 31.6 31.1 30.4 29.2 31 35 34.8 34.2 30.3 30.3 29.5
In the study measurements, we should mention that the air temperature extremes, are taken at
1:00 p.m., with Tair max-July = 45.9°C and Tair max-August = 40.4 °C. Thus, daily means are ∆Tair-July = 37 °C and
∆Tair-August = 33.3 °C. Moreover, the relative humidity values were swept between HR max = 64.8% in
August in the point (12) inside the Palm Grove, and HR min = 13.1% in July in the point (10).
4. Results
4.1. SVF and Thermal Comfort Levels Assessment Heat Stress Level’s Assessment
The assessment of PET shows that during the studied period there are five different thermal comfort zones (Table 4): Neutral, slightly warm, warm, hot, and very hot. PET ranges were based on the study of (Cohen et al., 2019) in arid climate (BWh) (Table 5). Results show an increase in the PET values during the daytime and after sunrise until sunset, in all measurement points. The assessment of PET, shows a peak zone over 42 °C at the daylight hours (from 9:00 a.m. to 5:00 p.m.) causing an
obtained in the Palm Grove at 5:00 a.m. in August (point 12). Results demonstrate a close similarity of heat stress levels in almost all measurement points during July and August at daylight hours.
Table 4. Assessment of the outdoor thermal comfort level stress via PET index in the five study cases
between July and August.
District
Measurement
Point PET 5:00 a.m.
PET 9:00 a.m. PET 1:00 p.m. PET 5:00 p.m. PET 9:00 p.m.
July August July August July August July August July August Old Lichana 1 30 27.3 39.9 38.5 49.7 43.8 47.3 37.8 36.7 29.3 2 31.5 27.4 44.8 41.5 52.1 45.6 48.3 38.7 38.2 31.3 3 31.3 26.4 45.3 39.1 55.1 45.7 53 41.9 37.4 29.2 Old Tolga 4 28.8 26.7 38.6 36.7 50.6 42.7 47.5 37.5 32.8 28.3 5 28.8 26.1 40.2 35.3 47.6 39.4 48.3 40.5 33.8 28 6 27.6 26.2 41.5 37.3 48.9 45 49.3 43.8 32.7 28.4 New Tolga Downtown 7 28.9 28.4 40.3 40.1 46.4 45.9 46.5 47.3 33.9 33.2 8 28.3 26.6 39.5 35.7 45.9 49.1 46.2 45.6 33.8 33.5 9 28.1 26.7 38.8 41.1 47.6 50.6 44.3 44.1 33 32 Old Farfar 10 35.1 28.4 42.1 36.5 50.4 42 46.9 36.2 38.5 29.8 11 33.9 26.9 46.6 39.8 50.2 43.2 50.7 37.9 38.2 28 Palm Grove 12 28.8 25.7 45.4 43.5 51.6 44.3 48.8 39.5 34 27.8 Thermal comfort stress level 17–26 26–28 28–37 37–42 >42
Neutral Slightly warm Warm Hot Very hot
No thermal Slight heat Moderate heat Strong heat Extreme heat
stress stress stress stress stress
Table 5. The original (Physiologically Equivalent Temperature) PET scale for Middle/Western Europe
(Cfb) and the adjusted PET scale for Beer Sheva in Israel (BWh). Sources: (a) [19], (b) [13].
Thermal Sensation
Mid/West Europe 1996 (a)
Beer Sheva, Israel 2019 (b) Cfb BWh Very Cold 4 6 Cold 8 8 Cool 13 13 Slightly Cool 18 17 Neutral 23 26 Slightly Warm 29 28 Warm 35 37 Hot 41 42 Very Hot - -
4.2. PET and Tmrt Values Assessment at the Measurement Points
(a) PET values assessment
The assessment of PET in July and August, shows that the July averages are higher than August
during the daytime in all the measurement points (Figure 5) with PETave.July = 41 °C, PETave.August = 36.2
°C. This decrease in August is mainly due to the wind velocity, which influence the level of the heat stress. PET values were similar in the three measurement points (7, 8, 9) of the downtown 11 December neighborhood (Table 1) between July and August during the entire daytime where
PETave.July = 38.8 °C, PETave.August = 38.7 °C. PET values are lower in August than July in most of other
PET averages obtained at the points (1, 2, 3, 4, 5, 6, 10, 11, 12) are higher than (7, 8, 9) points in July and lower in August (Figure 5). The highest value of PET, in July, was observed at the (3) point
of the Old Lichana, with a PETmax= 55.1 °C at 1:00 p.m. The point (9) in the downtown 11 December
neighbourhood, showed the highest value in August with PETmax= 50.6 °C at 1:00 p.m. The lowest
value PETmin = 27.6 °C was obtained at the point (6) in Old Tolga at 5:00 a.m. in July. The PETmin = 25.7
°C in August was calculated at 5:00 a.m. at the point (12) inside the Palm grove. (b) Tmrt values assessment
The Tmrt values are very sensitive to the solar time (Figure 5), their values were too close to the
air temperature (Ta) at 5:00 a.m., and 9:00 p.m. Otherwise, Tmrt values increase in the daytime (9:00
a.m., 1:00 p.m., 5:00 p.m.). The highest value of Tmrt in July was observed at the point (3), with a
Tmrtmax = 61.0 °C at 1:00 p.m. The point (9), shows the highest value in August with Tmrtmax = 60.3 °C
at 1:00 p.m.
The lowest value of Tmrtmin= 25.5 °C was obtained at the point (6) at 5:00 a.m. in July. As well
as the Tmrtmin = 24.4 °C in August was taken at 5:00 a.m. at the point (6) and (12) point inside the Palm
Grove. The (1, 2 and 10) points in old Lichana and old Farfar respectively representing the lowest SVF (<0.1) shows a high Tmrt levels in July all the day, compared to the other points. Tmrt averages at points (1, 2, 3, 4, 5, 6, 10, 11, 12) were higher than the (7, 8, 9) in July with 45.2 °C, 42.6 °C respectively. Whereas, they were lower in August with 39.6 °C and 42.7 °C.
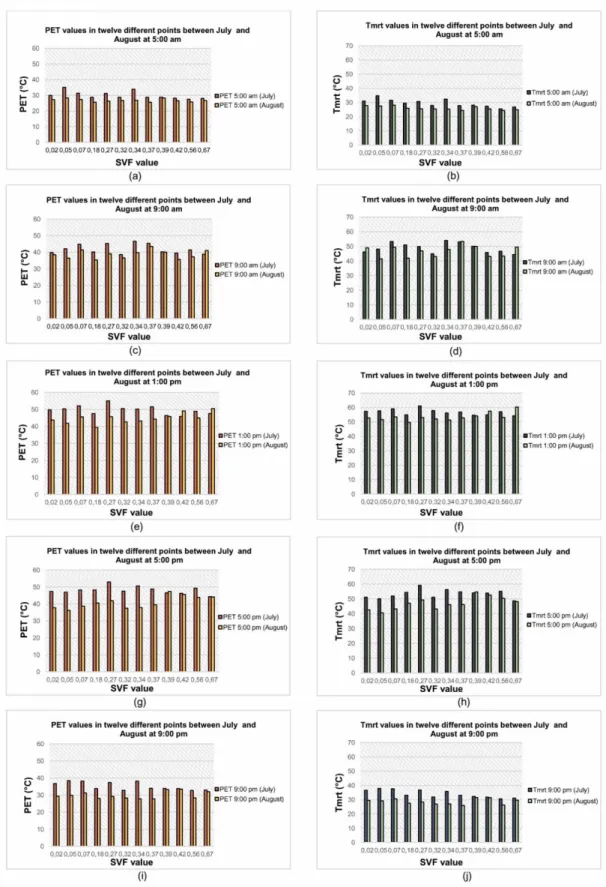
4.3. Assessment of PET and Tmrt Depending on the SVF
The assessment of PET and Tmrt depending on the SVF [10,38], is illustrated in the (Figure 6). It represents two distinguished thermal periods of the day. The first period was observed during sunrise and sunset time (5:00 a.m. and 9:00 p.m.), and the second period was in daylight hours (9:00 a.m., 1:00 p.m., 5:00 p.m.). PET and Tmrt values were too close in the first period (5:00 a.m. and 9:00 p.m.) (Figure 6) in July and August, the curves were approximately superposed.
Figure 5. Assessment of PET and Tmrt levels in 12 studied points during July and August 2018 at 5:00
a.m., 9:00 a.m., 1:00 p.m., 5:00 p.m., and 9:00 p.m.: (a,c,e,g,i) are PET values; (b,d,f,h,j) are Tmrt values.
A significant difference, between PET and Tmrt values in the second period (9:00 a.m., 1:00 p.m., 5:00 p.m.) (Figure 6) was found in July and August, relative likely to the elevation of air temperature
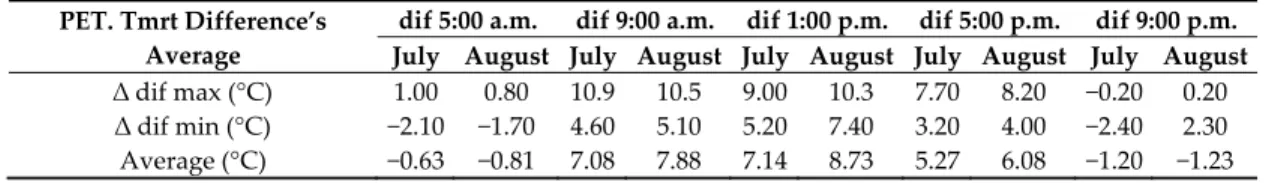
in this period of the day. Otherwise, the curves were parallel, which means the difference is stable all the day. The average of dif. value between PET and Tmrt in July and August was negligible in the first period (Table 6) with ∆ dif. value July = 0.9 °C and ∆ dif. value August = −0.75 °C. The average of dif. value between PET and Tmrt was higher in the second zone with ∆ dif. value July = 6.71 °C and ∆ dif. value July = 7.56 °C (Table 6). No significant impact is observed of the SVF values on the PET and Tmrt variations all the day in July and August.
Table 6. Difference values between PET and Tmrt between July and August 2018. PET. Tmrt Difference’s
Average
dif 5:00 a.m. dif 9:00 a.m. dif 1:00 p.m. dif 5:00 p.m. dif 9:00 p.m. July August July August July August July August July August
∆ dif max (°C) 1.00 0.80 10.9 10.5 9.00 10.3 7.70 8.20 −0.20 0.20
∆ dif min (°C) −2.10 −1.70 4.60 5.10 5.20 7.40 3.20 4.00 −2.40 2.30
Figure 6. Variations between PET and Tmrt values depending on the SVF during July and August
5. Discussion
The main aim of this study was to assess the outdoor thermal comfort and investigate the oasis effect in the Tolga Oasis Complex. An investigation and comparison of thermal comfort parameters and values, in five different locations, took place between July and August 2018.
5.1. Findings
The study shows a common similarity of the heat stress levels (PET index) in the oases
settlements fabrics and Palm Grove in August ∆ PET urban fabric.August = 36.3 °C, ∆ PET palm grove.August = 36.2
°C. The heat stress level (PET index), evaluated in July, is slightly higher in the Palm Grove than in
the oases settlements fabrics, ∆ PET palm grove.July = 41.7 °C, ∆ PET urban fabric.July = 40.9 °C. The difference is
mainly caused by the shading factor, which is higher in the oases settlements fabrics, and slightly due
to the variation of wind velocity between sites, which the ∆ Vairurban fabric.July = 0.6 m/s, ∆ VairPalm Grove .July
= 0.1 m/s (Table 3). In the same time-peroid, the Palm Grove is more influenced by the increase of
diurnal solar direct radiation ∆ Tmrt urban fabric.July = 44.5 °C, ∆ Tmrt palm grove.July = 45.1 °C, which causes a
warming-effect.
Surprisingly, the influence of the urban fabric on the PET was insignificant. Despite the significant difference between the old and new oases settlement fabrics, our measurements and calculation did not identify any noticeable variation of urban thermal comfort. We processed the housing materials (albedo parameters of surroundings) in all the study period additionally to the SVF, which is the streets level’s opening to the sky. The SVF values indicate that the street is wide or narrow, and how much the street is shaded or exposed to sun radiation (its ranges are from 0 to 1, where 0 means that the sky is totally covered by terrain or obstacles, while 1 stands for a free sky). RayMan took all these parameters to calculate Tmrt, and PET index, which makes it very sensitive to surrounding conditions (meteorological and thermophysical). RayMan represents current relevant software for the urban climate assessment. No significant impact of the SVF on the thermal heat stress was found. More surprisingly, the ‘oasis effect’ on the outdoor thermal comfort was insignificant (during the study period).
We refer to the insignificant correlation between the PET and SVF in the study period to illuminate three factors: (a) most of the measurement points are similar to neighborhoods in the Tolga Oasis Complex content, with air conditioners practically in each house, which participate as heat sources inside the streets; (b) the building materials used by the inhabitants were not used rationally; (c) certainly there are a climatic thresholds like air temperature, relative humidity, and wind velocity thresholds which influence the oasis effect, and have an impact on the thermal stress. The SVF will be connected to thermal balance (PET) in limited climatic thresholds.
5.2. Strength and Limitations of the Study
The strength of this study is mainly due to its empirical and comparative approach to assess urban thermal comfort in an oasis Complex. None of the previously published papers compared urban thermal comfort in a large-scale Palm Grove community, in North Africa. Therefore, this study provides a quantification of outdoor thermal conditions inside and outside a Palm Grove during summer, in the arid climate of Algeria. Our findings are limited to the study period and frequency of measurements; however, it is considered as a following step for the work of Ali-Toudert conducted in Ghardaia (2007) [15,39]. This study represents a step in the assessment of outdoor thermal comfort and overheating conditions in a hot arid climate oasis Complex.
Unfortunately, across the reviewed literature there is a large confusion and wrong understanding of the definition of an oasis, which is essentially associated with lower temperatures and higher relative humidity [40] regardless of the context. This is mainly due to the lack of a definition of an oasis. According to literature an oases can be an urban park or even a tiny lawn field with isolated trees in a rural settlement.
Furthermore, the overheating in oases settlements is critical to the human body and has a significant impact on inhabitants’ well-being, productivity, and satisfaction. With climate change and the recurring heat waves, human health in oases settlements can be subject to increases in morbidity and mortality [41]. Although there is strong evidence linking extreme heat with excesses in mortality, there is less literature describing the impact on morbidity, including the impacts on specific age groups in oases communities during heat waves. This study focused on quantifying the physical heat by measuring and modeling urban thermal comfort during extreme summer climatic conditions. We hope that our findings can be coupled to epidemiological analysis to estimate the socio-economic impact of heat stress on oases inhabitant and tourism activities. Our findings indicate the urgency of providing an integrated outdoor spaces design procedure to relieve heat stress in oases settlements. 5.3. Implication on Practice and Research
This study identified the impact of the oasis on the outdoor thermal comfort during summer in Tolga Oases Complex. Based on our findings, we advise urban planners and landscape architects to not overestimate the passive cooling effect of the oasis palm grove. Therefore, urban designers and city planners should assure shading in public spaces and prepare the outdoor spaces to host people during extreme heat stress conditions in oases urban settlements. Natural ventilation or increasing the air flow and providing outdoor shading are an essential design element in oasis urban fabric. The reflectivity of ground and facade surfaces should be considered too [42]. Glare is another important aspect that needs to be avoided increasing the satisfaction of people with the perceived temperature. Future research should focus on investigating outdoor thermal comfort on an annual basis. The cooling effect might be mostly effective outside the extreme hot summer months. Additionally, the urban outdoor thermal perception should be investigated through field surveys to assess the local comfort [43]. The authors are aware that behavioral and psychological adaptations have proven to have a remarkable impact on thermal perception [44]. This approach can add several recommendations for developing an adaptive urban oasis model and bioclimatic design recommendations in oasis zone of Algeria [45].
6. Conclusions
An empirical investigation of thermal comfort in four urban fabrics and an oasis palm grove was
performed and compared between July and August 2018. The monitored data: Ta, RH, Va, Ts and
fish-eye images were taken in several times in the day. The modeling and calculation was based on three principal parameters namely, SVF, Tmrt, and PET index with the help of RayMan model. The study shows a common similarity of heat stress levels (PET index), during daytime in August, between the
oasis urban fabric and palm grove ∆ PET urban fabric.August = 36.3 °C, ∆ PET palm grove.August = 36.2 °C. The heat
stress level (PET index) evaluated in July is slightly higher in the palm grove than in the urban fabric
∆ PET urban fabric. July = 40.9 °C, ∆ PET palm grove.July = 41.7 °C. The difference is related to higher shaded
area in the urban fabric compared to the palm grove. No significant impact of SVF on the thermal heat stress was found. Additionally, the ‘oasis effect’ on the outdoor thermal comfort was insignificant (during the study period). Furthermore, PET values are more sensitive at midday due to high insolation. Finally, all findings and results of this study apply to the summer season, especially in the warmest months of the year (July and August). Future studies should further investigate the heat stress level in other seasons and months of the year in urban oasis settlements.
Author Contributions: Conceptualization, M.E.M., D.A., and S.A.; methodology, M.E.M., D.A., S.A., and A.A.;
software, M.E.M.; validation, M.E.M., D.A., S.A., and A.A.; formal analysis, M.E.M.; investigation, M.E.M.; resources, M.E.M., D.A., S.A., and A.A..; data curation, M.E.M.; writing—original draft preparation, M.E.M.; writing—review and editing, M.E.M., D.A., S.A., and A.A.; visualization, M.E.M.; supervision, D.A., and S.A. All authors have read and agreed to the published version of the manuscript.
Funding: The authors acknowledge the Ministry of Higher Education of Algeria for providing necessary funds
and resources for the completion of the Ph.D. studies of the first author under the PNE program with the reference no. 19/enseignant/Belgique/2018-2019.
Acknowledgments: We acknowledge the Algerian Ministry of Higher Education for providing a funded
internship to the first author at the University of Liege through the “Programme National Exceptionnel (PNE)” under file no. 19/enseignant/Belgique/2018-2019. We would like to acknowledge the LACOMOFA Laboratory, University of Biskra, and the Sustainable Building Design (SBD) Laboratory at the University of Liege for the use of the monitoring equipment in this research and valuable support during the experiments and data analysis. The authors would also like to thank the University of Biskra, Algeria and the University of Liege, Belgium for their assistance in administrative procedures. As well we would like to acknowledge Professor Andreas Matzarakis for his contribution and help for the RayMan model.
Conflicts of Interest: The authors declare no conflict of interest. The funders had no role in the design of the
study; in the collection, in the analysis, or interpretation of data; in the writing of the manuscript, or in the decision to publish the results.
Appendix A
For the second criterion, the size of built-up space, four different sizes are selected: (a) tiny size, less than 3.0 ha, (b) small size, between 3.0 ha and 10.0 ha, (c) medium size, between 10.0 ha and 20.0 ha, and finally, (d) large size, over 20.0 ha. The selected oases settlements are reported respectively: (a) New Tolga Downtown (22 ha), (b) Old Tolga (14 ha), (c) Old Lichana (4.2 ha) and finally, (d) Old Farfar with 2.5 ha. For the third criterion, the age of the oases settlement fabric is distinguished through two different vintages: Old settlements, built before 1900 (Old Tolga, Old Lichana, Old Farfar), and new settlements built after 1980 (New Tolga Downtown). For the fourth criterion, the relation between the built-up settlement and the Palm Grove, two different relations are established: (a) the heart of the Palm Grove (reference point), and (b) the distance between Palm Grove peripheries and the oases settlement fabric border.
The four selected oases settlement comprise several residential individual buildings. The old neighborhoods 1, 2 and 4 are ancient and unplanned settlements, while Old Tolga is entirely rebuilt by its inhabitants, after 1990. The new oases settlement (3), in the downtown, represents a planned urban settlement. The buildings in the selected neighborhoods are characterized mainly as low-rise developments with two storeys housing units (G+1), which is the most common residential urban typology in Southern Algeria.
References
1. Battesti, V. Jardins au Désert: Évolution des Pratiques et Savoirs Oasiens: Jérid Tunisien; IRD Éditions: Paris,
France, 2005.
2. Hadagha, F.Z.; Farhi, B.E.; Farhi, A.; Petrisor, A.I. Multifunctionality of the oasis ecosystem. Case study:
Biskra Oasis, Algeria. Int. J. Contemp. Urban Aff. 2018, 2, 31–39.
3. Lall, S.V.; Henderson, J.V.; Venables, A.J. Africa’s Cities: Opening Doors to the World; The World Bank:
Washington, DC, USA, 2017.
4. Newman, P.; Beatley, T.; Boyer, H. Resilient Cities: Responding to Peak Oil and Climate Change; Island Press:
Washington, DC, USA, 2009.
5. Kouzmine, Y.; Fontaine, J.; Yousfi, B.-E.; Otmane, T. Etapes de la structuration d’un désert: l’espace saharien
algérien entre convoitises économiques, projets politiques et aménagement du territoire. In Annales de
Géographie; 2009; pp. 659–685.
6. Coté, M. La Ville et le Désert: Le Bas-Sahara Algérien; Karthala Éditions: Paris, France, 2005.
7. Attia, S.; Duchhart, I. Bioclimatic landscape design in extremely hot and arid climates. In Proceedings of
the 27th Conference of Passive and Low Energy Architecture (PLEA) 2011, Louvain-la-Neuve, Belgium, 13–15 July 2011.
8. Aljawabra, F.; Nikolopoulou, M. Influence of hot arid climate on the use of outdoor urban spaces and
thermal comfort: Do cultural and social backgrounds matter? Intell. Build. Int. 2010, 2, 198–217.
9. Attia, S. The Bioclimatic Zones Concept Landscape Design Strategy for site planning in hot arid climates.
In Proceedings of the 3rd CIB International Conference on Smart and Sustainable Built Environment (SABSE). TU-Delft, The Netherlands, 2009.
10. Venhari, A.A.; Tenpierik, M.; Taleghani, M. The role of sky view factor and urban street greenery in human thermal comfort and heat stress in a desert climate. J. Arid Environ. 2019, 166, 68–76.
11. Biqaraz, B.; Fayaz, R.; Naeeni, G.H. A comparison of outdoor thermal comfort in historical and contemporary urban fabrics of Lar City. Urban Clim. 2019, 27, 212–226.
12. Potchter, O.; Ben-Shalom, H.I. Urban warming and global warming: Combined effect on thermal discomfort in the desert city of Beer Sheva, Israel. J. Arid Environ. 2013, 98, 113–122.
13. Cohen, P.; Shashua-Bar, L.; Keller, R.; Gil-Ad, R.; Yaakov, Y.; Lukyanov, V.; Kutiel, P.B.; Tanny, J.; Cohen, S.; Potchter, O. Urban outdoor thermal perception in hot arid Beer Sheva, Israel: Methodological and gender aspects. Build. Environ. 2019, 160, 106169.
14. Elnabawi, M.H.; Hamza, N.; Dudek, S. Thermal perception of outdoor urban spaces in the hot arid region of Cairo, Egypt. Sustain. Cities Soc. 2016, 22, 136–145.
15. Ali-Toudert, F.; Mayer, H. Numerical study on the effects of aspect ratio and orientation of an urban street canyon on outdoor thermal comfort in hot and dry climate. Build. Environ. 2006, 41, 94–108.
16. Johansson, E. Influence of urban geometry on outdoor thermal comfort in a hot dry climate: A study in Fez, Morocco. Build. Environ. 2006, 41, 1326–1338.
17. Middel, A.; Selover, N.; Hagen, B.; Chhetri, N. Impact of shade on outdoor thermal comfort—A seasonal field study in Tempe, Arizona. Int. J. Biometeorol. 2016, 60, 1849–1861.
18. Zhao, Q.; Sailor, D.J.; Wentz, E.A. Impact of tree locations and arrangements on outdoor microclimates and human thermal comfort in an urban residential environment. Urban For. Urban Green. 2018, 32, 81–91. 19. Matzarakis, A.; Mayer, H.; Iziomon, M.G. Applications of a universal thermal index: Physiological
equivalent temperature. Int. J. Biometeorol. 1999, 43, 76–84.
20. Potchter, O.; Cohen, P.; Lin, T.-P.; Matzarakis, A. Outdoor human thermal perception in various climates: A comprehensive review of approaches, methods and quantification. Sci. Total Environ. 2018, 631, 390–406. 21. Binarti, F.; Koerniawan, M.D.; Triyadi, S.; Utami, S.S.; Matzarakis, A. A review of outdoor thermal comfort
indices and neutral ranges for hot-humid regions. Urban Clim. 2020, 31, 100531.
22. Hirashima, S.d.S.; Katzschner, A.; Ferreira, D.G.; de Assis, E.S.; Katzschner, L. Thermal comfort comparison and evaluation in different climates. Urban Clim. 2018, 23, 219–251.
23. Roshan, G.; Almomenin, H.S.; da Silveira Hirashima, S.Q.; Attia, S. Estimate of outdoor thermal comfort zones for different climatic regions of Iran. Urban Clim. 2019, 27, 8–23.
24. Roshan, G.R.; Farrokhzad, M.; Attia, S. Defining thermal comfort boundaries for heating and cooling demand estimation in Iran’s urban settlements. Build. Environ. 2017, 121, 168–189.
25. Matzarakis, A.; Rutz, F.; Mayer, H. Modelling radiation fluxes in simple and complex environments— Application of the RayMan model. Int. J. Biometeorol. 2007, 51, 323–334.
26. Chalfoun, N.V. Sustainable Urban Design in Arid Regions; Integrating Energy and Comfort. In Collaborative
Symposium: Urban Design in Arid Regions; The University of Arizona; Tucson, AZ, USA; The Pontificia
Universidad Catolica De Chile: Santiago, Chile, 2003.
27. Givoni, B.; Noguchi, M.; Saaroni, H.; Potchter, O.; Yaakov, Y.; Feller, N.; Becker, S. Outdoor comfort research issues. Energy Build. 2003, 35, 77–86.
28. Saaroni, H.; Bitan, A.; Dor, E.B.; Feller, N. The mixed results concerning the ‘oasis effect’ in a rural settlement in the Negev Desert, Israel. J. Arid Environ. 2004, 58, 235–248.
29. Potchter, O.; Goldman, D.; Kadish, D.; Iluz, D. The oasis effect in an extremely hot and arid climate: The case of southern Israel. J. Arid Environ. 2008, 72, 1721–1733.
30. Boudjellal, L.; Bourbia, F. An evaluation of the cooling effect efficiency of the oasis structure in a Saharan town through remotely sensed data. Int. J. Environ. Stud. 2018, 75, 309–320.
31. Rchid, A. The effects of green spaces (Palme trees) on the microclimate in arid zones, case study: Ghardaia, Algeria. Energy Procedia, 2012, 18, 10–20.
32. Sellami, M.H.; Sifaoui, M.S. Measurements of microclimatic factors inside the oasis: Interception and sharing of solar radiation. Renew. Energy 1998, 13, 67–76.
33. Ali-Toudert, F.; Djenane, M.; Bensalem, R.; Mayer, H. Outdoor thermal comfort in the old desert city of Beni-Isguen, Algeria. Clim. Res. 2005, 28, 243–256.
34. Balogun, I.A.; Daramola, M.T. The outdoor thermal comfort assessment of different urban configurations within Akure City, Nigeria. Urban Clim. 2019, 29, 100489.
35. TESTO. TESTO 480 Climate Measuring Instrument. Available online: https://static-int.testo.com/media/cf/01/1ff8d8380280/testo-480-Instruction-manual.pdf (30 November 2019).
36. Sebti, M.; Alkama, D.; Bouchair, A. Assessment of the effect of modern transformation on the traditional settlement ‘Ksar’of Ouargla in southern Algeria. Front. Archit. Res. 2013, 2, 322–337.
37. Matzarakis, A.; Rutz, F.; Mayer, H. Modelling radiation fluxes in simple and complex environments: Basics of the RayMan model. Int. J. Biometeorol. 2010, 54, 131–139.
38. Taleghani, M.; Kleerekoper, L.; Tenpierik, M.; van den Dobbelsteen, A. Outdoor thermal comfort within five different urban forms in the Netherlands. Build. Environ. 2015, 83, 65–78.
39. Ali-Toudert, F.; Mayer, H. Effects of asymmetry, galleries, overhanging facades and vegetation on thermal comfort in urban street canyons. Sol. Energy 2007, 81, 742–754.
40. Oke, T.R. Boundary Layer Climates; Routledge: Abingdon, UK, 2002.
41. Lomas, K.J.; Porritt, S.M. Overheating in Buildings: Lessons from Research; Taylor & Francis: Abingdon, UK, 2017.
42. Taleghani, M. Outdoor thermal comfort by different heat mitigation strategies—A review. Renew. Sustain.
Energy Rev. 2018, 81, 2011–2018.
43. Fahmy, M.; Mahdy, M.; Mahmoud, S.; Abdelalim, M.; Ezzeldin, S.; Attia, S. Influence of urban canopy green coverage and future climate change scenarios on energy consumption of urban developments. Energy Reports, 2020, 25, 125.
44. Baruti, M.M.; Johansson, E.; Astrand, J. Review of studies on outdoor thermal comfort in warm humid climates: Challenges of informal urban fabric. Int. J. Biometeorol. 2019, 63, 1449–1462.
45. Semahi, S.; Zemmouri, N.; Singh, M. K.; Attia, S. Comparative bioclimatic approach for comfort and passive heating and cooling strategies in Algeria. Build. Environ. 2019, 161, 106271.
© 2020 by the authors. Licensee MDPI, Basel, Switzerland. This article is an open access article distributed under the terms and conditions of the Creative Commons Attribution (CC BY) license (http://creativecommons.org/licenses/by/4.0/).