HAL Id: tel-02884083
https://pastel.archives-ouvertes.fr/tel-02884083
Submitted on 29 Jun 2020HAL is a multi-disciplinary open access archive for the deposit and dissemination of sci-entific research documents, whether they are pub-lished or not. The documents may come from teaching and research institutions in France or abroad, or from public or private research centers.
L’archive ouverte pluridisciplinaire HAL, est destinée au dépôt et à la diffusion de documents scientifiques de niveau recherche, publiés ou non, émanant des établissements d’enseignement et de recherche français ou étrangers, des laboratoires publics ou privés.
hydromechanical behaviour of bentonite pellet-powder
mixtures
Benjamin Darde
To cite this version:
Benjamin Darde. Experimental and numerical study of the hydromechanical behaviour of bentonite pellet-powder mixtures. Géotechnique. Université Paris-Est, 2019. English. �NNT : 2019PESC1030�. �tel-02884083�
Thèse
soumise pour l’obtention du grade de
Docteur de l’Université Paris-Est
Ecole Doctorale Sciences, Ingénierie et Environnement (SIE)
par
Benjamin Dardé
Experimental and numerical study of the hydromechanical
behaviour of bentonite pellet-powder mixtures
Spécialité : Géotechnique
Préparée à l’École des Ponts ParisTech, laboratoire Navier, équipe Géotechnique
Soutenue le 5 décembre 2019 devant un jury composé de :
Prof. François Chevoir
Ifsttar
Président
Prof. Antonio Gens
Universitat Politècnica de Catalunya
Rapporteur
Dr. Vincent Richefeu
Université Grenoble Alpes
Rapporteur
Prof. Robert Charlier
Université de Liège
Examinateur
Dr. Jean Talandier
Andra
Examinateur
Dr. Patrick Dangla
Ifsttar
Examinateur
Dr. Jean-Noël Roux
Ifsttar
Examinateur
Prof. Jean-Michel Pereira
École des Ponts ParisTech
Invité
Dr. Minh Ngoc Vu
Andra
Invité
Thèse
soumise pour l’obtention du grade de
Docteur de l’Université Paris-Est
Ecole Doctorale Sciences, Ingénierie et Environnement (SIE)
par
Benjamin Dardé
Experimental and numerical study of the hydromechanical
behaviour of bentonite pellet-powder mixtures
Ce travail de thèse a été réalisé au laboratoire Navier à l’École des Ponts ParisTech et financé par l’Andra. Je souhaite remercier sincèrement toutes les personnes qui, par leur aide, leurs conseils ou leur soutien, ont contribué à l’aboutissement de ce travail.
Je remercie les membres du jury pour l’intérêt porté à mon travail et le temps accordé à la lecture du manuscrit. J’ai beaucoup apprécié l’ensemble de nos discussions, qui m’ont permis de réfléchir sur le sujet avec différentes approches et m’ont donné des idées pour continuer à développer certains points dans le futur. Je remercie vivement Antonio Gens et Vincent Richefeu qui m’ont fait l’honneur d’accepter d’être rapporteurs de ma thèse. Je les remercie pour leurs commentaires détaillés et leurs suggestions pertinentes concernant les différentes parties de mon mémoire. Je remercie Robert Chalier d’avoir accepté d’examiner mon travail de thèse. Je le remercie aussi pour nos agréables échanges, scientifiques et non scientifiques, lors des réunions du projet Beacon. Je remercie François Chevoir d’avoir accepté d’être examinateur de la thèse et d’avoir présidé le jury le jour de la soutenance.
Je remercie l’Andra pour le financement de mes travaux de recherche. Je remercie particulièrement Jean Talandier et Minh Ngoc Vu qui ont suivi mes travaux au cours des trois années et m’ont régulièrement conseillé. Jean Talandier m’a également donné la chance de participer au projet Beacon, je l’en remercie. La participation à ce projet m’a beaucoup apporté. Chaque réunion m’a permis de présenter l’avancée de mon travail, d’avoir un aperçu des différents travaux menés sur la bentonite par diverses institutions européennes, et de mieux en comprendre les enjeux, les problématiques et les applications.
Je remercie chaleureusement l’ensemble des membres du laboratoire Navier pour leur accueil. Je remercie particulièrement mes encadrants de thèse, Anh Minh Tang, Patrick Dangla, Jean-Michel Pereira et Jean-Noël Roux. Je les remercie pour leur disponibilité tout au long de la thèse. J’ai apprécié chacune de nos nombreuses discussions, qui m’ont permis d’apprendre énormément au cours de ces trois années, dans des domaines très variés. Au-delà de connaissances scientifiques, ils ont su me transmettre leur passion pour la recherche et c’est sans aucun doute grâce à eux si je souhaite aujourd’hui poursuivre dans cette voie.
Je souhaite exprimer mon immense gratitude à mon directeur de thèse, Anh Minh Tang, pour m’avoir donné l’opportunité de réaliser cette thèse. Je le remercie infiniment pour la confiance qu’il m’a accordée depuis le début de la thèse. Je le remercie pour tous ses conseils, pour toutes ses suggestions concernant l’orientation des travaux. J’ai toujours quitté son bureau avec les idées plus claires et mes éventuels doutes dissipés. Je le remercie aussi pour ses encouragements, qui ont permis de garder ma motivation intacte durant trois ans.
Je remercie l’équipe technique du laboratoire, Emmanuel de Laure, Xavier Boulay, Loïc Lesueur, et particulièrement Baptiste Chabot et Marine Lemaire pour leur aide inestimable dans la partie expérimentale de mon travail.
Je remercie les doctorants pour tous les moments agréables passés ensemble, au laboratoire ou à l’extérieur. J’ai passé trois belles années en votre compagnie. L’ambiance conviviale, l’entraide, le soutien entre doctorants étaient pour moi des conditions idéales pour réaliser la thèse.
Bentonite-based materials are considered as a sealing material in radioactive waste disposal concepts because of their low permeability, radionuclide retention capacity and ability to swell upon hydration, thus filling technological gaps. Within this context, bentonite pellet mixtures have been studied owing to operational convenience. Pellets are laid in the galleries in a dry state as a granular assembly. The mixture progressively becomes homogeneous upon hydration by the pore water of the host rock. Before homogenisation, the granular structure of the material controls the macroscopic behaviour of the mixture.
The present work focuses on the experimental characterisation and numerical modelling of a mixture of bentonite pellet and crushed pellet (powder), in proportion 70/30 in dry mass, a candidate sealing material in the French concept of radioactive waste disposal. The proposition, implementation and validation of a modelling framework, considering features such as the initial granular structure of the material or local heterogeneities of densities, is the main objective of this PhD work.
The influence of the initial granular structure is evidenced by performing suction-controlled swelling pressure tests in the laboratory, using samples of various powder contents. A simple model describing the hydromechanical behaviour of a pellet is proposed from grain-level experimental characterisation, and implemented in a Discrete Element Method (DEM) code. Using DEM and the proposed model, aforementioned swelling pressure tests performed on samples containing no powder are simulated to validate the model. The same method is used to model large pellet assemblies of various pellet densities. Relevant parameters involved in the macroscopic behaviour of pellet mixtures in “granular” state are identified from simulation results and constitutive laws are proposed to describe the hydromechanical behaviour of these materials using a continuum mechanics approach.
The transition from a “granular” state to a “continuous” state is described by criteria involving suction and relative volume fractions of pellet and powder. A modified version of the Barcelona Basic Model is proposed to model the material behaviour following the transition. The proposed model is implemented in the Finite Element Method (FEM) code Bil. Using a single set of parameters, all swelling pressure tests performed in the laboratory are satisfactorily reproduced in FEM simulations along the entire hydration path.
The material behaviour upon hydration in constant volume condition is finally studied at a larger scale by performing mock-up imbibition tests, using various powder contents. Cells have a square section. A glass side and a camera allow the texture of the mixture to be observed during hydration. The dominance of vapour transfer in the saturation process of the material, the influence and evolution of the granular structure upon hydration, and the influence of the powder content on the macroscopic response are notably identified. Transfer laws are proposed to describe the observed material behaviour in the mock-up tests and implemented in Bil.
Performing larger-scale simulations using the proposed hydromechanical model is a perspective arising from this PhD work. Predictive simulations can be performed at the structure scale, considering relevant features such as the initial granular structure and local heterogeneities of density in the sealing material.
Les matériaux à base de bentonite sont envisagés pour la réalisation des ouvrages de fermeture dans les concepts de stockage de déchets radioactifs afin de tirer profit de leur faible perméabilité, leur capacité de rétention de radionucléides et leur potentiel de gonflement lors de l’humidification, qui permet de combler les vides technologiques. Dans ce contexte, les matériaux mis en place sous forme de mélanges de granules (« pellets ») de bentonite sont étudiés car ils présentent moins de contraintes d’installation comparés aux blocs préfabriqués. Les pellets sont disposés dans les galeries à l’état sec et forment un matériau granulaire. Le matériau est humidifié par l’eau issue de la roche encaissante et acquiert une texture homogène. Avant homogénéisation, le caractère granulaire du matériau contrôle son comportement.
Ce travail se concentre sur la caractérisation expérimentale et la modélisation numérique d’un mélange de pellets et pellets concassés (« poudre ») de bentonite en proportion 70/30 en masse sèche, matériau envisagé pour réaliser les ouvrages de fermeture dans le concept français de stockage de déchets radioactifs. La proposition, l’implémentation et la validation d’un modèle de comportement tenant compte de la nature granulaire initiale et d’éventuelles hétérogénéités locales de densité sont les objectifs principaux de ce travail.
L’influence de la nature granulaire initiale est mise en évidence par l’intermédiaire d’essais de pression de gonflement à succion contrôlée au laboratoire. Les essais sont réalisés sur des échantillons préparés à différentes teneurs en poudre. A partir d’une caractérisation expérimentale à l’échelle du pellet, un modèle simple décrivant le comportement hydromécanique du pellet est proposé et implémenté dans un code de calcul utilisant la méthode des Éléments Discrets (DEM). Les essais réalisés au laboratoire sur les échantillons sans poudre sont simulés par la DEM pour valider le modèle proposé. Cette méthode est utilisée pour simuler de larges assemblages granulaires de densités variées soumis à des sollicitations hydromécaniques. Les paramètres influençant le comportement macroscopique des assemblages de pellets à l’état « granulaire » sont identifiés à partir de ces simulations. Une loi de comportement est proposée pour modéliser le matériau comme un milieu continu.
La transition d’un état « granulaire » à un état « continu » est décrite par des critères faisant intervenir la succion et les fractions volumiques relatives des pellets et de la poudre. Une version modifiée du Barcelona Basic Model est proposée pour modéliser le comportement du matériau à l’état « continu », après la transition. Le modèle est implémenté dans le code de calcul par Éléments Finis (FEM) BIL. Les essais de pression de gonflement réalisés au laboratoire sur des échantillons contenant différentes teneurs en poudre sont simulés par FEM de manière satisfaisante, sur l’ensemble du chemin d’humidification, en utilisant un unique jeu de paramètres.
Le comportement du matériau au cours de l’humidification en conditions de volume constant est finalement étudié à plus grande échelle par la réalisation d’essais d’imbibition en modèle réduit au laboratoire, à différentes teneurs en poudre. Les cellules sont de section carrée avec une face vitrée. Une caméra permet l’observation de l’évolution de la texture du matériau au cours de l’humidification. La prédominance des transferts en phase vapeur dans le processus de saturation du matériau, l’influence et l’évolution de la structure granulaire au cours de l’humidification et l’influence de la teneur en poudre sur la réponse macroscopique du mélange sont mis en évidence. Des lois de transferts hydriques sont proposées à partir des résultats et observations expérimentales et implémentées dans le code BIL.
La perspective principale de ce travail est la réalisation de simulations FEM à plus grande échelle en utilisant le modèle développé. Ainsi, des problématiques inhérentes à l’utilisation des mélanges de pellets et poudre, notamment la nature granulaire initiale et les hétérogénéités locales de densité, pourront être prises en compte.
List of Tables ...
xiii
List of Figures ...
xv
List of Notations ...
xxv
List of Symbols ...
xxvii
1
Introduction
... 1
1.1 General context ...1
1.2 Problem statement and objectives of the present work ...3
1.3 Outline of the thesis ...4
2
Literature review ...
7
2.1 Introduction ...7
2.2 Microstructure of compacted bentonites ...7
2.2.1 Structure of montmorillonite clay minerals ...8
2.2.2 Fabric of compacted bentonites ...8
2.2.3 Suction in unsaturated soils ...11
2.2.4 Fabric evolution upon hydration ...15
2.3 Macroscopic response under hydromechanical loading ...22
2.3.1 Hydraulic loading of compacted bentonite ...23
2.3.2 Mechanical loading at constant suction...27
2.3.3 Influence of the stress path ...30
2.3.4 Swelling pressure development upon hydration in confined conditions ...32
2.3.5 Water saturation of compacted bentonites ...37
2.3.6 Water transfer in compacted bentonites ...40
2.4 Particular features of bentonite pellet mixtures ...44
2.4.2 Heterogeneities and homogenisation of pellet mixtures ...46
2.4.3 Influence of the granular structure ...51
2.5 Modelling the behaviour of compacted bentonite on hydration ...56
2.5.1 Stress variables ...56
2.5.2 Barcelona Basic Model ...58
2.5.3 Description of water retention behaviour and transfer laws ...63
2.6 Perspectives regarding the modelling of pellet-powder mixtures ...64
2.6.1 Overview of pellet-powder mixtures characteristics ...64
2.6.2 Limitations of the existing models ...65
2.6.3 Proposition of an experimental and numerical program ...66
3
Suction-controlled swelling pressure tests ...
67
3.1 Introduction ...67
3.2 Material...68
3.2.1 Bentonite pellets ...68
3.2.2 Bentonite powder ...69
3.2.3 Pellet-powder mixtures ...69
3.3 Suction-controlled swelling pressure tests...70
3.3.1 Isochoric cell ...70
3.3.2 Preparation of the samples ...72
3.3.3 Suction-controlled hydration at constant room temperature ...74
3.4 Experimental results ...75
3.4.1 Evolution of swelling pressure as a function of elapsed time ...75
3.4.2 Suction-swelling pressure relationship ...80
3.4.3 Evolution of the granular structure ...84
3.5 Discussion ...86
3.5.1 Final swelling pressure ...86
3.5.2 Influence of the powder content ...87
3.5.3 Influence of the initial granular structure ...89
3.5.4 Influence of the sample preparation ...90
3.5.5 Hydration mechanisms ...91
3.6 Concluding remarks and perspectives ...93
3.6.1 Similitudes and differences between continuous and granular bentonite materials ...93
3.6.2 Limitations of the testing procedure ...93
3.6.3 Modelling the particular features of pellet-powder mixtures ...95
4
Proposition and validation of a DEM-based numerical approach providing insight into
the mechanical behaviour of pellet assemblies ...
97
4.1 Introduction ...97
4.2 Hydromechanical behaviour of a pellet upon partial hydration ...97
4.2.1 Introduction ...97
4.2.2 Material ...98
4.2.3 Experimental methods ...99
4.2.4 Experimental results ...103
4.2.5 Model describing the hydromechanical behaviour of a pellet...115
4.3 Simulations of swelling pressure tests using DEM ...118
4.3.1 Introduction ...118
4.3.2 Description of the proposed simulation method ...119
4.3.3 Numerical simulation results ...125
4.4 Discussion ...130
4.4.1 Hydromechanical behaviour of a single pellet ...131
4.4.2 Validity of the DEM model ...132
4.4.3 Modelling at low suction ...133
4.4.4 Influence of the walls on the measured response ...134
4.4.5 Contribution of DEM to laboratory testing ...135
4.4.6 Contribution of DEM to constitutive modelling of pellet materials ...136
4.5 Conclusions and perspectives ...137
4.5.1 Behaviour of a single pellet upon partial hydration in free-swelling conditions ...137
4.5.2 Behaviour of pellet assemblies upon partial hydration in constant-volume conditions 137 4.5.3 Differences between measured response in the laboratory and intrinsic behaviour ...138
4.5.4 Determination of constitutive laws describing the mechanical behaviour of pellet assemblies ...138
5
Modelling the hydromechanical behaviour of pellet-based bentonite materials ...
139
5.1 Introduction ...139
5.2 Conceptual approach ...139
5.2.1 Description of the material phases ...139
5.2.2 Main notations ...140
5.2.3 Main hypotheses ...143
5.3 DEM simulation of large pellet assemblies ...145
5.3.1 Objectives ...145
5.3.2 Method ...145
5.3.3 Numerical simulation results and discussion ...150
5.3.4 Proposition of a model for the “granular” state ...159
5.4 Transition from “granular” to “continuous” state ...162
5.4.1 Identified parameters ...162
5.4.2 Description of DEM simulations of binary granular mixtures ...164
5.4.3 Results of DEM simulations ...165
5.4.4 Conclusions ...168
5.5 Modelling the “continuous” material mechanical behaviour ...168
5.5.1 Objectives ...168
5.5.2 Modification of the Barcelona Basic Model ...168
5.5.3 Constitutive equations ...169
5.6 Implementation of the model ...171
5.6.1 Introduction ...171
5.6.2 Summary of the model features ...172
5.6.3 Calculation of stress state from total volumetric strain ...174
5.6.4 Microstructural strains ...181
5.7 Validation against experimental results ...182
5.7.1 Determination of the model parameters ...183
5.7.2 Mechanical loading at constant suction in oedometer conditions ...186
5.7.3 Simulation of the swelling pressure tests along the entire hydration path ...188
5.8 Conclusions and perspectives ...193
5.8.1 DEM simulations of large granular assemblies ...194
5.8.3 Modification of the Barcelona Basic Model ...194
5.8.4 Differences between experimental and numerical responses ...195
5.8.5 Transition from granular to continuous state ...195
5.8.6 Water transfer ...196
6
Mock-up imbibition tests and water transfer laws ...
197
6.1 Introduction ...197
6.2 Mock-up imbibition tests in the laboratory ...197
6.2.1 Objectives ...197
6.2.2 Material and methods ...197
6.2.3 Experimental results ...203
6.2.4 Discussion ...216
6.2.5 Conclusions and perspectives ...223
6.3 Proposition of transfer laws ...224
6.3.1 Apparent permeability of the microstructure ...224
6.3.2 Pellet-matrix transfer law ...227
6.3.3 Water transfer within the matrix ...233
6.4 Implementation of pellet-matrix transfer law ...236
6.4.1 Implementation in Bil...236
6.4.2 Simulation of swelling pressure tests ...237
6.5 Conclusion and perspectives ...242
6.5.1 Mock-up imbibition tests ...242
6.5.2 Proposition of transfer laws ...243
6.5.3 Large scale modelling ...243
7
General conclusion ...
245
7.1 Overview of the context ...245
7.2 Contributions of the present work ...245
7.2.1 Overview of the thesis ...245
7.2.2 Limitations of the proposed model ...247
7.3 Perspectives for future work ...247
7.3.2 Macrostructural swelling dependency on the dry density ...248
7.3.3 Water retention behaviour and water transfer ...248
7.3.4 Characterisation of the state transition ...248
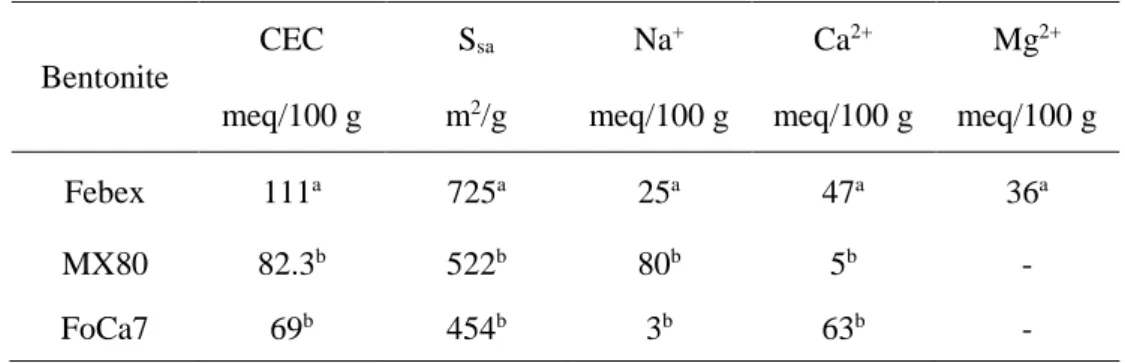
Table 2-1: Main physical properties of MX80, Febex and FoCa7 bentonites ...9
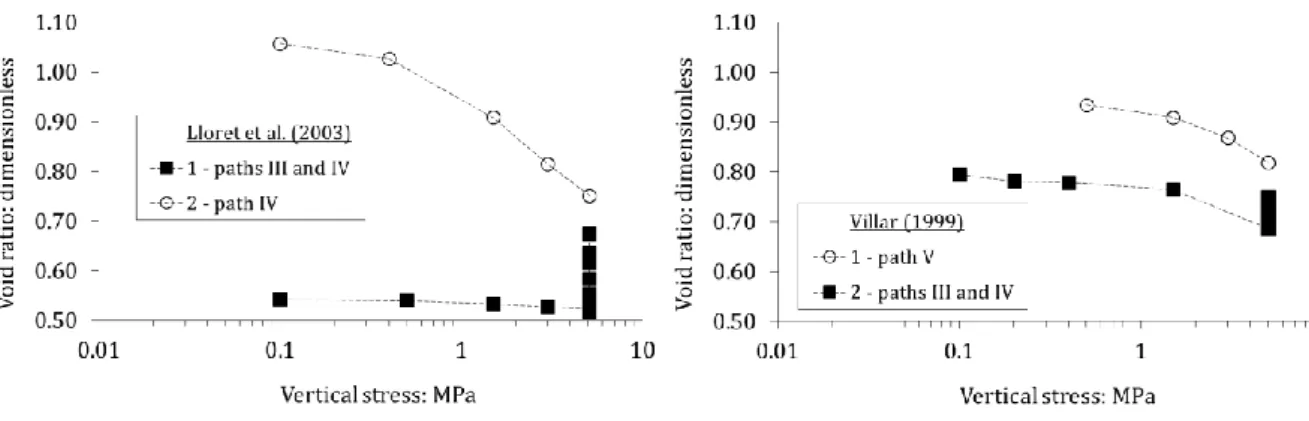
Table 2-2: Main initial characteristics of Lloret et al. (2003) and Villar (1999) samples. ...30
Table 2-3: Stress paths followed by Lloret et al. (2003) and Villar (1999) samples. ...31
Table 2-4: Values of parameters aS and βS of equation 2-6 for three types of bentonite (Wang et al., 2012). ...35
Table 2-5: Estimated water density of adsorbed water layers in Na-montmorillonite and Febex bentonite (Jacinto et al., 2012). ...40
Table 2-6: Overview of the modelling approach for pellet mixtures in the literature. ...63
Table 2-7: Overview of the behaviour of pellet-powder mixtures ...65
Table 3-1: Pellet geometrical properties at initial state. ...68
Table 3-2: Pellet physical properties at initial state...69
Table 3-3: Dimensions of the cell and sensor used in swelling pressure tests. ...71
Table 3-4: Pellet and powder mass laid in the cell to prepare the samples. ...73
Table 3-5: Summary of the characteristics of the suction-controlled swelling pressure tests performed in the laboratory...73
Table 3-6: Salt solutions used for vapour equilibrium technique. ...74
Table 3-7: Hydration paths followed by the samples. ...74
Table 3-8: Summary of the swelling pressure at equilibrium upon suction-controlled hydration for all swelling pressure tests. ...84
Table 3-9: Final measured suction and water content of samples SP0a and SP15a. ...86
Table 3-10: Comparison between estimated final swelling pressure (Wang et al., 2012) and measured swelling pressure. ...87
Table 4-1: 32-mm pellet geometrical properties at initial state. ...98
Table 4-2: 32-mm pellet physical properties at initial state. ...98
Table 4-3: Salt solutions used for vapour equilibrium technique. ...100
Table 4-4: Parameters proposed to describe the hydromechanical behaviour of single MX80 pellets, determined from compression tests. ...118
Table 4-5: Friction values used during preparation and hydration steps in DEM01, DEM02 and DEM03 simulations. 100 simulations are performed for each type of simulation. ...120
Table 5-1: Overview of the phases and levels of structure describing the material in the model. ..140
Table 5-2: Overview of the different notations used to describe the different phases in the model ...140
Table 5-3: Initial state properties of the numerical samples. All samples are cubic and contain 4000
beads. ...148
Table 5-4: Proposed values for the dimensionless parameters describing the behaviour of pellet assemblies. ...158
Table 5-5: Criteria describing the transition from granular to continuous states. ...172
Table 5-6: List of the main equations of the model. ...173
Table 5-7: Main properties of the different MX80 pellet-powder mixtures simulated in the present Chapter. ...183
Table 5-8: Model parameters for the granular state used in the simulations. ...183
Table 5-9: Model parameters for the continuous state used in the simulations ...185
Table 5-10: Model parameters for plasticity and hardening ...186
Table 6-1: Dimensions of the cell and sensor used in swelling pressure tests. ...198
Table 6-2: Main features of MU30, MU15, and MU0 samples. ...203
Table 6-3: Elapsed time from the start of imbibition at which pictures are taken in Figure 6-22; Figure 6-23 and Figure 6-24. ...215
Figure 1-1: Location of Bure on a geological map of the Paris basin and 3D block diagram presenting
the geological context of the Bure underground research laboratory. ...2
Figure 1-2: Expansive clays plugs in drift in the French concept of radioactive waste disposal. ...3
Figure 2-1: Structure of montmorillonite clay minerals. Two “TOT” unit layers with hydrated interlamellar cations are represented (modified after Pusch and Yong, 2006). ...8
Figure 2-2: Schema of a bentonite particle (modified after Pusch and Yong, 2006). ...9
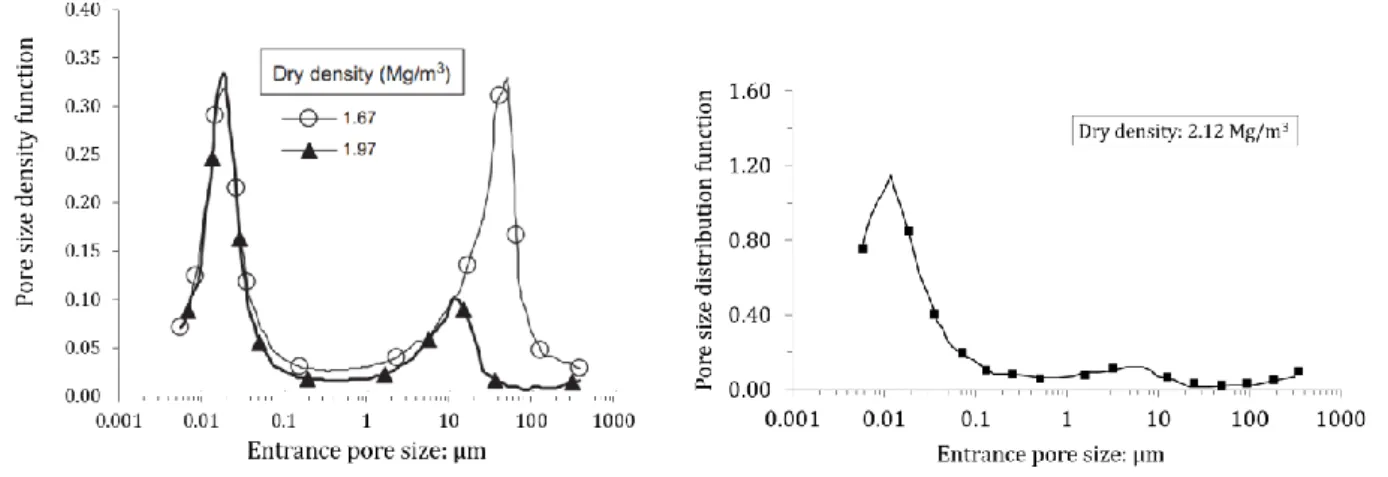
Figure 2-3: Pore size distribution of a MX80 bentonite-sand mixture compacted at two dry densities (left, Wang et al., 2013a) and a MX80 granule at a dry density of 2.12 Mg/m3 (right, Molinero-Guerra et al., 2017). ...10
Figure 2-4: ESEM micrographs of the Černý vrch bentonite equilibrated at a suction of 290.75 MPa. The sample dry densities are 1.27 Mg/m3 (left) and 1.90 Mg/m3 (right) (Sun et al., 2019). ...11
Figure 2-5: The axis-translation method (Delage and Cui, 2000). ...13
Figure 2-6: The osmotic method (Delage and Cui, 2000). ...14
Figure 2-7: The vapour equilibrium technique. ...14
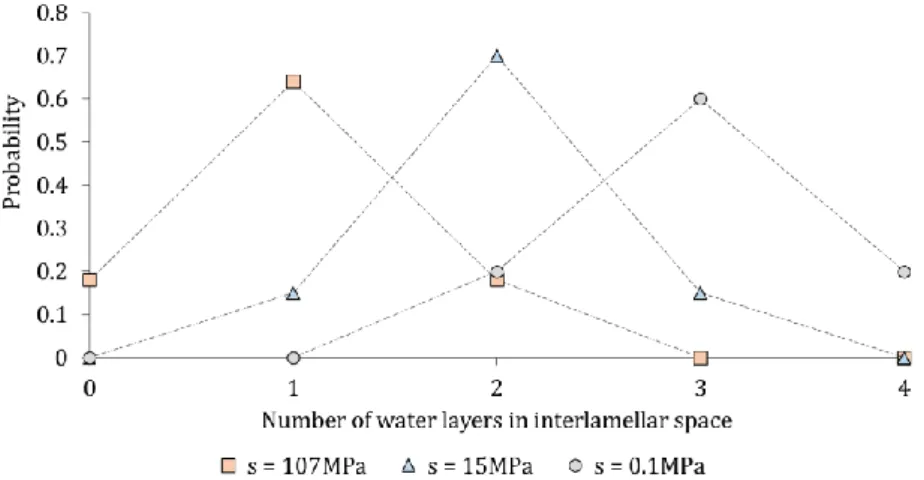
Figure 2-8: Probability distribution of the number of water layers adsorbed in interlamellar space in MX80 bentonite (Saiyouri et al., 2004). ...16
Figure 2-9: Evolution of the average interlayer distance and number of layers per particle in MX80 bentonite upon suction decrease (Saiyouri et al., 2004). ...16
Figure 2-10: Total water content compared to crystalline water content and number of layers per particle as a function of decreasing suction (Saiyouri et al., 2004). ...17
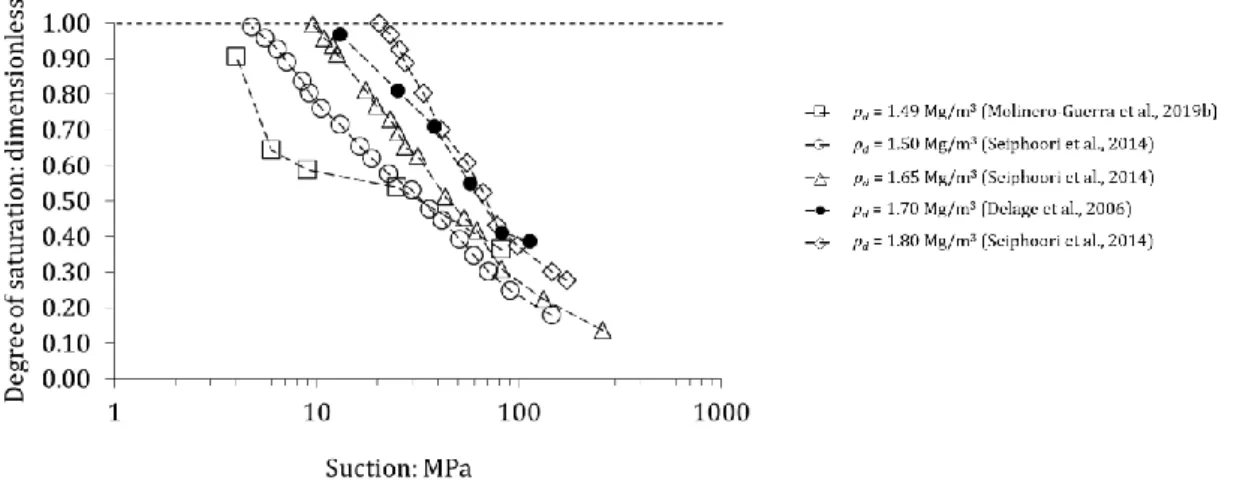
Figure 2-11: Water retention curve of MX80 bentonite materials under different hydration conditions and at different dry densities, upon suction decrease. CV = constant volume, FS = free-swelling, ρd0 = initial dry density. ...18
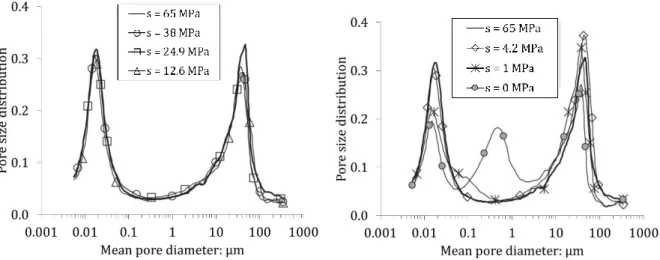
Figure 2-12: Pore size distributions of a MX80 bentonite-sand mixture upon hydration in constant-volume conditions (Wang et al., 2013b). ...19
Figure 2-13: Mercury intrusion porosimeter test results performed on a MX80 granular bentonite compacted at 1.80 Mg/m3 upon hydration in constant-volume conditions (Seiphoori et al., 2014). Left: cumulative void ratio, right: pore size distribution. Dashed line: as compacted state, solid line: saturated. ...20
Figure 2-14: Profile of inter-aggregate porosity deduced from X-ray computed tomography images obtained at different times (left) and initial and final state images of the sample with average inter-aggregate porosity (right). t1 = 7.1 days, t2 = 8.8 days, t3 = 15.8 days, t4 = 19.7 days, t5 = 39.8 days. The initial inter-aggregate porosity was 38 % and decreased to 0 % upon wetting (Massat et al., 2016). ...20
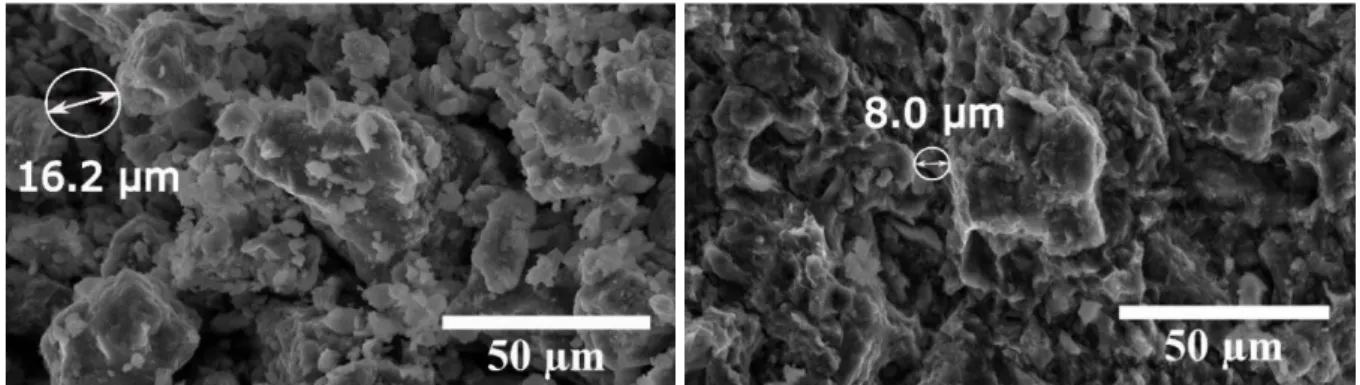
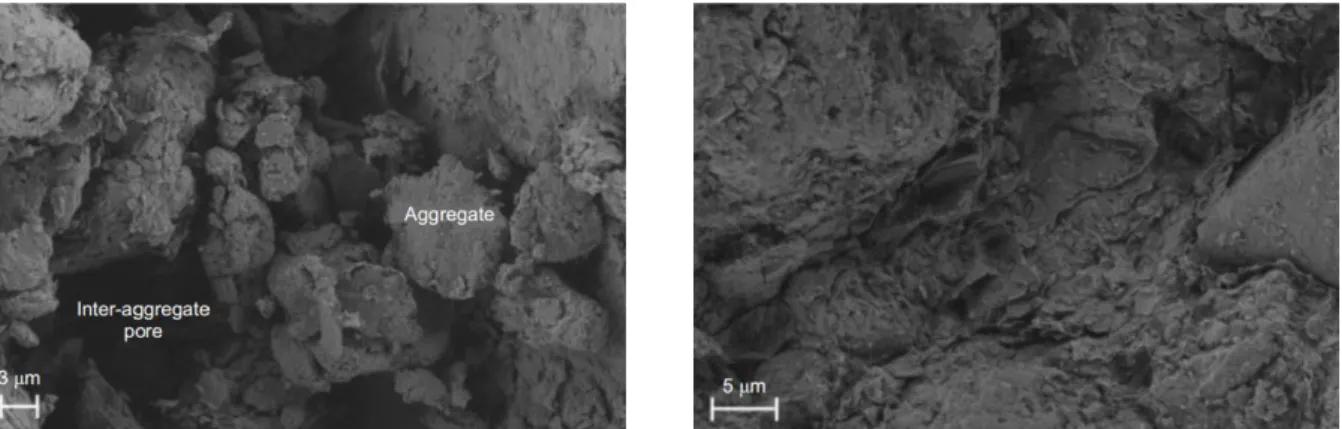
Figure 2-15: SEM micrographs of a sample of granular bentonite compacted at a dry density of 1.80 Mg/m3 characterised by a bimodal pore size distribution (left, as compacted state) and a monomodal pore size distribution (right) (Seiphoori et al., 2014). ...21
Figure 2-16: Honeycomb structure filling inter-aggregate porosity as a result of aggregate exfoliation during hydration (Keller et al., 2014). ...22 Figure 2-17: SEM micrographs of the sample compacted at a dry density of 1.7 Mg/m3 and water
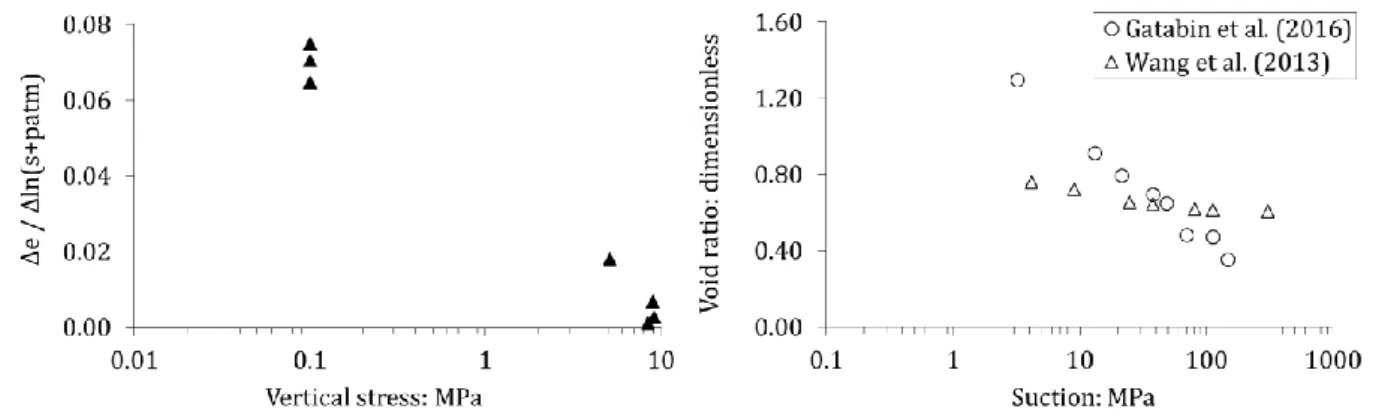
content of 0.125 at 1 day (left) and 90 days (right). Picture width is 40 µm (Delage et al., 2006). ...22 Figure 2-18: Maximum swelling strain of Kunigel bentonite under zero stress as a function of initial dry density (left) and as a function of vertical stress at different initial dry density (right) (Komine and Ogata, 2003). ...23 Figure 2-19: Final swelling strain of Febex bentonite upon wetting under constant vertical stress at different initial dry densities (Villar and Lloret, 2008). ...24 Figure 2-20: Slope of the void ratio-logarithm of suction relationship of Febex bentonite upon hydration (right) (Lloret et al., 2003) and evolution of void ratio upon suction decrease of MX80 bentonite-sand mixtures at initial dry density of 1.96 Mg/m3 and free-swelling conditions (Gatabin et
al., 2016) and at initial dry density of 1.67 Mg/m3 and vertical stress of 0.1 MPa (Wang et al.,
2013a). ...24 Figure 2-21: Evolution of void ratio during wetting of FoCa7 bentonite samples under their respective compaction stress (Cui et al., 2002a). ...25 Figure 2-22: Influence of a wetting-drying path on Febex bentonite at high suction under low vertical stress. White symbols represent initial states (Lloret et al., 2003). ...26 Figure 2-23: Evolution of swelling and shrinkage of a Febex bentonite-sand mixture (initial dry density of 1.50 Mg/m3) with the number of wetting-drying cycles under constant vertical stress of 396
kPa (Alonso et al., 2005). ...27 Figure 2-24: Loading of compacted Febex bentonite under constant suction in oedometer tests (Lloret et al., 2003). Grey solid lines aim at delimiting elastic and elastic-plastic loadings. ...28 Figure 2-25: Apparent preconsolidation pressure at various suction values for three types of compacted expansive soils: compacted Febex bentonite (initial dry density ~1.70 Mg/m3; Lloret et al.,
2003), compacted MX80 bentonite-sand mixture in proportions 70/30 (initial dry density 1.67 Mg/m3;
Wang et al., 2013a), compacted bentonite-silt mixture in proportions 60/40 (initial dry density 1.27 Mg/m3; Cuisinier and Masrouri, 2005). Saturated conditions are plotted as 0.1 MPa of suction. ...29
Figure 2-26: Apparent preconsolidation pressure at saturation for MX80 bentonite materials at various void ratios. After experimental data from Marcial (2003), Villar (2005), Molinero-Guerra et al. (2019b). The dashed blue line corresponds to equation 2-5 with p*
0 = 110 MPa and np = 3.7. ...30
Figure 2-27: Stress paths followed by Lloret et al. (2003) and Villar (1999) samples. ...31 Figure 2-28: Evolution of the void ratio of Febex samples in Lloret et al. (2003) and Villar (1999). ...31 Figure 2-29: Suction controlled swelling pressure tests performed on compacted Febex bentonite. Initial dry densities and suction for SP1, SP2, SP3, and SP4 are: 1.65 Mg/m3 and 424 MPa, 1.63 Mg/m3
and 146 MPa, 1.57 Mg/m3 and 70 MPa, and 1.50 Mg/m3 and 39 MPa, respectively. The two black
dashed lines crossing test results are delimiting the three identified zones (Lloret et al., 2003). ...34 Figure 2-30: Evolution of inter-aggregate porosity and swelling pressure as a function of elapsed time during wetting under constant-volume conditions (Massat et al., 2016). ...34 Figure 2-31: Relationship between dry density and swelling pressure for three different bentonites and estimation using equation 2-6 (Wang et al., 2012). ...35
Figure 2-32: Relationship between swelling pressure and bentonite dry density (equation 2-7) for MX80 based materials (Wang et al., 2012). ...36 Figure 2-33: Influence of the ionic strength of the wetting fluid on the swelling potential of Febex bentonite compacted to a dry density of 1.65 Mg/m3 (Castellanos et al., 2006). ...37
Figure 2-34: Evolution of the degree of saturation of a bentonite-sand mixture (70/30 in dry mass proportions) compacted at an initial dry density of 2.01 Mg/m3 upon hydration in constant-volume and
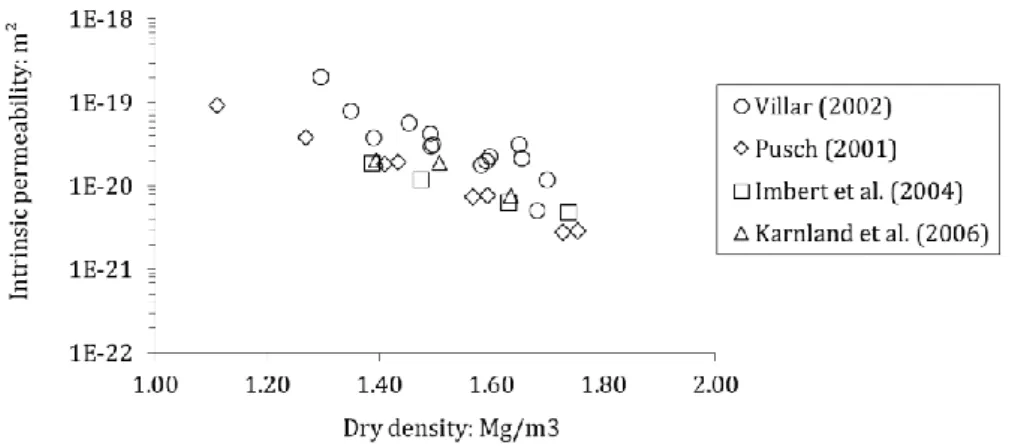
free-swelling conditions (Gatabin et al., 2016). ...38 Figure 2-35: Suction-degree of saturation relationship for MX80 bentonite in constant-volume conditions. ...39 Figure 2-36: Suction-degree of saturation relationship for MX80 bentonite in free-swelling conditions. ...39 Figure 2-37: Water content (left) and dry density (right) profiles in the EB experiment following dismantling (Wieczorek et al., 2017). ...42 Figure 2-38: Unsaturated apparent hydraulic conductivity of a MX80-sand (70/30 in proportions) mixture as a function of decreasing suction (Wang et al., 2013b). ...43 Figure 2-39: Intrinsic permeability of MX80 bentonite in saturated conditions as a function of dry density. ...44 Figure 2-40: 3D reconstruction of a bentonite pellet from X-ray computed tomography images. A crack network is identified and associated to the macroporosity (Molinero-Guerra et al., 2017). ...45 Figure 2-41: Saturated porosity in MX80 bentonite pellet deduced from saturation and MIP test results of Molinero-Guerra et al. (2019a), at different suction: 135.5 MPa (a); 9 MPa (b); 4.2 MPa (c); 1 MPa (d). ...46 Figure 2-42: Pore size distribution of a pelletised Febex bentonite (Hoffmann et al., 2007). ...47 Figure 2-43: Distribution of density in a bentonite pellet-powder mixture at dry state, obtained from X-ray computed tomography results (van Geet et al., 2005). ...47 Figure 2-44: Grain size distribution before and after compaction to a dry density of 1.50 Mg/m3
(Hoffmann et al., 2007). ...48 Figure 2-45: Evolution of a pelletised Febex bentonite sample upon hydration, at four degrees of saturation (Sr) (Hoffmann et al., 2007). ...49 Figure 2-46: Evolution of the granular structure of a MX80 bentonite pellet-powder mixture during hydration (Molinero-Guerra et al., 2018a). ...49 Figure 2-47: Permeability of a pelletised Febex bentonite compacted at a dry density of 1.3 Mg/m3
as a function of the degree of saturation (Hoffmann et al., 2007). ...50 Figure 2-48: MX80 pellet-powder mixture prepared for hydration test, at initial state. Local heterogeneities of density are clearly observable. SP xx labels correspond to the position of pressure sensors, xx being the elevation in mm (Molinero-Guerra et al., 2018b). ...51 Figure 2-49: Evolution of the void ratio of an ideal binary mixtures with dL ≫ dS. The blue area
corresponds to the behaviour mainly controlled by large particles. The red area corresponds to the behaviour mainly controlled by small particles. ...53
Figure 2-50: Reasons for underestimation of void ratio using equations 2-12 and 2-13: insertion of particles not small enough (left and centre) and wall effect inducing a low density zone near large particles (right). ...53 Figure 2-51: Results of suction-controlled oedometer tests performed by Molinero-Guerra et al. (2019b) on a pellet-powder mixture: void ratio-vertical stress relationship (left) and volumetric strain-elapsed time relationship following loading. Negative volumetric strains indicate swelling. ...54
Figure 2-52: Swelling pressure test results performed on pelletised Febex bentonite (Hoffmann et al., 2007). ...55 Figure 2-53: Example of stress path in the s-p plane and coupling between SI and LC. ...61 Figure 3-1: Diagram of the pellets used in the present work. ...68 Figure 3-2: Assembly of the MX80 pellets used in the present work. ...69 Figure 3-3: Diagram of the isochoric cell designed for swelling pressure tests. ...71 Figure 3-4: Picture of the isochoric cell used for swelling pressure tests. ...71 Figure 3-5: Sketch of the suction-controlled system. Red arrows represents humid air circulation. 75 Figure 3-6: Swelling pressure as a function of elapsed time for test SP30a. The dots on the solid line are the values considered at equilibrium. ...76 Figure 3-7: Swelling pressure as a function of elapsed time for test SP15a. The dots on the solid line are the values considered at equilibrium. ...77 Figure 3-8: Swelling pressure as a function of elapsed time for test SP15b. The dots on the solid line are the values considered at equilibrium. ...78 Figure 3-9: Swelling pressure as a function of elapsed time for test SP0a. The dots on the solid line are the values considered at equilibrium. ...79 Figure 3-10: Swelling pressure as a function of elapsed time for test SP0b. The dots on the solid line are the values considered at equilibrium. ...79 Figure 3-11: Swelling pressure as a function of decreasing suction for test SP30a. ...81 Figure 3-12: Swelling pressure as a function of decreasing suction for test SP15a. ...81 Figure 3-13: Swelling pressure as a function of decreasing suction for test SP15b. ...82 Figure 3-14: Swelling pressure as a function of decreasing suction for test SP0a. ...83 Figure 3-15: Swelling pressure as a function of decreasing suction for test SP0b. ...83 Figure 3-16: Picture of samples SP0a and SP0b after dismantling. a: SP0a equilibrated at 9 MPa of suction; b: SP0b equilibrated at 4 MPa of suction; c: SP0a removed from the isochoric cell. ...85 Figure 3-17: Picture of SP15a sample after dismantling. Left: Top of the sample in the cell, right: sample removed from the isochoric cell. The sample lost its integrity. ...86 Figure 3-18: Comparison of SP15b; SP0a and SP0b test results. ...88 Figure 3-19: Comparison of SP30a; SP15b; SP0a and SP0b test results. Left: semi-logarithmic plot, right: logarithmic-logarithmic plot. ...88
Figure 3-20: Comparison of SP0a and SP0b test results. The vertical dashed line correspond to the suction at which the material has been observed to be granular. ...89 Figure 3-21: Comparison of SP15a and SP15b test results. ...90 Figure 3-22: Interpretation of the experimental results in terms of involved mechanisms. It is not clear if a “granular-continuous” transition occurred in “dense” powder samples or if only the “continuous” behaviour was observed. ...92 Figure 4-1: Picture of an assembly of 32-mm pellet. ...99 Figure 4-2: Desiccator used for the vapour equilibrium technique. ...100 Figure 4-3: Picture of a 32-mm pellet following equilibrium at a controlled suction of 9 MPa. Left: Pellet height; Right: Pellet diameter. ...101 Figure 4-4: Load frame used for the compression test. Left: Picture; Right: Diagram. ...101 Figure 4-5: Compression directions. Left: Axial tests; Right: Radial tests. ...102 Figure 4-6: Evolution of 7-mm pellet water content upon hydration at controlled relative humidity in the desiccators. ...103 Figure 4-7: Evolution of water content upon suction decrease for three MX80 pellets in free-swelling conditions. ...104 Figure 4-8: Evolution of the degree of saturation upon suction decrease for three MX80 pellets. .105 Figure 4-9: Experimental results for axial strain and radial strain of 7-mm pellets. ...105 Figure 4-10: Evolution of mean radial strain, mean axial strain, and corresponding volumetric strain of 7-mm pellet upon suction decrease. The red dashed line is the model prediction (see 4.2.5). ...106 Figure 4-11: Evolution of mean radial strain, mean axial strain, and corresponding volumetric strain of 32-mm pellet upon suction decrease. The red dashed line is the model prediction (see 4.2.5). ...106 Figure 4-12: Evolution of total void ratio of pellets upon suction decrease...107 Figure 4-13: Pictures of 32-mm pellets at equilibrium at different suctions. Left: 59 MPa; Centre: 40 MPa; Right: 13 MPa. ...107 Figure 4-14: Picture of 7-mm pellets at equilibrium at 9 MPa suction. ...107 Figure 4-15: Axial test results for 7-mm pellets. Solid black lines are the experimental force-displacement relationships. The dashed red lines are the relationship obtained through equation 4-5 for a given value of E. Tests are performed at different suctions: a) 89 MPa; b) 82 MPa; c) 59 MPa; d) 57 MPa; e) 40 MPa; f) 38 MPa; g) 25 MPa; h) 13 MPa; i) 9 MPa. ...109 Figure 4-16: Axial test results for 32-mm pellets. Solid black lines are the experimental force-displacement relationships. The dashed red lines are the relationship obtained through equation 4-5 for a given value of E. Tests are performed at different suctions: a) 107 MPa (equilibrium with laboratory conditions); b) 82 MPa; c) 59 MPa; d) 40 MPa; e) 25 MPa; f) 13 MPa; g) 9 MPa. ...110 Figure 4-17: Determination of E in radial tests using equation 4-6. ...111 Figure 4-18: Radial test results for 7-mm pellets. Solid black lines are the experimental force-displacement relationships. Tests are performed at different suctions: a) 89 MPa; b) 82 MPa; c) 59 MPa; d) 57 MPa; e) 40 MPa; f) 38 MPa; g) 25 MPa; h) 13 MPa; i) 9 MPa. ...113
Figure 4-20: Evolution of the experimental results for E in axial and radial tests for the 7-mm pellet. ...114
Figure 4-21: Evolution of the experimental results for E in axial and radial tests for the 32-mm pellet. ...114
Figure 4-22: Experimental results for pellet (7 mm) strength upon suction decrease in axial and radial directions. Red dashed lines represent the model predictions for RA(s) and RR(s). ...115
Figure 4-23: Experimental results for pellet (32 mm) strength upon suction decrease in axial and radial directions. Red dashed lines represent the model predictions for RA(s) and RR(s). ...115
Figure 4-24: Relationship between pellet strength and pellet Young modulus. Experimental results for 7-mm pellet. The red dashed lines represent the model predictions. ...116 Figure 4-25: Relationship between pellet strength and pellet Young modulus. Experimental results for 32-mm pellet. The red dashed lines represent the model predictions. ...117 Figure 4-26: Sketch of two spheres in contact in DEM simulations ...121 Figure 4-27: Normal force-normal deflection relationship in DEM simulations. ...122 Figure 4-28: Diagram representing the tangential reaction-tangential displacement relationship in DEM simulations. ...123 Figure 4-29: Preparation step in DEM simulations. ...124 Figure 4-30: Dimensions of the simulated cell. ...124 Figure 4-31: Evolution of the apparent swelling pressure in DEM01, DEM02 and DEM03 numerical samples and SP0a and SP0b experimental samples upon suction decrease. The mean values determined over 100 simulations are plotted for numerical results...125 Figure 4-32: Evolution of the apparent swelling pressure and contact plasticity in DEM01 numerical samples upon suction decrease. The mean values determined over 100 simulations are plotted. ...126 Figure 4-33: Evolution of the apparent swelling pressure and contact plasticity in DEM02 numerical samples upon suction decrease. The mean values determined over 100 simulations are plotted. ...126 Figure 4-34: Evolution of the apparent swelling pressure and contact plasticity in DEM03 numerical samples upon suction decrease. The mean values determined over 100 simulations are plotted. ...127 Figure 4-35: Evolution of the coordination number in numerical samples upon suction decrease. The mean values determined over 100 simulations are plotted. ...128 Figure 4-36: Evolution of the coefficient of variation of some features of DEM01 numerical samples during hydration: a) swelling pressure; b) coordination number; c) proportion of plastic contacts. ....129 Figure 4-37: Evolution of apparent swelling pressure in DEM01 numerical samples upon suction decrease for two diameter ratios. ...130 Figure 4-38: Variability of the calculated swelling pressure as a function of the diameter ratio (Dsensor / aeq 0). Left: overview, right: zoom on diameter ratio between 3 and 6. ...130
Figure 4-39: Evolution of the bulk modulus and volumetric strain of a MX80 aggregate, 7-mm pellet, and 32-mm pellet from values of αm and βm determined by Tang and Cui (2009) and in the present study. ...131
Figure 4-40: Mean elastic normal deflection increment as a function of radius increment for particles-upper wall contacts in simulations DEM01, DEM02, DEM03. The mean values, determined over 100 simulations, are plotted. The coloured dots correspond to the occurence of the peak of swelling pressure. The black dashed line correspond to a “1:1” line, i.e. each radius increment induces a similar increment in mean elastic normal deflection, thus no rearrangement of the granular structure, provided that contacts are elastic. ...134 Figure 4-41: Evolution and variability of apparent swelling pressure (Dsensor / aeq 0 = 4) and mean
stress upon suction decrease in DEM01 simulations...135 Figure 5-1: Representation of the initial states of all numerical samples, along with DEM01 initial state for comparison. ...148 Figure 5-2: Evolution of the granular assembly volumetric strain as a function of the dimensionless pressure parameter during isotropic compression in A-samples. ...151 Figure 5-3: Evolution of the granular assembly volumetric strain as a function of the dimensionless pressure parameter during isotropic compression in B-samples. ...151 Figure 5-4: Evolution of the granular assembly volumetric strain as a function of the dimensionless pressure parameter during isotropic compression in C-samples. ...151 Figure 5-5: Evolution of the granular assembly volumetric strain as a function of the dimensionless pressure parameter during isotropic compression in D-samples. ...152 Figure 5-6: Evolution of the granular assembly volumetric strain as a function of the dimensionless pressure parameter during isotropic compression in J-samples. ...152 Figure 5-7: Evolution of the proportion of plastic contacts in the granular assembly as a function of the dimensionless pressure parameter during isotropic compression in A-samples. ...153 Figure 5-8: Evolution of the proportion of plastic contacts in the granular assembly as a function of the dimensionless pressure parameter during isotropic compression in B-samples. ...154 Figure 5-9: Evolution of the proportion of plastic contacts in the granular assembly as a function of the dimensionless pressure parameter during isotropic compression in C-samples. ...154 Figure 5-10: Evolution of the proportion of plastic contacts in the granular assembly as a function of the dimensionless pressure parameter during isotropic compression in D-samples. ...154 Figure 5-11: Evolution of the proportion of plastic contacts in the granular assembly as a function of the dimensionless pressure parameter during isotropic compression in J-samples. ...155 Figure 5-12: Evolution of the coordination number as a function of the dimensionless pressure parameter in A- and B-samples. ...156 Figure 5-13: Evolution of the granular assembly volumetric strain as a function of the dimensionless pressure parameter during isotropic compression in A1- and B1-samples. ...156 Figure 5-14: Comparison of the volumetric strains calculated upon isotropic compression for A1, B1, C1, D1, and J1 samples. The red dashed line corresponds to the model predictions for elastic contacts. ...157 Figure 5-15: Relationship between mg* and Φ1 0 for all simulation results. ...158
Figure 5-16: Relationship between fMm obtained for all types of samples (dots) and εv1 (dashed line)
Figure 5-17: Evolution of mean stress as a function of decreasing suction in the simulation of binary granular mixtures using DEM. Dots represent the mean value for five samples while dashed lines represent the interval defined by two standard deviations. ...165 Figure 5-18: Contribution of the pellet assembly without powder grains and of the powder grain assembly without pellets to the total mean stress developed in the samples upon suction decrease. Mean values for the five samples are plotted. ...166 Figure 5-19: Evolution of rvf and rms as functions of decreasing suction in the five samples. Mean
values are plotted. ...167 Figure 5-20: Values of κs used in the simulations as functions of the material initial dry density. 185
Figure 5-21: Mesh and displacement boundary conditions used in the simulation of the oedometer test. ...187 Figure 5-22: Comparison between experimental results of a constant suction mechanical loading in oedometer and numerical modelling of these latter. Left: comparison of results at identical vertical stress; right: evolution of void ratio in the simulation and transition across three domains: granular and “elastic contacts”, granular and “plastic contacts”, continuous. ...188 Figure 5-23: Mesh and displacement boundary conditions used in the simulation of the swelling pressure tests...189 Figure 5-24: Comparison between swelling pressure test results and numerical simulation of these latter for the 70/0 mixture. ...191 Figure 5-25: Comparison between swelling pressure test results and numerical simulation of these latter for the 70/15 mixture. ...191 Figure 5-26: Comparison between swelling pressure test results and numerical simulation of these latter for the 70/30 mixture. ...192 Figure 5-27: Comparison of all experimental and numerical results of swelling pressure tests. ....193 Figure 6-1: Diagram of the imbibition cell. ...198 Figure 6-2: Picture of the imbibition cell. ...199 Figure 6-3: MU0 sample during the preparation step. ...200 Figure 6-4: Picture of the MU0 sample following the preparation step. ...201 Figure 6-5: Picture of the MU15 sample following the preparation step. ...201 Figure 6-6: Picture of the MU30 sample following the preparation step. ...202 Figure 6-7: Picture of the three cells and the framework of the black box following the preparation step. ...202 Figure 6-8: Picture of the three samples at initial state. ...203 Figure 6-9: Evolution of the infiltrated volume of water as a function of elapsed time for the three imbibition tests (left) and zoom after 300 days of imbibition (right). ...204 Figure 6-10: Evolution of relative humidity in MU0 imbibition test as a function of elapsed time, at four different elevations. ...205 Figure 6-11: Relative humidity in MU0 imbibition test as a function of elevation, at five different elapsed times. ... 205
Figure 6-12: Evolution of relative humidity in MU15 imbibition test as a function of elapsed time, at four different elevations. ...206 Figure 6-13: Relative humidity in MU15 imbibition test as a function of elevation, at six different elapsed times. ...206 Figure 6-14: Evolution of relative humidity in MU30 imbibition test as a function of elapsed time, at four different elevations. ...207 Figure 6-15: Relative humidity in MU30 imbibition test as a function of elevation, at five different elapsed times. ...207 Figure 6-16: Swelling pressure as a function of elapsed time at different elevations in MU0 test. 208 Figure 6-17: Profile of swelling pressure at different elapsed times in MU0 test. ...208 Figure 6-18: Swelling pressure as a function of elapsed time at different elevations in MU15 test. ...209 Figure 6-19: Profile of swelling pressure at different elapsed times in MU15 test. ...210 Figure 6-20: Swelling pressure as a function of elapsed time at different elevations in MU30 test. ...210 Figure 6-21: Profile of swelling pressure at different elapsed times in MU30 test. ...211 Figure 6-22: Pictures of the 70/0 sample at different elapsed time during imbibition. ...212 Figure 6-23: Pictures of the 70/15 sample at different elapsed time during imbibition. ...213 Figure 6-24: Pictures of the 70/30 sample at different elapsed time during imbibition. ...214 Figure 6-25: Estimation of pellet vertical displacements in MU0 test. ...215 Figure 6-26: Peak swelling pressure as a function of relative humidity in MU0, MU15, and MU30 tests. ...217 Figure 6-27: Peak swelling pressure as a function of (macrostructural) suction in MU0, MU15, and MU30 tests. ...217 Figure 6-28: Identified dry inter-pellet voids in MU0 test after 1.5 year of imbibition. ...218 Figure 6-29: Water fluxes at the bottom of the cell in MU0, MU15 and MU30 tests. ...219 Figure 6-30: Picture of the 70/30 mixtures following MU30 dismantling after 235 days: a) z = ~60 mm; b) z = ~80 mm; c) z = ~110 mm. ...221 Figure 6-31: Measured suction and water content as functions of elevation in dismantled MU30 test. ...222
Figure 6-32: Corrected suction, swelling pressure, and measured relative humidity as functions of elevation in dismantled MU30 test. ...222 Figure 6-33: Water retention curve of the 70/30 mixture in the dismantled MU30 test compared with free-swelling pellets. Mixture values are obtained at different elevations. The dashed blue line represents the theoretical final water content. ...223 Figure 6-34: Mesh used for the FEM simulations of a single pellet hydration to determine microstructural permeability. ...225
Figure 6-35: Numerical results of the evolution of microstructural suction in the pellet as a function of elapsed time, under boundary conditions of MU30 tests and with kint 1 = 10-23 m², compared with
experimental results. ...226 Figure 6-36: Characteristic time of transfer as a function of suction for two values of kint 1. ...228
Figure 6-37: Mesh used for the FEM simulations of the hydration of a single pellet to determine the transfer coefficient. ...229 Figure 6-38: Evolution of the profile of suction in the pellet with time. The profile is homogeneous at t = τ (4756300 s). ...230 Figure 6-39: Mass exchange as a function of time during a step of suction decrease. It is highlighted that the equilibrium can be reached before t = τ. ...230 Figure 6-40: Evolution of βMm as a function of suction for varying lc/r (a), varying kint 1 (b), and
varying N (c). ...232 Figure 6-41: Comparison of βMm obtained in FEM simulations and values obtained from equation 6-8. ...232 Figure 6 42: Sketch of water transfer in pellet-powder mixtures described in the present section. Red arrows represent vapour transfer, Green arrows represent liquid transfer, blue arrows represent pellet-matrix exchanges, and yellow arrow represents powder-macropores transfer (equilibrium). Left: mixture scale; Centre: pellet scale; Right: powder grain scale. ...233 Figure 6-43: Comparison of experimental data for bentonite intrinsic permeability and model prediction for the matrix using kint 1 = 10-23 m²; kA = 7 m3/Mg and kB = 7.5x10⁷. Dashed line represents
model predictions. ...235 Figure 6-44: Comparison of FEM results and experimental results for the 70/0 material and two values of βH. ...238
Figure 6-45: Comparison of FEM results and experimental results in the swelling pressure-suction (s2) plane for βH = 5x10⁵ kg-1 Pa-0.5, βH = 5x10⁶ kg-1 Pa-0.5, and βH → ∞ for the 70/0 material. ...239
Figure 6-46: Evolution of pellet suction as a function of elapsed time in the simulation for βH = 5x10⁶
kg-1 Pa-0.5; β
H = 5x10⁵ kg-1 Pa-0.5 and βH → ∞ for the 70/0 material. ...239
Figure 6-47: Comparison of FEM results and experimental results for the 70/15 material and two values of βH. ...240
Figure 6-48: Comparison of FEM results and experimental results in the swelling pressure-suction (s2) plane for βH = 5x10⁵ kg-1 Pa-0.5, βH = 5x10⁶ kg-1 Pa-0.5, and βH → ∞ for the 70/15 material. ...240
Figure 6-49: Evolution of pellet suction as a function of elapsed time in the simulation for βH = 5x10⁶
kg-1 Pa-0.5; β
H = 5x10⁵ kg-1 Pa-0.5 and βH → ∞ for the 70/15 material. ...240
Figure 6-50: Comparison of FEM results and experimental results for the 70/30 material and two values of βH. ...241
Figure 6-51: Comparison of FEM results and experimental results in the swelling pressure-suction (s2) plane for βH = 5x10⁵ kg-1 Pa-0.5, βH = 5x10⁶ kg-1 Pa-0.5, and βH → ∞ for the 70/30 material. ...241
Figure 6-52: Evolution of pellet suction as a function of elapsed time in the simulation for βH = 5x10⁶
kg-1 Pa-0.5; β
BBM: Barcelona Basic Model BExM: Barcelona Expansive Model Ca: Calcium
CEC: Cation exchange capacity CV: Constant-volume
DEM: Discrete Element Method EB: Engineered Barrier experiment
EDS: Energy-Dispersive Xray Spectroscopy
ESEM: Environmental scanning electron microscope
FEBEX: Full scale high level waste Engineered Barrier experiment FEM: Finite Element Method
FIB-nt: Cryo-Focused Ion Beam nanotomography FS: Free-swelling
LC: Loading-Collapse (BBM)
LVDT: Linear variable differential transformer Mg: Magnesium
MIP: Mercury intrusion porosimetry Na: Sodium
PEG: Polyethylene glycol PSD: Pore size distribution
REV: Representative Elementary Volume SD: Suction Decrease (BBM)
SEM: Scanning electron microscope SI: Suction Increase (BBM)
Ssa: Specific surface area
URL: Underground research laboratory WRC: Water retention curve
( )
̅̅̅̅̅: Mean value
A: Water retention parameter
aeq: Equivalent diameter of modelled pellets
aeq 0: Initial equivalent diameter of modelled pellets
aeq f: Final equivalent diameter of modelled pellets
aeq i: Equivalent diameter of modelled pellets at step i
aS: Model parameter relating final swelling pressure to dry density
B: Bentonite proportion in mixture
C: Constitutive tensor
C: Transfer coefficient
CA: Model parameter relating pellet axial strength to pellet Young modulus
Cc: Virgin compression stiffness parameter
CR: Model parameter relating pellet radial strength to pellet Young modulus
Cs: Unloading/reloading stiffness parameter Ctr: Micro-macro transfer coefficient
CV: Coefficient of variation D: Pellet diameter
D: Damage coefficient dL: Diameter of large particles
dS: Diameter of small particles
Dsensor: Sensor diameter
Dvap: Diffusion coefficient of vapour in air
E: Young modulus
E*: Equivalent Young modulus
e: Void ratio
e0: Void ratio at initial state
e1: Pellet void ratio in FEM
e2: Powder void ratio in FEM
eL: Void ratio of the assembly of large particles
eM: Macrostructural void ratio
em: Microstructural void ratio
emin: Theoretical minimum void ratio
eS: Void ratio of the assembly of small particles
esub: Void ratio obtained by substitution mechanism
f: BExM interaction function F: Yield surface in the BBM
𝐹̅: Mean value of the contact force in a granular assembly
Fij: Contact force between two particles i and j
fmA: Model parameter
Fmax: Maximum force applied on a particle in DEM
fmB: Model parameter
fMm: Ratio of granular assembly volumetric strain to particle volumetric strain
Fnet: Net force applied on a particle in DEM
fNR: Test function in the Newton-Raphson procedure
FT: Tangential reaction vector
FT: Norm of the tangential reaction vector
fε: Parameter describing the compressibility of the granular assembly
fεA: Model parameter
fεB: Model parameter
G: Plastic potential
Gs: Specific gravity of secondary material in mixture
h: height of the cylinder part of the pellet Hcell: Height of the cell
Hcell 0: Initial height of the cell
hw: Water head
I: Identity matrix
I: Dimensionless inertia parameter in DEM simulation i: Iteration
ivap: Diffusive flux vector for vapour in air
K: Apparent hydraulic conductivity kA: Matrix permeability parameter
kB: Matrix permeability parameter
kint: Intrinsic permeability
kint 1: Intrinsic permeability of the pellet phase in FEM
Km: Microstructural bulk modulus
kr: Relative permeability
ks: Parameter describing the increase of cohesion with suction
lc: Characteristic length of the mesh in FEM
M: Slope of the critical state line in the modified Cam Clay model m: Water retention parameter
m1: Mass of the pellet phase in FEM
mg: Dimensionless pressure parameter
mg*: Dimensionless pressure parameter at pellet strength
ml: Liquid water mass
mp: Mass of a particle in DEM
mpel: Pellet mass
mpow: Powder mass
mvap: Vapour mass
Mw: Molecular mass of water
mw: Water mass
N: In FEM simulations, number of suction decrease steps
N: Elastic normal force at contact in DEM n: Water retention parameter
Nc: Number of contacts
Nc 1: Number of particle-particle contacts
Nc 2: Number of particle-wall contacts
np: Model parameter
Np: Number of particles
Nv: Viscous component of the contact force
p: Mean stress
p’: Effective mean stress
p’m: Microstructural effective mean stress
p0(s): Apparent preconsolidation pressure at suction s
p0: Saturated apparent preconsolidation pressure
p0*: Model parameter
p1’: Effective mean stress in pellets in FEM
p2’: Effective mean stress in powder in FEM
patm: Atmospheric pressure
pc: BBM reference stress
pF: Potential of free energy pg: Gas pressure
pm: Microstructural mean stress
ps(s): Intersection of the yield surface and p axis in the BBM at suction s
PS*: Computed swelling pressure at equilibrium in DEM simulations
pvap: Partial pressure of vapour
pw: Water pressure
q: Advective flux vector
q: Deviatoric stress
ql: Advective flux vector for liquid water
R: Ideal gas constant
R*: Equivalent radius in contact law
r: Constant related to the ratio of λ(s→∞) to λ(0) in the BBM r: Equivalent radius of a pellet in FEM
𝑟̅: Average distance between two particle centres in DEM
r0: Initial equivalent radius in FEM
r0: Initial distance between two particle centres in DEM
RA: Axial strength of pellet
rc: Curvature radius
RH: Relative humidity
rij: Vector joining the centres of two particles i and j in contact in DEM
rms: Ratio of mean stress in DEM simulations of binary mixtures
rvf: Ratio of volume fraction in DEM simulations of binary mixtures
rvf*: Threshold ratio of volume fraction in the granular-continuous transition
s: Soil suction
s*: Threshold soil suction in the granular-continuous transition
s0: Suction yield locus in the BBM
s1: Suction in pellets in FEM
s2: Suction in matrix in FEM
Sg: Degree of saturation of the gas phase
si: Suction measured in pellets at initial state
si pow: Suction measured in powder at initial state
sm: Matric suction
sm: Microstructural suction
sm 0: Microstructural suction at initial state
so: Osmotic suction
Sr: Degree of saturation of liquid water
st: Total suction
T: Thermodynamic temperature
t: time
u: Displacement field
uN: Normal displacement in compression tests
w: Gravimetric water content
wa: Gravimetric water content of secondary material
wi: Gravimetric water content measured in pellet at initial state pellet
wi pow: Gravimetric water content measured in powder at initial state
wm: Gravimetric water content of mixture
xc supp: Proportion of plastic contact between pellets and upper wall in numerical samples
xc totp: Proportion of plastic contact in a numerical sample
xL: Volumetric proportion of large particles
xS: Volumetric proportion of small particles
xS 0: Mass proportion of powder in the sample
xS crit: Critical volumetric proportion of small particles
z: Elevation
αL: Volume fraction of large particles
αL*: Maximum volume fraction of large particles
αm: Microstructural elastic stiffness parameter
αS: Volume fraction of small particles
αS*: Maximum volume fraction of small particles
αv: Damping parameter in DEM
β: BBM parameter
βH: Model parameter describing micro-macro water transfers
βm: Microstructural elastic stiffness parameter
βMm: Coefficient describing micro-macro water transfers
βS: Model parameter
Γmax: Maximum moment applied on a particle
Γnet: Net moment applied on a particle
γ: Parameter of the model, set to 1.5 δN: Normal deflection at contact
δT: Relative tangential displacement vector
ε: Strain tensor
ϵ: Tolerance value for equilibrium in DEM
ϵ0: Parameter describing the initial diameter increment in DEM
εa: Axial strain
ϵf: Parameter describing the final diameter increment in DEM
ϵi: Parameter describing the diameter increment at calculation step i in DEM
𝜀̇: Strain rate
εr: Radial strain
εV: Volumetric strain
εV1: Pellet volumetric strain in FEM
εV2: Powder volumetric strain in FEM
εVA(e): Elastic volumetric strain associated to variation of mg
εVB(e): Elastic volumetric strain associated to variation of εV1
εVC(e): Elastic volumetric strain in pellets associated to variation of suction
εVE(e): Elastic volumetric strain associated to variation of p
εVe: Elastic volumetric strain
εVM: Macrostructural volumetric strain
εVm: Microstructural volumetric strain
εVme: Microstructural elastic volumetric strain
εVp: Plastic volumetric strain
εVpLC: Plastic volumetric strain induced by LC mechanism
εVpM: Macrostructural plastic volumetric strain
ζ: Relative permeability parameter Θ: Volumetric water content
Θr: Residual volumetric water content
Θsat: Saturated volumetric water content
κ: Unloading/reloading (elastic) stiffness parameter κeq: Equivalent dimensionless stiffness parameter
κg: Dimensionless stiffness parameter for granular assemblies
κm: Microstructure elastic stiffness parameter
κs: Elastic stiffness parameter for change in suction
λ: Virgin compression stiffness parameter
λ(s): Elastoplastic stiffness parameter for net stress change, at suction s λm: Microstructure elastoplastic stiffness parameter
λp: Plastic multiplier
λs: Elastoplastic stiffness parameter for suction increase
µ: Friction coefficient µf: Fluid dynamic viscosity
µw: Water dynamic viscosity
ν: Poisson ratio ρd: Dry density
ρd*: Average dry density of the pellet-powder mixture
ρd 0: Initial dry density
ρd 1: Pellet dry density
ρd b: Bentonite dry density
ρf: Fluid density
ρm: Mixture density
ρs: Density of solid particles
ρvap: Vapour density
ρw: Water density
σ: Total stress tensor σ(e): Total trial stress tensor
σ’: Effective stress tensor
σS: Estimated final swelling pressure
σV’: Effective vertical stress
τ: Characteristic time of water transfers τg: Tortuosity
Φ1: Pellet volume fraction
Φ1 0: Pellet initial volume fraction
Φ2: Powder volume fraction
ΦM: Macropore volume fraction
Φmat: Matrix volume fraction
ϕ: Porosity
ϕ1: Porosity of the pellet phase in FEM
ϕint: Inter-pellet porosity
χ: Bishop parameter ψg: Gravitational potential
ψm: matrix potential
ψo: Osmotic potential
ψp: Pressure potential
ψt: Total water potential
Ω: Total volume
Ω0: Total volume at initial state
Ω1: Pellet volume in FEM
Ω2: Powder volume in FEM
ΩL: Volume of large particles
Ωp: Pellet volume
ΩS: Volume of small particles
Ωs1: Volume of solid in pellets in FEM
Ωs2: Volume of solid in powder in FEM
Ωv: Void volume