HAL Id: tel-02914637
https://pastel.archives-ouvertes.fr/tel-02914637
Submitted on 12 Aug 2020HAL is a multi-disciplinary open access archive for the deposit and dissemination of sci-entific research documents, whether they are pub-lished or not. The documents may come from teaching and research institutions in France or
L’archive ouverte pluridisciplinaire HAL, est destinée au dépôt et à la diffusion de documents scientifiques de niveau recherche, publiés ou non, émanant des établissements d’enseignement et de recherche français ou étrangers, des laboratoires
To cite this version:
Hafsa Rahoui. Contribution à la compréhension de l’action des agents réducteurs de retrait dans les matériaux cimentaires : étude expérimentale et modélisation. Génie civil. Université Paris-Est, 2018. Français. �NNT : 2018PESC1166�. �tel-02914637�
THÈSE
présentée pour l’obtention du diplôme de
DOCTEUR DE
L’UNIVERSITÉ PARIS-EST
Spécialité: Génie Civil par
Hafsa RAHOUI Sujet de la thèse :
Contribution to understanding the action
of shrinkage reducing admixtures
in cementitious materials:
experiments and modeling
Thèse soutenue le 17/12/2018 devant le jury composé de :
Rapporteurs : Prof. Pietro LURA
Prof. Jason WEISS
Examinateurs : Dr. Patrick DANGLA
Prof. Ippei MARUYAMA Dr. Martin MOSQUET Dr. Matthieu VANDAMME
This work wouldn’t have seen light without the support of LafargeHolcim. I am grateful for the financial and scientific support, which allowed me to go through this journey.
I would like to thank the members of the jury Prof. Pietro Lura, Prof. Jason W. Weiss and Dr. Patrick Dangla. I am humbled by their review of the work. I sincerely thank you for our enriching exchange and constructive comments. My thoughts go for late Dr. Ellis Gartner, who was at the launching of the work and his enthusiastic contribution.
I would like to express my sincere gratitude to my supervisors: Matthieu Van-damme, Ippei Maruyama, Jean-Michel Pereira and Martin Mosquet. From the poromechanics class during the master degree to our everyday interac-tion during the PhD, Matthieu’s enthusiasm, availability and guidance were essential. The three years were stimulating and full of learning thanks to his rigor and precision. His significant counseling in poromechanical modeling helped the model see the light. I would like to thank Maruyama sensei, Ippei, who made my integration in the laboratory at Nagoya University effortless. Our discussions were motivating as he welcomed my ‘ambitious’ ideas, and was excited to new findings genuinely. I came to love experimental work, although laborious, through my several stays at the laboratory, and came to appreciate its peculiarities when it works and when it does not. His expertise in SRAs and shrinkage of cementitious materials helped guide the work in the right direction. My gratitude also goes to Jean-Michel, who directed this work, who was available through our multiple PhD meetings, providing a vision extrapolating from cementitious materials to soils. His kindness was always there when needed, during the finishing line and throughout the en-tire work. His patience during the writing and review of the work, and his pertinent questions and comments benefited greatly this study. My sincere appreciation also goes for Martin, his large expertise in admixtures helped guide the work optimally. His support during my visits to the LafargeHolcim Centre de Recherche at Lyon made it possible to conduct a significant part
adventure, made delightful by the encounter of helpful and supportive col-leagues and friends. I would like to thank my colcol-leagues at Nagoya University: Ryo Kurihara, Hiroshi Sasano, Jiri Rymes, thank you for the scientific ex-change, and the "less" scientific exchange. Kurihara san, the face who greeted me first when setting a foot at Nagoya, you were a great support both tech-nically and personally. Sasano san, my efforts to speak in Japanese and your genuine surprise was always a motivation to always keep trying. Jiri, my next door colleague and water vapor expert, thank you for the “very funny” jokes. I am also thankful for all the graduate and undergraduate students at
Maruyama labo, your help with experimental program is appreciated. どうも
ありがとうございます。 I would like to thank my colleagues at Laboratoire Navier, Zineb Abchir, Radja El Andaloussi, Youssef Abdullah, Yaghkob ike-zouhene, Abdelali Dadda, Katia Bellagh, and my office colleagues Abusalam Aili, Nam Nguia Bui, Sergio Samat, Abdessamad Akkaoui and Iliass Tahiri. Our lunch and long coffee breaks were always a delight. Merci à vous tous! Thank you for the friends who set the time to attend the defense, the classes prepas friends and the Hassania friends. Thank you to Sara Bahafid, re-search and cement has brought us together and then friendship took over, the last three years are inconceivable without our long discussions and amaze at cementitous materials. Your support always gave me courage to keep on going.
Last but not least, words are not enough to express my gratitude to my fam-ily. If it was not for your support, I couldn’t reach as I reached, encouraging me to dream big and letting me "fly" on my own. Mom, you gave us the will to aim high and the means to reach it, we are forever blessed to have you.
Cement-based materials are complex multiscale porous materials that are sensitive, among other things, to the surrounding relative humidity. The changes of the relative humidity induce a macroscopic deformation of the ma-terials. This phenomenon is referred to as drying shrinkage. Drying shrink-age of cement-based materials may lead to their cracking. Not only do these cracks impact the aesthetic aspect, they are also a source of vulnerability of structures, as the ingress of harmful substances may be enhanced, hence lead-ing to a potential weakenlead-ing of the structural performance. The addition of shrinkage reducing admixtures (SRAs) is a way to mitigate of drying shrink-age of cement-based materials, which allows to reduce the risk of cracking. Although SRAs have proven beneficial in reducing drying shrinkage, their mechanisms of action are still debated.
In this thesis, we aim at providing a better understanding of the mecha-nisms of action of SRAs, by combining a comprehensive experimental cam-paign with poromechanical modeling of drying shrinkage of cement pastes. We study the impact of one SRA (hexylene glycol) on the first drying shrink-age of thin cement paste samples and on their subsequent re-humidification, which allows investigation of the irreversibility of drying shrinkage. The per-formance of the SRA in terms of reduction of drying shrinkage and its depen-dence on the alkali content of the cement pastes and on the range of relative humidity are investigated. Two methods of drying are employed: long-term drying of samples of 3 mm thickness, and short-term drying of samples of 0.5 mm thickness. Drying shrinkage isotherms of cement pastes containing SRA show little or no irreversibility. The reduction of drying shrinkage due to the SRA is highest in the relative humidity range [33%-75%] and at low alkali content.
These measurements are complemented with microstructural characteri-zation: the phase assemblage is assessed based on X-ray diffraction (XRD) and thermogravimetric analysis (TGA) and the pore structure is analyzed with mercury intrusion porosimetry (MIP), nitrogen sorption isotherms and
of how water content and drying shrinkage evolve with relative humidity. The relationship between the amount of the various types of water present in the pore system and relative humidity is modeled based on the knowledge of the pore structure. If the pore structure is characterized by water sorp-tion measurements, we propose a model that resolves the pore water into two types, namely water adsorbed on solid surfaces and water in capillary pores. In contrast, if the pore structure is characterized by nitrogen sorp-tion measurements, we propose a model that resolves water into three types, namely water in the micropores, water adsorbed on solid surfaces, and water in capillary pores.
To model drying shrinkage, two approaches are presented. A first ap-proach consists in developing a phenomenological model enabling the pre-diction of drying shrinkage for a cement paste that contains given contents of alkali and SRA and at a given relative humidity. The second approach consists in a poromechanical model of adsorption-induced strains. The strain is modeled as resulting from capillary forces (impacted by capillary water), Bangham-type surface forces (impacted by water adsorbed on solid surfaces), and, if water is resolved into three types, the effect of the variation of the water content in the micropores.
To the light of the experimental and modeling results, the mechanisms of action of SRA on drying shrinkage are discussed. SRA is found to act on drying shrinkage by reducing the strain induced by capillary effects and the range of relative humidity over which they occur, as well as by reducing the Bangham-type strains due to adsorption on solid surfaces.
Keywords: drying shrinkage, SRA, alkali, length change isotherms, mass
Les matériaux cimentaires sont des matériaux multiéchelles sensibles aux conditions environnantes et notamment à l’humidité relative ambiante. Les variations de l’humidité relative induisent une déformation macroscopique
du matériau. Ce phénomène, dit retrait de séchage, peut induire la
fis-suration des matériaux cimentaires. Non seulement ces fissures nuisent à l’aspect esthétique, mais elles peuvent aussi fragiliser les structures en fa-cilitant leur attaque par des substances agressives. Les agents réducteurs de retrait (ARRs) ont prouvé leur efficacité pour la réduction du retrait et de la fissuration des matériaux cimentaires en résultant. Cependant, leurs mécanismes d’action sont encore le sujet de nombreuses questions. Dans ce travail, nous visons à apporter une meilleure compréhension des mécanismes d’action des ARRs, en combinant un programme expérimental exhaustif et une modélisation poromécanique du retrait de séchage des pâtes de ciment. Nous étudions l’impact d’un ARR (hexylène glycol) sur le premier retrait de séchage et sur la re-humidification des pâtes de ciments de faible épaisseur, ce qui nous permet d’étudier l’irréversibilité du retrait de séchage. La perfor-mance des ARRs en termes de réduction du retrait de séchage, sa dépendance à la teneur en alcalin et à la gamme d’humidité relative est analysée. Deux méthodes de séchage sont employées : séchage long-terme d’échantillons de 3 mm d’épaisseur, et séchage court-terme d’échantillons de 0.5 mm d’épaisseur. L’irréversibilité des isothermes de retrait de séchage des pâtes de ciment se voit considérablement réduite en présence des ARRs. La réduction de re-trait de séchage induite par l’ARR est maximale dans la gamme d’humidité relative entre 33% et 75% et pour une faible teneur en alcalins. Nous étu-dions également l’impact des ARRs sur la microstructure. L’assemblage de phase est déterminé en combinant la diffraction aux rayons X (DRX) avec l’analyse thermogravimétrique (ATG). La structure poreuse est examinée par la porosimétrie mercure, les isothermes de sorption à l’azote, et les isothermes de sorption à l’eau. L’impact de l’ARR sur la microstructure avant le séchage
pâtes de ciment en fonction de l’humidité relative, basé sur la connaissance de la structure poreuse. Si la structure poreuse est évaluée par des isother-mes de sorption à l’eau, nous proposons un modèle distinguant l’eau en deux contributions : de l’eau adsorbée sur les surfaces solides et de l’eau conden-sée dans les pores capillaires. Si la structure poreuse est évaluée par des isothermes à l’azote, nous proposons un modèle qui distingue l’eau en trois contributions : de l’eau adsorbée dans les micropores, de l’eau adsorbée sur les surfaces solides, et de l’eau condensée dans les pores capillaires. Nous élaborons ensuite deux approches pour modéliser le retrait de séchage. Une première approche consiste à développer un modèle phénoménologique per-mettant de prédire le retrait de séchage d’une pâte de ciment à une teneur en alcalins et en SRA donnée, et séchée à une humidité relative donnée. La deuxième approche consiste à élaborer un modèle poromécanique des défor-mations induites par adsorption. Nous considérons la déformation des pâtes de ciment comme le résultat de forces capillaires (impacté par l’eau capil-laire), de forces de surfaces de type Bangham (impacté par l’eau adsorbée sur les surfaces solides), et dans le cas où l’eau est répartie en trois contribu-tions, de variations de la teneur d’eau dans les micropores. A la lumière des résultats expérimentaux et de modélisation, nous identifions les mécanismes d’action des ARRs sur le retrait de séchage. L’ARR réduit notamment le retrait de séchage par deux biais : 1) en réduisant le retrait induit par les effets capillaires et la gamme d’humidité relative sur laquelle ces effets sont présents, et 2) en réduisant les déformations de type Bangham induites par adsorption sur les surfaces solides.
Mots clefs : retrait de séchage, agent réducteur de retrait ARR, alcalins,
isotherme de déformation, isotherme de variation de masse, irréversibilité, poromécanique.
Contents 9 List of Figures 15 List of Tables 35 1 Introduction 37 1.1 Context . . . 37 1.2 Research significance . . . 38 1.3 Research objectives . . . 40
1.4 Layout of the thesis . . . 41
2 State of the art 43 2.1 Microstructure of cement paste . . . 43
2.1.1 Hydration of cement . . . 43
2.1.2 Cement paste: a multiscale porous material . . . 45
2.2 Characterization of pore structure . . . 48
2.2.1 Impact of drying on pore structure characterization . . 48
2.2.2 Mercury intrusion porosimetry. . . 49
2.2.3 Gas sorption measurements . . . 51
2.3 Drying shrinkage of cementitious materials . . . 61
2.3.1 Overview . . . 61
2.3.2 Mechanisms of drying shrinkage . . . 63
2.3.3 On the irreversibility of drying shrinkage . . . 67
2.5.1 Shrinkage of cement-based materials and SRAs . . . . 76
2.5.2 Mechanisms of action of SRAs . . . 76
2.5.3 Other impacts of SRAs . . . 79
2.6 Conclusions . . . 82
3 Impact of SRA on drying shrinkage isotherms 85 3.1 Materials and methods . . . 86
3.1.1 Materials . . . 86
3.1.2 Method of preparation of samples . . . 87
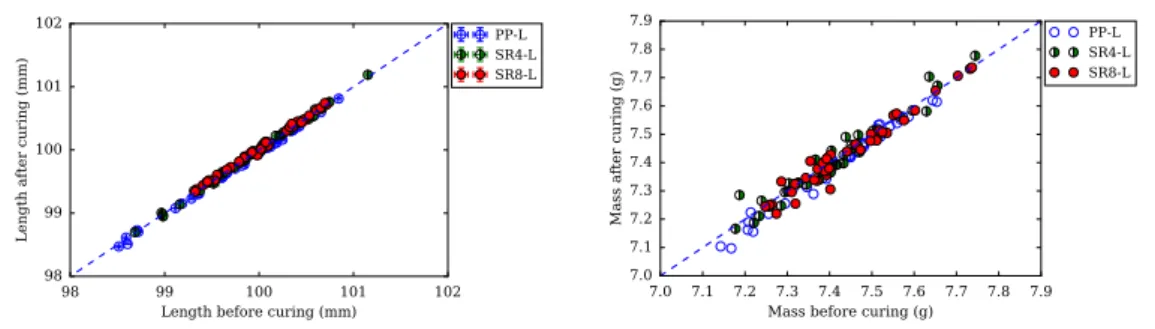
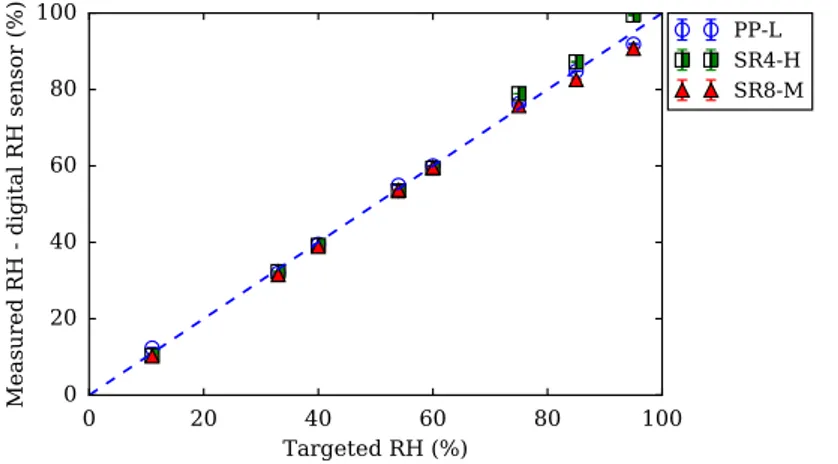
3.1.3 Methods of drying shrinkage and sorption measurements 91 3.1.4 Validation of sealed curing and of relative humidities of drying . . . 98
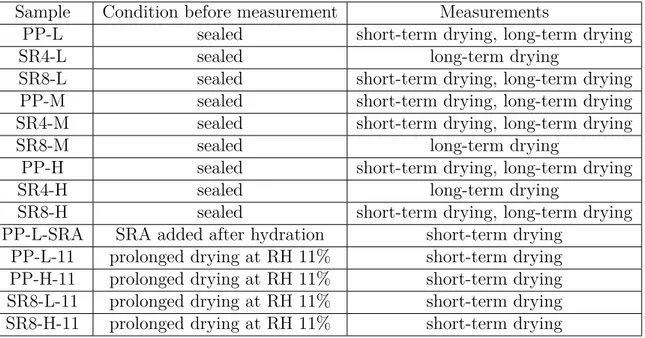
3.1.5 Summary of experimental measurements . . . 100
3.2 Long-term drying measurements . . . 101
3.2.1 Length and mass change results . . . 101
3.2.2 Discussion of impact of SRA on weight loss. . . 110
3.2.3 Discussion of impact of SRA and alkali contents on drying shrinkage . . . 111
3.3 Short-term drying measurements . . . 113
3.3.1 Short-term measurements of non-pre-dried cement pastes113 3.3.2 Short-term measurements of pre-dried cement pastes . 116 3.3.3 Analogies between prolonged drying and SRA addition 119 3.3.4 Post-hydration addition of SRA . . . 122
3.4 Lessons learned from short and long-term measurements . . . 124
3.4.1 Differences between short and long-term measurements 124 3.4.2 Irreversibility of drying shrinkage . . . 127
3.4.3 Changes of surface properties by SRA. . . 128
4 Impact of SRA on microstructure 133
4.1 Methods . . . 133
4.1.1 Methods of phase assemblage analysis. . . 134
4.1.2 Methods of pore structure analysis . . . 139
4.2 Results of impact of SRA on microstructure . . . 141
4.2.1 Impact of SRA on degree of hydration . . . 141
4.2.2 Phase assemblage of pastes. . . 146
4.2.3 Impact of SRA on stoichiometry of C-S-H . . . 146
4.2.4 Impact of SRA on TGA measurements . . . 148
4.3 Pore structure of cement pastes after curing under sealed con-ditions . . . 152
4.3.1 Impact of SRA on specific surface area . . . 152
4.3.2 Impact of SRA on pore size distribution . . . 160
4.3.3 Impact of pre-drying . . . 163
4.4 Pore structure of cement pastes after drying . . . 167
4.4.1 Pore structure evolution: investigation by nitrogen sorp-tion . . . 168
4.4.2 Pore structure evolution: investigation by water sorption169 4.4.3 Discussion on the evolution of microstructure . . . 174
4.5 Reversibility of evolution of pore structure . . . 181
4.6 Conclusions . . . 183
5 Physico-chemical characterization of SRA in cement paste 187 5.1 Context . . . 187
5.2 Materials and methods . . . 189
5.2.1 Materials . . . 189
5.2.2 Techniques for characterization of solutions. . . 189
5.2.3 Pore solution extractions . . . 190
5.2.4 Leaching experiments . . . 191
5.2.5 Summary of materials and measurements . . . 196
5.3 Results on characterization of pore solution. . . 196
5.3.1 Composition of solutions . . . 196
6.1 Inputs of model and framework . . . 209
6.1.1 Identification of types of water: model 3W and model 2W . . . 210
6.1.2 Model 3W: water in micropores during a desorption-adsorption cycle . . . 213
6.1.3 Workflow of models . . . 215
6.2 Results of modeling of water content . . . 215
6.2.1 Results of modeling of water content based on model 3W . . . 217
6.2.2 Results of modeling of water content based on model 2W . . . 218
6.3 Impact of assumptions of analysis on modeled water content . 226 6.3.1 Impact of choice of threshold radius for capillary water of model 3W . . . 226
6.3.2 Impact of evolution of pore structure on estimation of water content . . . 228
6.4 Discussion of estimated water content . . . 231
6.4.1 Comparison with resolution of water obtained from NMR231 6.4.2 Hysteretical behavior of adsorption in C-S-H and in cement paste . . . 236
6.5 Conclusions . . . 238
7 Modeling of drying-induced strain 241 7.1 Phenomenological model . . . 242
7.2 Model concept . . . 247
7.2.1 Strain induced by water in capillary pores . . . 251
7.2.2 Strain induced by water adsorbed on surfaces . . . 253
7.2.3 Strain induced by water in micropores . . . 256
7.3 Application to re-humidification . . . 260
7.3.1 Modeling strain based on model 3W . . . 260
7.3.2 Modeling strain based on model 2W . . . 266
7.4 Blind prediction of first drying shrinkage . . . 267
7.4.1 Estimation of first-drying strain based on model 3W . 270 7.4.2 Estimation of first-drying strain based on model 2W . 274 7.4.3 Discussion of modeling of strain based on model 3W and model 2W . . . 275
7.4.4 Modeling hysteresis and irreversibility. . . 279
7.5 Role of SRA in drying shrinkage reduction . . . 284
7.6 Conclusions . . . 285
8 Conclusions and perspectives 289 8.1 Conclusions . . . 289
8.2 Perspectives . . . 293
Appendices 297 A Preparation of cement pastes 299 B Drying shrinkage measurements 303 B.1 Measurements of relative humidity of samples after curing . . 303
B.2 Monitoring mass and strain on drying and re-humidification . 304 B.3 On the impact of mixing on drying shrinkage measurements . 311 C Mechanical characterization 313 C.1 Results of bending test . . . 313
C.2 Results of ultrasonic pulse velocity measurements . . . 314
D Phase assemblage 317
E Reproducibility of measurements 319
2.1 An illustration of C-S-H gel with capillary pores (marked by C) (afterPowers, 1958). . . 45
2.2 Proposed structure of C-S-H (afterFeldman and Sereda,1968). 46
2.3 Structure of LD C-S-H (left) phase based on model CMI (after
Jennings, 2000), and C-S-H schematic (right) based on model CMII (after Jennings, 2008). . . 47
2.4 Drying techniques of cement-based materials as illustrated on phase diagram of water (afterZhang and Scherer,2011). The red point represents the starting point. . . 48
2.5 An illustration of a constricted pore of radius R and of an entry radius r (left) and a non-constricted pore (right). . . . . 50
2.6 A typical nitrogen sorption isotherm (top) for a plain cement paste of this study and a typical water sorption isotherm (bot-tom). . . 52
2.7 A constricted pore where the entry size is small sufficiently for cavitation to occur on drying (on the left): on drying the pore pressure pd(r) is greater than the characteristic cavitation pres-sure pcav(Rc), and a constricted pore where a pore blocking is observed without cavitation (on the right), on drying the pore pressure pd(r) is lower than the characteristic cavitation pres-sure pcav(Rc) and greater than the pressure of equilibrium of the liquid-air interface pe(Rc) (afterRavikovitch and Neimark,
2002). Note that the absolute value of pressures is discussed here. . . 53
2.10 Possible types of t-plots: a) for a material presenting mul-tilayer adsorption with no vapor condensation, b) for a ma-terial presenting micropores filling as the line diverges below the straight line, c) for a mesoporous material with capillary condensation (after Aligizaki, 2006).. . . 60
2.11 Specific surface area of hardened cement pastes at various wa-ter to cement ratios measured with different adsorbates (afwa-ter
Aligizaki,2006 according to (Mikhail and Selim, 1966)).. . . . 61
2.12 First drying shrinkage and subsequent drying-wetting cycles of hardened cement pastes prepared at a water-to-cement ratio w/c=0.6 (after Helmuth and Turk, 1967).. . . 68
2.13 Shrinkage measurements on mortars prepared at water-to-cement ratio w/c=0.40 and sand-to-clinker ratio s/c=1.44 and dried at RH of 60% (afterBeltzung and Wittmann,2005). The measurements started after 1 week of mixing. . . 69
2.14 Drying shrinkage of cement pastes at (w+SRA)/c mass ra-tio of 0.55 dried at a RH of 60% containing potential SRAs (alcohol-ethylene oxide polymers), in terms of measured sur-face tension of aqueous SRA solution, based on data from
Maruyama et al. (2018a).. . . 78
2.15 Morphology of precipitated portlandite in (left) water without SRA and (right) in solution with SRA (afterMaruyama et al.,
2016). . . 81
3.1 Mold used for cement pastes preparations. The mold may give up to 10 samples of dimensions 300 mm×13 mm×3 mm. . . . 91
3.2 A schematic of side view (left hand) of the box used for long-drying measurements and a picture (right hand) of the box for drying (box A used for monitoring) . . . 92
3.3 A picture of an upper view of sample for short-term mea-surements (top) and of a sample for long-term meamea-surements (bottom). . . 94
3.4 Experimental set-up for short-term measurements, TGA cou-pled with RH generator (left) and TMA coucou-pled with RH gen-erator (right). . . 96
3.5 Length and mass of samples before and after curing under sealed conditions for pastes at low alkali content. . . 98
3.6 Measured relative humidity by digital sensors inserted in boxes for drying of three chosen cement pastes. . . 99
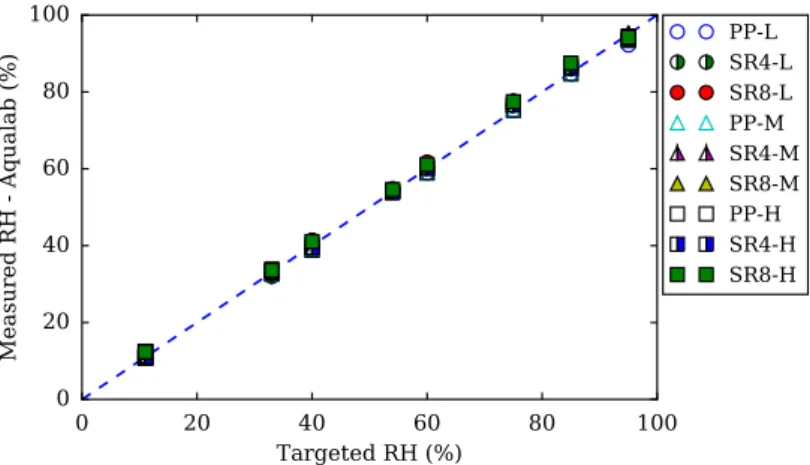
3.7 Measured relative humidity by Aqualab inserted on sampled saline solutions of boxes for drying of 9 types of cement pastes.100
3.8 Length change (left) and mass change (right) of samples at low alkali content with no SRA (PP-L) and with SRA at a content of 4% (SR4-L) and 8% (SR8-L). Results of drying (blue) and subsequent re-humidification (green) are shown. . . 102
3.9 Length change (left) and mass change (right) of samples at medium alkali content with no SRA (PP-M) and with SRA at a content of 4% (SR4-M) and 8% (SR8-M). Results of drying (blue) and subsequent re-humidification (green) are shown. . . 103
3.10 Length change (left) and mass change (right) of samples at high alkali content with no SRA (PP-H) and with SRA at a content of 4% (SR4-H) and 8% (SR8-H). Results of drying (blue) and subsequent re-humidification (green) are shown. . . 104
3.11 A schemtatic for the variations of parameter Y with regards to parameter X during a cycle of drying and re-humidification starting at the intial value A and returning to final value B after a cycle of drying and re-humidification. The left hand figure corresponds to an irreversible behavior with hysteresis (A6=B). The middle figure corresponds to a reversible (A=B) with hysteresis behavior. The right hand figure corresponds to a reversible (A=B) and without hysteresis behavior (path during drying is the same as during re-humidification. . . 105
3.13 Drying shrinkage of plain paste (PP) and paste at various SRA contents (4% content and 8% content) at low alkali content (upper figure), medium alkali content (middle figure) and high alkali content (lower figure). . . 107
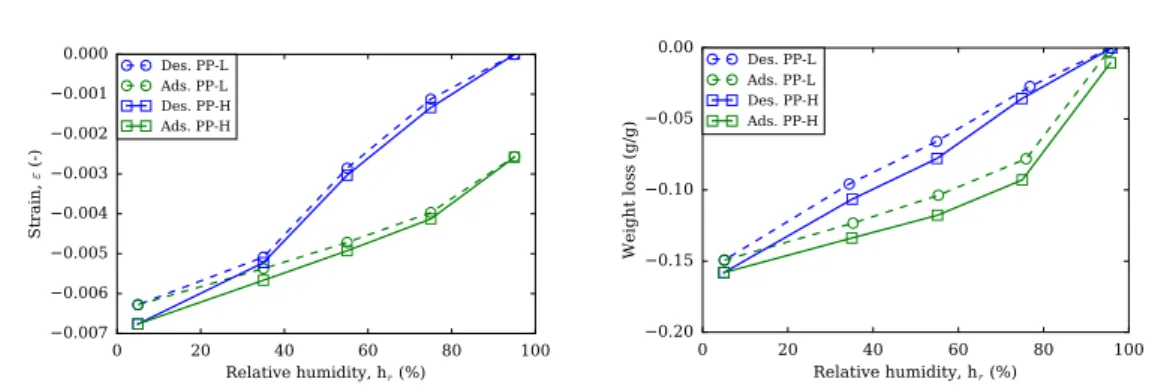
3.14 Length (left) and mass change (right) with relative humidity of plain pastes at low alkali content (PP-L), medium alkali content (PP-M) and high alkali content (PP-H). . . 108
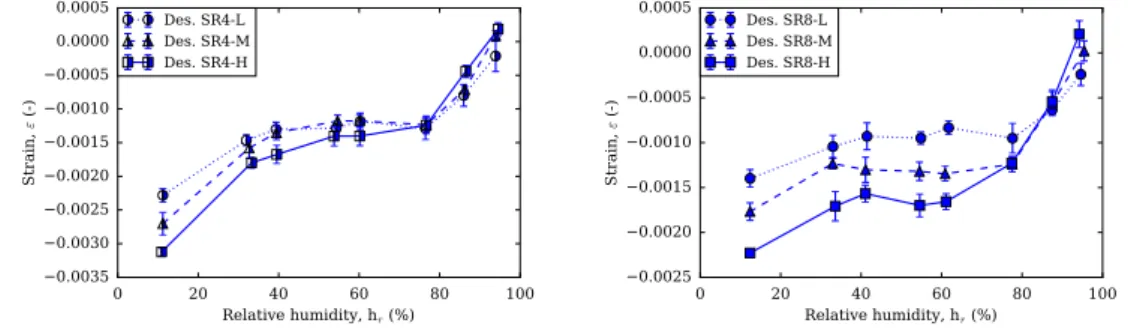
3.15 Length change of pastes containing SRA (4% content on the left, 8% content on the right) at various contents of alkali. . . 108
3.16 Strain in terms of weight loss of plain pastes for various alkali contents under drying (indicated by blue symbols) and re-humidification (indicated by green symbols) paths. Blue shade indicates linear behavior range and red shade affine behavior with an increased slope of drying shrinkage with regards to weight loss. . . 109
3.17 Strain in terms of weight loss of samples containing SRA for various alkali contents under drying (indicated by blue sym-bols) and re-humidification (indicated by green symsym-bols) path. Blue shade indicates linear behavior range, green shade a con-stant behavior and red shade an increased slope of drying shrinkage with regards to weight loss. . . 110
3.18 Short-term results of plain pastes at low alkali content (PP-L) and high alkali content (PP-H). Length change is presented on left, and mass change on right, upon desorption (blue) and adsorption (green). . . 114
3.19 Short-term results of pastes at low alkali content and 8% con-tent of SRA (SR8-L), at high alkali concon-tent and 8% concon-tent of SRA (SR8-H) and at medium alkali content and 4% content of SRA (SR4-M). . . 115
3.20 Short-term results of pastes at low alkali content plain paste (PP-L) and 8% content of SRA (SR8-L), at high alkali content plain paste (PP-H) and 8% content of SRA (SR8-H). Length change is presented on the left, and mass change on the right. 116
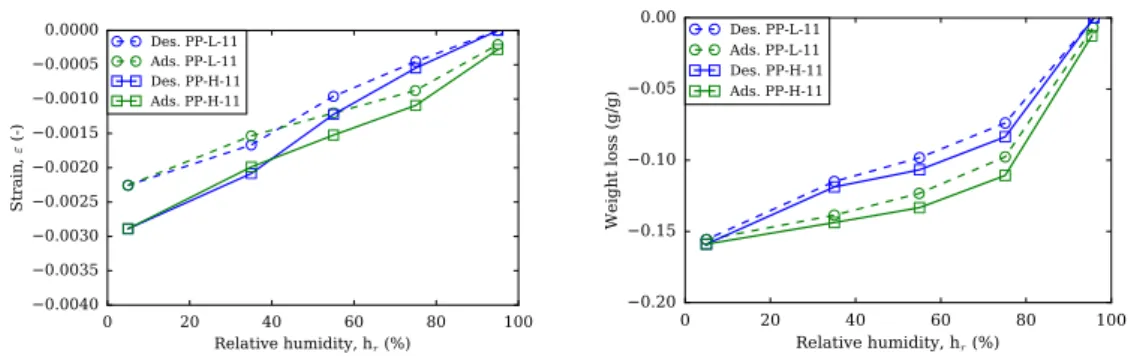
3.21 Short-term results of pre-dried plain pastes at low alkali con-tent (PP-L-11) and at high alkali concon-tent plain paste (PP-H-11).117
3.22 Short-term results of pre-dried pastes at low alkali content and 8% content of SRA (SR8-L-11), at high alkali content and 8% content of SRA (SR8-H-11) and at medium alkali content and 4% content of SRA (SR4-M-11). . . 118
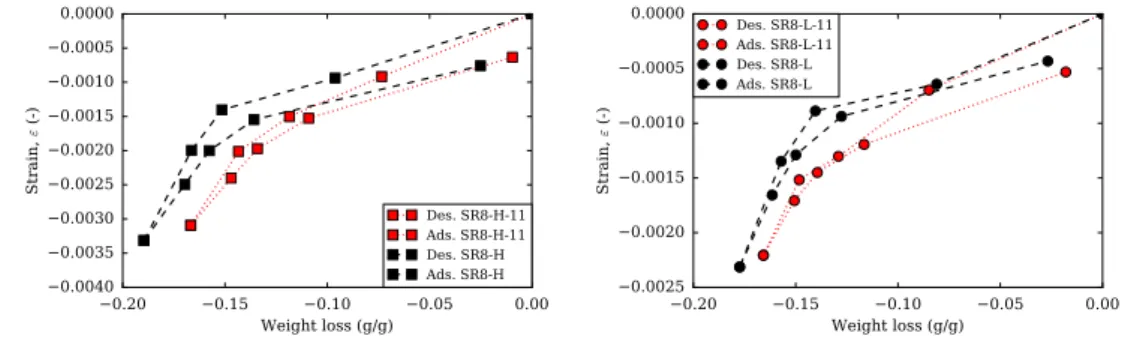
3.23 Short-term length change vs. mass change of pastes at low alkali content and 8% content of SRA (SR8-L) and pre-dried to 11% (SR8-L-11), at high alkali content and at 8% content of SRA (SR8-H) and pre-dried to 11% (SR8-H-11). . . 118
3.24 Short-term length change vs. mass change of plain pastes at low alkali content (PP-L) and pre-dried to 11% (PP-L-11), at high alkali content (PP-H) and pre-dried to 11% (PP-H-11). . 119
3.25 Short-term results of pastes at low alkali content and 8% con-tent of SRA (SR8-L) and plain paste pre-dried to 11% RH (PP-L-11). . . 120
3.26 Short-term results of pastes at high alkali content and 8% content of SRA (SR8-H) and plain paste pre-dried to 11% RH (PP-H-11).. . . 120
3.27 Short-term length change relative to 11%RH on the adsorption branch for a pre-dried plain paste at low alkali content (PP-L-11) and a paste at 8% content of SRA and low alkali content (SR8-L). . . 122
3.28 Length change (right) and mass change (left) of plain paste with added SRA after hydration (PP-L-SRA), a plain paste (PP-L) and paste with 8% content of SRA (SR8-L). All pastes are at low alkali content. . . 124
3.30 Short-term measurements and long-term measurements of paste containing 8% SRA at low alkali content (SR8-L) and high alkali content (SR8-H). Length change and mass change are computed relatively to 95% RH. . . 126
3.31 Schematic of the drying of pore on the short-term drying and long term-drying. Long term-drying allows pore structure to evolve through drying in contrast to the short-term measure-ments. . . 127
4.1 Degree of hydration of cement pastes at two ages: 3 months and 6 months, at the low alkali content, medium alkali content and high alkali content.. . . 142
4.2 Degree of hydration of cement pastes at three ages (7 days, 3 months and 6 months) in terms of alkali contents for plain pastes and pastes containing 8% SRA content. . . 142
4.3 Degree of hydration of pastes at various alkali contents, for plain pastes (hollow symbols) PP-L, PP-M and PP-H at low alkali content, medium alkali content an high alkali content respectively, and pastes at 8% SRA content (filled symbols) SR8-L, SR8-M and SR8-H at low alkali content, medium alkali content an high alkali content respectively. . . 143
4.4 Degree of hydration of the anhydrous phases and of the cement paste at low alkali content, medium alkali content and high alkali content. Results are shown for plain paste PP-(L,M,H), paste at 4% content SR4-(L,M,H) and paste at 8% content SR8-(L,M,H). . . 144
4.5 Amount of anhydrous phases, and major phases of hydrated cement pastes at an age of 3 months and 6 months. . . 147
4.6 Evaluated C/S ratio of the amorphous phase in terms of the SRA content, for the various alkali contents, based on mass balance of cement pastes.. . . 148
4.7 The molar ratio of (Fe+Al)/Ca in terms of Si/Ca based on SEM-EDS analysis of plain paste (PP-L), paste at 4% SRA content (SR4-L) and paste at 8% SRA content (SR8-L), at low alkali content.. . . 149
4.8 TGA results and DTG results for low alkali content samples for a plain paste (PP-L), paste containing 4% SRA (SR4-L) and 8% SRA (SR8-L). . . 149
4.9 TGA results and DTG results for SRA only. . . 150
4.10 Portlandite amount and calcite amount evaluated by TGA measurements for low alkali content plain paste and paste with 8% SRA content under dioxygen and nitrogen environments and under two heating rates (10◦C/min and 30 ◦C/min). . . . 152
4.11 Specific surface area evaluated by BET model applied to ni-trogen adsorption of cement pastes as a function of SRA content.153
4.12 Specific surface area evaluated by BET model applied to nitro-gen adsorption of cement pastes as a function of alkali content.154
4.13 BET constant evaluated on nitrogen adsorption of cement pastes as a function of SRA content. . . 154
4.14 Specific surface area evaluated by BET model applied to water sorption isotherms of cement pastes as a function of the SRA content. . . 155
4.15 Pore volume evaluated from water sorption isotherms at rela-tive humidity of 98% as a function of SRA content of cement pastes. . . 156
4.16 BET constant obtained from BET model applied to water sorption isotherms. . . 156
4.17 Water sorption isotherms of a zeolite and zeolite+SRA. Cred-its to Jiří Rymeš for measurements on zeolite. . . 158
MIP on cement pastes at medium alkali content prepared by solvent exchange. . . 161
4.20 Pore size distribution and cumulative porosity obtained by MIP on cement pastes at high alkali content prepared by sol-vent exchange.. . . 161
4.21 Pore size distribution and cumulative porosity obtained by MIP for plain pastes at various alkali content. Cement pastes were prepared by solvent exchane. . . 162
4.22 Pore size distribution obtained by BJH applied to nitrogen adsorption branch for paste at low alkali content prepared by vacuuming at room temperature. . . 163
4.23 Pore size distribution obtained by MIP for plain pastes at low alkali content (PP-L) and at 8% content of SRA (SR8-L) prepared by solvent exchange (SE) and vacuuming at room temperature (vac). . . 164
4.24 Pore size distribution of pastes with and without SRA at low alkali content obtained by MIP on samples prepared by vacu-uming at room temperature. . . 165
4.25 Specific surface area evaluated by BET model applied to nitro-gen adsorption isotherm using solvent exchange or vacuuming at room temperature to pre-dry the sample. . . 166
4.26 BET constant CBET of the 9 types of cement pastes for pre-drying methods of solvent exchange and vacuuming at room temperature.. . . 167
4.27 Specific surface area based on nitrogen adsorption (top) and water adsorption (bottom) of plain pastes (symbols) with low alkali content (PP-L) and high alkali content (PP-H) in terms of relative humidity at which cement pastes were dried. Dashed lines correspond to specific surface of samples after curing at sealed state. . . 170
4.28 Pore volume based on nitrogen adsorption of plain pastes (ad-sorbed volume at relative pressure of N2 of 0.97) and kink volume with low alkali content (PP-L) and high alkali con-tent (PP-H) in terms of relative humidity of drying of cement pastes. Dashed lines correspond to pore volume of samples after curing at sealed state. . . 171
4.29 Specific surface area based on nitrogen adsorption (top) and water adsorption (bottom) of SRA pastes (symbols) with low alkali content (SR8-L) and high alkali content (SR8-H) in terms of relative humidity at which cement pastes were dried. Dashed lines correspond to specific surface of samples after curing at sealed state. . . 172
4.30 Pore volume based on nitrogen adsorption of SRA pastes at low alkali content (SR8-L) and high alkali content (SR8-H) in terms of relative humidity of drying of cement pastes. Dashed lines correspond to pore volume of samples after curing at sealed state. . . 173
4.31 Volume of adsorbed amount of water obtained from water sorption isotherms (volumetric method) in terms of relative humidity of drying of cement pastes. . . 173
4.32 Volume of adsorbed amount of water obtained from water sorption isotherms (volumetric method) in terms of RH of drying, for pastes containing 8% SRA at low content of al-kali (SR8-L) and high alal-kali content (SR8-H). . . 174
4.34 Total pore volume of cement pastes measured by weighting samples that were dried at the various RH, the sample is dried at 105 ◦C and resaturated under deionized water. . . . 177 4.35 Evolution of pore volume evaluated by adsorbed volume of
nitrogen at relative pressure of 0.97 in terms of BET specific surface area evaluated from nitrogen adsorption isotherm.. . . 178
4.36 Evolution of pore volume evaluated by adsorbed volume of water at 95% RH and BET specific surface area evaluated from water adsorption isotherm. . . 178
5.1 Remaining concentration of SRA in samples in terms of mea-sured concentrations in eluates (Eberhardt, 2010). The inter-cepts for LM1 (1% content of SRA), LM2 (2% content of SRA) and LM3 (3% content of SRA) are not null and indicate the presence of an immobile fraction of SRA. . . 188
5.2 Illustrating figure for the Wilhelmy plate measurement of sur-face tension of a solution. Red arrows indicate direction along which the plate is moved during the measurements (from left to right): the plate is moved down towards the solution until contact is realized then pulled out. . . 191
5.3 Measured organic carbon in sampled solutions as a function of the contact duration (left hand) and corresponding fraction of leached SRA to the initial amount of SRA estimated from mix design (right hand) for pastes at high content of alkali, at 4% SRA content (SR4-H) and 8% content (SR8-H). Error bars estimated from the propagation of errors of measurement. 194
5.4 Summary of the materials and methods used to characterize SRA in the pore solution of cement pastes. . . 196
5.5 Measured concentrations of extracted pore solutions for ce-ment pastes at various alkali contents in terms of SRA content.197
5.6 Normalized concentrations of extracted pore solutions of alkali (potassium and sodium) in terms of SRA content. . . 199
5.7 Measured content of SRA obtained from pore solution extrac-tion in terms of the SRA content obtained from mix design. . 200
5.8 Surface tension measured by Whilmey plate method on ex-tracted pore solutions of cement pastes at the 3 contents of alkali in terms of the content of SRA. . . 200
5.9 Amount of organic carbon originating from SRA leached from the cement pastes as a function of the theoretical organic car-bon expected if no adsorption of SRA is assumed. Plotted error bars for SR8-L correspond to the maximum and mini-mum observed values on the set of 3 measurements. The inset plot is a zoom on the low region of recorded concentrations. . 202
5.10 Measured concentrations of ionic composition of solutions for leaching cycles on cement pastes at 4% content of SRA at var-ious contents of alkali. Cycle number 0 refers to the synthetic pore solution prepared for leaching experiments. . . 204
5.11 Measured concentrations of ionic composition of solutions for leaching cycles on cement pastes at 8% content of SRA at var-ious contents of alkali. Cycle number 0 refers to the synthetic pore solution prepared for leaching experiments. . . 206
6.1 Statistical thickness of the adsorbed water based on water va-por sorption isotherms compared to Badmann t-plot. . . 212
6.2 Water in micropores on first desorption (left) and adsorption (right) relatively to state at 11% relative humidity. By default, dashed lines are plotted as a visual guide, unless specified oth-erwise. . . 215
6.3 Workflow of the model 3W for the water content of cement pastes based on three types of water. . . 216
micropores to the water content for a plain paste low alkali (left) and SRA paste containing 8% SRA low alkali (right). . . 218
6.6 Estimated water content of cement pastes based on model 3W and experimental values relative to water content at 11% rela-tive humidity, when pore structure is analyzed by BJH applied to nitrogen sorption isotherms, for pastes at low alkali content.219
6.7 Estimated water content of cement pastes based on model 3W and experimental values relative to water content at 11% rela-tive humidity, when pore structure is analyzed by BJH applied to nitrogen sorption isotherms, for pastes at medium alkali content. . . 220
6.8 Estimated water content of cement pastes based on model 3W and experimental values relative to water content at 11% rela-tive humidity, when pore structure is analyzed by BJH applied to nitrogen sorption isotherms, for pastes at high alkali content.221
6.9 Predicted water content of cement pastes based on model 2W and experimental values relative to water content at 11% rel-ative humidity when microstructure is analyzed by BJH on water sorption isotherms, for pastes at low alkali content. . . . 222
6.10 Predicted water content of cement pastes based on model 2W and experimental values relative to water content at 11% rel-ative humidity when microstructure is analyzed by BJH on water sorption isotherms, for pastes at medium alkali content. 223
6.11 Predicted water content of cement pastes based on model 2W and experimental values relative to water content at 11% rel-ative humidity when microstructure is analyzed by BJH on water sorption isotherms, for pastes at high alkali content. . . 224
6.12 Difference between water content based on gravimetric mea-surements and on volumetric meamea-surements. Red symbols cor-respond to adsorption branch, and black symbols corcor-respond to first desorption. . . 225
6.13 Impact of the choice of cut size on estimations of water content for a low alkali content plain paste (PP-L) and paste contain-ing 8% SRA (SR8-L). The grayed zone corresponds to the range of RH where water is assumed adsorbed on surfaces as dictated by the characterization of pore structure by nitrogen on desorption branch. . . 227
6.14 Estimations of water content on drying based on model 3W and using as input desorption branch of nitrogen to charac-terize pore structure with two cut sizes 2.1 nm and 2.5 nm and using MIP with two cut sizes 1.6 nm and 2.1 nm. An illustration is given for plain paste at low alkali content (left) and paste containing 8% SRA at low alkali content (right). . . 228
6.15 Impact of the evolution of pore structure on estimated water content for plain pastes at low (PP-L), medium (PP-M) and high alkali content (PP-H), based on model 3W using pore structure analyzed by nitrogen sorption isotherms. . . 232
6.16 Impact of the evolution of pore structure on estimated water content for plain pastes at low (PP-L), medium (PP-M) and high alkali content (PP-H), based on model 2W using pore structure analyzed by water sorption isotherms. . . 233
6.17 Water in C-S-H (water adsorbed on surfaces and water in mi-cropores) in a desorption-adsorption cycle. Values from the literature for water in C-S-H are adapted fromGajewicz(2014) andRoosz et al.(2016). Red symbols stand for the adsorption branch and black symbols stand for the desorption branch. . . 235
6.18 Water in cement paste and origin of hysteresis at the various scales considered: capillary and gel water, water adsorbed on surfaces and water in interlayer, after Pinson et al. (2015)). . . 237
7.1 Uniaxial strain estimated using the phenomenological model in terms of the measured uniaxial strain of the 9 types of cement pastes dried on the 8 relative humidities. . . 243
7.2 Fitted uniaxial strain (denoted as "paste" fit) and measured uniaxial strain (denoted as "paste" exp.) for the cement pastes at low alkali content in terms of relative humidity. . . 244
7.3 Fitted uniaxial strain (denoted as "paste" fit) and measured uniaxial strain (denoted as "paste" exp.) for the cement pastes at medium alkali content in terms of relative humidity. . . 245
7.4 Fitted uniaxial strain (denoted as "paste" fit) and measured uniaxial strain (denoted as "paste" exp.) for the cement pastes at high alkali content in terms of relative humidity. . . 246
7.5 Uniaxial strains estimated for relative humidities larger than 54% using the phenomenological model in terms of the mea-sured uniaxial strains of the 9 types of cement pastes dried on the 8 relative humidities. . . 247
7.6 Fitted uniaxial strain (denoted as "paste" fit) and measured uniaxial strain (denoted as "paste" exp.) for the cement pastes at low alkali content, in terms of relative humidity on the restrained range [54%-95%]. . . 248
7.7 Fitted uniaxial strain (denoted as "paste" fit) and measured uniaxial strain (denoted as "paste" exp.) for the cement pastes at medium alkali content, in terms of relative humidity on the restrained range [54%-95%]. . . 249
7.8 Fitted uniaxial strain (denoted as "paste" fit) and measured uniaxial strain (denoted as "paste" exp.) for the cement pastes at high alkali content, in terms of relative humidity on the restrained range [54%-95%]. . . 250
7.9 Schematic of water in pore space and strain each type induces (based on an idea by R. Barbarulo). . . 251
7.10 Building block (left) of the geometry made of stacked cylinders (right) after (Scherer, 1986). . . 254
7.11 Strain measured in terms of content in adsorbed fluid, in case of clay-based material (left, (Carrier et al., 2013)) and coal (right, (Hol and Spiers, 2012)). . . 256
7.12 Schematic illustrating the workflow of drying shrinkage model based on consideration of three contributions to strain (model 3W): strain induced by water in capillary pores, by water ad-sorbed on surfaces and by water in micropores.. . . 258
7.13 Schematic illustrating the workflow of drying shrinkage model based on consideration of two contributions to strain (model 2W): strain induced by water in capillary pores and by water adsorbed on surfaces. . . 259
7.14 Measured and modeled strains on the re-humidification branch for pastes at low alkali content, in terms of relative humid-ity. The strain modeled with model 3W is decomposed into a strain induced by capillary effects (with no fitting parameter), a strain induced by adsorption on surfaces (with one fitting parameter λads) and a strain induced by micropores (with one fitting parameter λµ). . . 262 7.15 Measured and modeled strains on the re-humidification branch
for cement pastes at medium alkali content, in terms of rela-tive humidity. The strain modeled with model 3W is decom-posed into a strain induced by capillary effects (with no fitting parameter), a strain induced by adsorption on surfaces (with one fitting parameter λads) and a strain induced by micropores (with one fitting parameter λµ). . . 263
rameter), a strain induced by adsorption on surfaces (with one fitting parameter λads) and a strain induced by microp-ores (with one fitting parameter λµ). . . 264 7.17 Fitted factor λads of proportionality govering the strain
in-duced by adsorption on surfaces (Gibbs-Bangham model), ob-tained under the scope of model 3W based on three types of water. . . 265
7.18 Factor λads,Scherer relating the variations of surface energy to the strain induced by adsorption on surfaces (left) and ratio
λads/λads,Scherer (right) obtained under the scope of model 3W based on three types of water. . . 265
7.19 Factor of proportionality λµ for strain induced by micropores and the change of water content of micropores.. . . 266
7.20 Measured and modeled strains on the re-humidification branch, in terms of relative humidity. The strain modeled with model 2W is decomposed into a strain induced by capillary effects (with no fitting parameter) and a strain induced by adsorp-tion on surfaces (with one fitting parameter λads). . . 268 7.21 Fitted factor λads of proportionality govering the strain
in-duced by adsorption on surfaces (Gibbs-Bangham model), ob-tained under the scope of model 2W based on two types of water. . . 269
7.22 Factor λads,Scherer relating the variations of surface energy to the strain induced by adsorption on surfaces (left) and ratio
λads/λads,Scherer (right) obtained under the scope of model 2W based on two types of water. . . 269
7.23 Strain on first drying estimated with model 3W (blind predic-tion) and its decomposition into a strain induced by capillary effects, a strain induced by adsorption effects, and a strain induced by micropores, confronted to the measured length change, as a function of relative humidity for pastes at low alkali content. . . 271
7.24 Strain on first drying estimated with model 3W (blind predic-tion) and its decomposition into a strain induced by capillary effects, a strain induced by adsorption effects, and a strain induced by micropores, confronted to the measured length change, as a function of relative humidity for pastes at medium alkali content. . . 272
7.25 Strain on first drying estimated with model 3W (blind predic-tion) and its decomposition into a strain induced by capillary effects, a strain induced by adsorption effects, and a strain induced by micropores, confronted to the measured length change, as a function of relative humidity for pastes at high alkali content. . . 273
7.26 Saturation degree computed based on model 2W (i.e., when water is distinguished into water in capillary pores and water adsorbed on surfaces). The saturation degree here displays only takes into account water in capillary pores and excludes water adsorbed on exposed surfaces.. . . 275
7.27 Strain on first drying estimated with model 2W (blind predic-tion) and its decomposition into a strain induced by capillary effects and a strain induced by adsorption effects, confronted to the measured length change, as a function of relative hu-midity, for pastes at low alkali content. . . 276
7.28 Strain on first drying estimated with model 2W (blind predic-tion) and its decomposition into a strain induced by capillary effects and a strain induced by adsorption effects, confronted to the measured length change, as a function of relative hu-midity, for pastes at medium alkali content. . . 277
midity, for pastes at high alkali content. . . 278
7.30 Strain upon first drying and subsequent re-humidification, mod-eled with model 3W and measured. . . 280
7.31 Hysteresis estimated with model 3W, in terms of the measured hysteresis. . . 281
7.32 Strain upon first drying and subsequent re-humidification, mod-eled with model 2W and measured. . . 282
7.33 Hysteresis estimated with model 2W, in terms of the measured hysteresis. . . 283
A.1 Formed lumps during mixing of pastes at high alkali content and in presence of SRA. . . 300
A.2 XRD chart of the formed lumps during mixing. . . 300
B.1 Relative humidity of cement pastes just after curing (and be-fore drying) in terms of the SRA content. . . 304
B.2 Monitoring measurements of weight loss (left) and drying shrink-age (right) of cement pastes in the box A (2 specimens) for samples at low alkali content. . . 305
B.3 Monitoring measurements of weight loss (left) and drying shrink-age (right) of cement pastes in the box A (2 specimens) for samples at medium alkali content. . . 306
B.4 Monitoring measurements of weight loss (left) and drying shrink-age (right) of cement pastes in the box A (2 specimens) for samples at high alkali content. . . 307
B.5 Monitoring measurements of weight loss (left) and strain on re-humidification (right) of cement pastes in the box A (2 spec-imens) for samples at low alkali content. . . 308
B.6 Monitoring measurements of weight loss (left) and strain on re-humidification (right) of cement pastes in the box A (2 spec-imens) for samples at medium alkali content. . . 309
B.7 Monitoring measurements of weight loss (left) and strain on re-humidification (right) of cement pastes in the box A (2 spec-imens) for samples at high alkali content. . . 310
B.8 Weight loss (left) and drying shrinkage (right) in terms of rela-tive humidity for cement paste at low alkali content, prepared by the high shear mixing procedure (PP-L-rep) and the low shear mixing procedure (PP-L). . . 311
B.9 Weight loss (left) and drying shrinkage (right) in terms of rel-ative humidity for cement paste at medium alkali content with 8% SRA content, prepared by the high shear mixing procedure (SR8-M-rep) and the low shear mixing procedure (SR8-M). . . 312
C.1 Flexural strength (left) and Young’s modulus (right) of the cement pastes after the sealed curing and before the drying. . 314
C.2 The P-wave (left) and S-wave (right) velocities for cement pastes after curing for 3 months at sealed conditions and be-fore drying. . . 315
D.1 Distribution of the Si/Ca ratio at low alkali content of plain paste (PP-L), paste at 4% SRA content (SR4-L) and paste at 8% SRA content (SR8-L). . . 318
E.1 Nitrogen sorption isotherm measured on a plain paste at low alkali. 2 samples were measured . . . 320
E.2 Water sorption isotherm measured on a plain paste at low alkali. 4 samples were measured. . . 320
E.3 Mass change and strain on short-term drying in terms of time for a paste at low alkali content with 8% SRA content, 2 sam-ples were measured. . . 321
3.1 Chemical composition of the Ordinary Portland cement clinker used, in mass fraction. XRF and XRD stand for X-ray fluo-rescence and X-ray diffraction, respectively. . . 87
3.2 Properties of the studied shrinkage reducing admixture. Ref-erences correspond to (a) (Lide,2003, p=521) and (b) (Whim and Johnson,2012, p=309). . . 88
3.3 List of prepared samples. Note that s/c designates the ratio of the mass of solution (i.e., of the mix of water with the SRA) to the mass of clinker. L, M, and OPC-H designate ordinary Portland cement low in alkali content, Portland cement with medium alkali content and Portland cement with high alkali content, respectively. . . 89
3.4 Salts used and the corresponding targeted relative humidity. All the relative humidity marked with a star * are considered for the first adsorption and the second drying. . . 94
3.5 Types of samples for long-term measurements and short-term measurements.. . . 97
3.6 Measurements of drying and specifications of each measure-ments (short-term and long-term drying).. . . 100
4.1 Molar mass of phases portlandite, calcite, water and carbon dioxide. . . 138
4.2 BET specific surface area, total adsorbed volume, and BET constant CBET evaluated by water adsorption for a zeolite and {zeolite+SRA}. . . 157
4.4 Specific surface area and adsorbed volume at sealed state (cured for 3 months under sealed conditions), dried to 11% RH and re-humidified to 95% RH for plain paste low alkali content and SRA paste at 8% content of SRA and low alkali content, for nitrogen adsorbed volume evaluated at relative pressure 0.99 and for water at 95% RH. . . 182
5.1 Summary of samples for leaching experiments and parameters of the measurement. . . 193
5.2 Reported values in the literature for the surface tension mea-surement in SRA/synthetic pore solution or synthetic pore solution only. . . 201
A.1 Identified phases of the cement paste at high alkali content and 8% SRA 10 minutes after mixing.. . . 301
Introduction
1.1
Context
Concrete is the most consumed material on Earth, with a volume of 10
km3 per year (Flatt et al., 2012). This material has been around since the
Roman empire, although the raw materials of which the hydraulic binder of this era were different from the modern Portland cement as we know it
today (Hewlett, 2003). The reasons making concrete the most widely used
construction material are the availability of the raw materials and their low cost. Portland cement is made by the grinding and calcination of mix of around 80% of limestone with around 20% of clays. Concrete cost can vary
between $60 to $100 per cubic meter (Mehta and Monteiro, 2001). Our
understanding and targeted uses of concrete for housing and infrastructure
have evolved through the years (Aïtcin,2000). With the increasing appetite
to build challenging structures, concrete today is required to conform to higher standards of durability and structural performance, while meeting
environmental requirements (Aïtcin, 2000) and reducing the carbon dioxide
emissions of the cement industry (evaluated to 5–8% of all human made
emissions (Sharp et al., 2010)).
Drying shrinkage of concrete occurs due to the changes of surrounding relative humidity. When the relative humidity decreases, the material dries and consequently shrinks. This drying shrinkage, when restrained by the
strategies to minimize the drying shrinkage can prove beneficial for the overall enhancement of the performance of structures.
Facing increasing demands to make sustainable and durable concrete (Van Damme,2018), concrete is made of a mix of not only water, cement, sand and aggregates, but also includes chemical admixtures. Chemical admixtures are used to tune the performance of concrete depending on targeted properties (e.g., workability, setting time).
Among the chemical admixtures, one finds shrinkage reducing admixtures (SRAs) which come in handy to reduce drying shrinkage. These admixtures
were patented in the early 80s in Japan (Goto et al., 1985) to reduce drying
shrinkage of cement-based materials. SRAs have proven efficient in reducing drying shrinkage of cement-based materials, and were employed in
infrastruc-tures (e.g.,Nair et al.(2016) for bridges). The SRAs are typically at a liquid
state at ambient temperature, and are usually added to the concrete mix by replacing the equivalent amount of water by SRA. These SRAs are usually composed of one or a mixture of non-ionic surfactants, and possibly other components (e.g., dispersing agents, accelerators or air entrainers) (Eber-hardt, 2010). The non-ionic surfactants may be composed of monoalcohols, glycols, alkylether oxyalkylene glycols or polymeric surfactants (Eberhardt, 2010).
1.2
Research significance
Although SRAs are efficient in reducing drying shrinkage, their mechanisms
of action are not fully understood. Industrial suppliers (e.g., Sika (2012))
and part of the research community (e.g., Ai and Young (1997)) state that
these admixtures act on drying shrinkage by reducing the surface tension of pore solution of cement-based materials, which would translate into a reduction of capillary effects and thus into a reduction of the total drying
shrinkage. However, this mechanism alone does not justify the need for high dosage (industrial suppliers recommend 1% to 2% in mass of cement) to reach optimal reduction of drying shrinkage. Further, the secondary effects of these admixtures on other properties of cement-based materials are not comprehensively stated. In fact SRAs are reported to impact the
mechan-ical properties (e.g., Shah et al. (1992); Maltese et al. (2005)), the degree
of hydration (e.g., Bentz (2006); Sant et al. (2006)), the microstructure of
cement pastes (e.g., Saliba et al. (2011); Eberhardt (2010)), and the
trans-port properties of the cement-based materials (Bentz et al.,2001;Sant et al.,
2010; Pour-ghaz et al., 2010). Facing this incomplete image on the effects of SRAs, the high recommended dosage, their cost and availability, and the potential issues related to the low saturation vapor pressure/low flamming
point of some SRAs (Eberhardt, 2010) and the potential impact on the air
voids, their practical use in construction is refrained.
Providing a clear understanding of the mechanisms of action of SRAs re-quires understanding the physical origins of drying shrinkage of cement-based materials. Although several workers studied drying shrinkage, no consensus is drawn with regards to the physical processes that intervene and dominate when the material is dried at various ranges of relative humidity. Among
others, Kovler and Zhutovsky (2006), Scherer (2015) and Ye and Radlińska
(2016) presented an overview on drying shrinkage. Drying shrinkage is usu-ally attributed to capillary pressure, adsorption-induced stress and disjoining pressure effects. Furthermore, the microstructure of cement paste evolves through drying, during which the surface area and the pore volume undergo
dramatic changes (e.g., Parrott et al. (1980); Maruyama et al. (2014)). In
our attempt to better understand drying shrinkage, we are confronted to various challenges: the material presents a wide pore size distribution and a complex morphology, several potential physical origins for drying shrinkage are proposed, and the potential interaction of the chemical admixtures with the cement hydrates is poorly understood.
The industry aims at minimizing the amount of SRA it adds to the mix, while guaranteeing its efficiency in reducing drying shrinkage. To help this optimization, a model of how the SRA reduces shrinkage would be useful.
1.3
Research objectives
In this work we aim at identifying the mechanisms of action of SRA on drying shrinkage of cement pastes and how its efficiency is impacted by the alkali content, through a thorough experimental campaign and subsequent modeling.
Experimentally, we aim at:
• Evaluating the impact of SRA and alkali on drying of cement pastes in terms of length change and mass change, by means of long-term drying and short-term drying.
• Assessing the irreversibility of drying shrinkage of cement pastes at various contents of SRA and of alkali by means of length change mea-surements, upon drying and subsequent re-humidification.
• Investigating the impact of SRA and alkali on the hydration of cement pastes.
• Evaluating the impact of SRA and alkali on the pore structure of ce-ment pastes before drying.
• Examining the evolution of pore structure of cement pastes with various contents in SRA and in alkali upon a long drying.
• Investigation of the potential interaction of SRA with cement hydrates. The results of this comprehensive experimental campaign on cement pastes at various SRA and alkali content will serve as a database for the modeling of both water content and length change of cement pastes upon variations of relative humidity. For what concerns this modeling, we aim at:
• Providing a model usable by the cement and concrete industry to pre-dict how much SRA needs to be added to reach a given shrinkage reduction, depending on the environmental conditions (i.e., relative humidity).
• Providing a model that separates water content of cement paste into various types (water in capillary pores, water adsorbed on surfaces and water in micropores when necessary), where each type contributes to the strain of cement paste.
• Through a combined discussion of model and experimental results, dis-cuss the mechanism (or mechanisms) through which the SRA reduces drying shrinkage.
1.4
Layout of the thesis
The manuscript is organized into a succession of 8 chapters, as follows: • Chapter 2 is a review of the state of the art on drying shrinkage of
cement-based materials and on shrinkage reducing admixtures. In this chapter, we also introduce the concepts that will be used in the follow-ing chapters, with regards to the methods for the experimental cam-paign and to the modeling of drying shrinkage of cement pastes. • Chapter 3 presents the results of the experimental campaign dedicated
to the measurement of drying isotherms of cement pastes at various contents in SRA and in alkali. The drying of cement pastes is conducted based on two methods: long drying and short drying. The impact of SRA on drying shrinkage is examined, and its ability to reduce drying shrinkage is investigated depending on the considered mix design (i.e., content of SRA and content of alkali) and on the range of relative humidity.
• Chapter 4 is devoted to the characterization of microstructure of the cement pastes already considered, before the long drying and after the
• Chapter 5 describes the characterization of the interactions between SRA and cement paste by means of leaching experiments and pore solution extractions.
• Chapter 6 deals with a model for predicting the adsorption isotherm (i.e., the relation between water content and relative humidity), based on the knowledge of the pore structure. The water is separated into 3 types of water (i.e., water in micropores, water adsorbed on surfaces and water in capillary pores) or 2 types of water (i.e., water adsorbed on surfaces and water in capillary pores), depending on how the mi-crostructure is characterized (i.e., by water or nitrogen adsorption). Identification and quantification of the various types of water will be used as an input to the drying shrinkage model in the subsequent chap-ter.
• Chapter 7 focuses on a modeling of drying of cement pastes that contain various contents in alkali and in SRA. Both a phenomenological and a physics-based model are proposed. The physics-based model is derived to the light of how water was modeled in the previous chapter: strains induced by water in micropores, water adsorbed on solid surfaces, and water in capillary pores are all taken into account.
• Chapter 8 summarizes the conclusions of the work and presents per-spectives for future research.
State of the art
We present in this chapter an overview of cement-based materials. We in-troduce first the microstructure of cement pastes. The hydration of cement and the resulting pore structure are presented, to the light of the commonly adopted models for the microstructure of C-S-H, the main hydrate of cement. Then the experimental techniques to characterize the pore structure that will be employed in this work are introduced. A phenomenological review of drying shrinkage is presented. The physical origins of drying shrinkage are detailed, along with the major phenomenological features of drying shrinkage of cement-based materials, among which the irreversibility of the first drying shrinkage. The modeling approaches for drying shrinkage are then reviewed. Finally, we review the proposed mechanisms of action of shrinkage reducing admixtures as well as the experimental observations regarding their impact on the properties of cement-based materials.
2.1
Microstructure of cement paste
2.1.1
Hydration of cement
Clinker is a hydraulic binder, which reacts with water through a process of dissolution-precipitation to form a cement paste. The cement paste repre-sents the "glue" binding aggregates to make concrete. Portland cement is
(Mehta and Monteiro, 2001). Other minor phases can also be present such
as gypsum (CSH2) that regulates the hydration kinetics. Hydration of
sili-cate phases (C3S and C2S) produces C-S-H and calcium hydroxide CH (also
referred to as portlandite). The hydration reactions of silicate phases occur as follows:
C3S + (3 − x + y)H → CxSHy+ (3 − x)CH (2.1)
C2S + (2 − x + y)H → CxSHy+ (2 − x)CH (2.2)
The parameters x and y refer to C/S and H/S molar ratio of C-S-H, because C-S-H stoichiometry is poorly defined and depends strongly, among others, on the hydration conditions (pressure, temperature, water-to-cement mass ratio w/c) and drying history. C-S-H gel occupies 50 to 60% in volume of the solids of hydrated cement paste and portlandite occupies 20 to 25% in
volume of the solids of hydrated cement paste (Mehta and Monteiro, 2001).
The hydration of aluminate phases depends on the presence of sulfates.
In the absence of sulfates, C3A reacts as follows (Gartner et al., 2001):
2C3A + 27H → C4AH19+ C2AH8 → 2C3AH6 (2.3)
The aluminate first reacts in presence of gypsum to produce ettringite
(AFt) C6AS3H32. Once sulfate is depleted, the reaction continues to form
monosulfoaluminate (AFm) C4ASH12, following (Gartner et al., 2001):
C3A + 3CSH2+ 26H → C6AS3H32 (2.4)
2C3A + C6AS3H32+ 4H → 3C4ASH12 (2.5)
1Cement chemistry nomenclature is adopted: C stands for CaO, S stands for SiO
2, A
Figure 2.1: An illustration of C-S-H gel with capillary pores (marked by C)
(after Powers,1958).
The hydration reaction of C4AF is similar to that of C3A (Gartner et al.,
2001). In the absence of gypsum, C2AH8 and C4(A,F)H19 form, and produce
C3(A,F)H6. In the presence of gypsum, the hydration of C4AF produces AFt
with iron substitution, that converts into AFm form.
2.1.2
Cement paste: a multiscale porous material
In this section we review some of the models of the microstructure of C-S-H widely reported in the literature.
Powers (1958) established the first model of microstructure of the C-S-H gel. His work proposed that cement paste is composed of a cement gel, and spaces between those particles. The cement gel is made of fibrous particles with straight edges. Although highly disordered, the C-S-H was approximated by tobermorite crystal. The spaces between the gel particles are identified as capillary pores, and the interstices inside them (i.e., inside the gel particles) are identified as gel pores. An illustration of the proposed
model can be found in figure 2.1.
Feldman and Sereda (1968) proposed a model of hydrated cement pastes based on length change and sorption measurements, and supported by me-chanical characterization. The structure of C-S-H is considered to be made
Figure 2.2: Proposed structure of C-S-H (after Feldman and Sereda,1968). of a layered and highly disordered structure. Water is present between the layers as structural water and chemical water. The removal of this water is considered to be at the origin of the irreversibility of drying shrinkage
(detailed in section 2.3.3) and of the sorption isotherms, and explains the
changes in mechanical properties observed with relative humidity (RH). An
illustration of the proposed model can be found in figure2.2.
Later, Jennings (2000) proposed a model, referred to as CMI, with the
aim of providing not only a qualitative description, but also a quantitative one, reconciling the disparities of values of specific surface area (SSA) and density of C-S-H reported in the literature. The model is based on a basic building block that assembles into a globule. The globules aggregate into a loose packing forming the low density C-S-H (LD C-S-H) with a porosity of 28% and into a dense packing forming the high density C-S-H (HD C-S-H) with a porosity of 13%. These porosities are related to the spaces between
the globules but do not include the pore space inside the gobules. Tennis and
Jennings (2000) quantify the volume fractions of LD C-S-H and HD C-S-H versus the w/c ratio and the degree of hydration.
Jennings(2008) later proposed a refinement CMII of his CMI model (Jen-nings, 2000), where focus was on smallest gel pores, and attempted to link the microstructure to the behavior observed at macroscopic level in drying experiments. The model lies on the continuity of the model CMI, and sheds
Figure 2.3: Structure of LD C-S-H (left) phase based on model CMI (after Jennings, 2000), and C-S-H schematic (right) based on model CMII (after Jennings,2008).
light on LD C-S-H. C-S-H is considered of granular or particulate nature. C-S-H particles are viewed as platelets with layered structure, and in which porosity is identified at various scales. In the C-S-H globule (particle), water can be present at two locations, in interlayer space and in intraglobular pores (IGP) of size lower than 1 nm. The spaces between globules, which are part of gel water space, are interglobular pores. The gel pore space is further differentiated into small gel pores (SGP) of size between 1 nm and 3 nm and large gel pores (LGP) of size between 3 nm and 12 nm, as illustrated in
fig-ure 2.3. The gel pore space consists of both intraglobular and interglobular
pores.
Recently,Gartner et al.(2017) attempted to elucidate the structure of
C-S-H, as some questions remained with the previous models. A major question that the authors address is why the C-S-H incorporates a large amount of gel water. They attempt to establish a model of the structure of C-S-H from a chemical point of view. The C-S-H is seen here as made initially from single sheets with adsorbed calcium cations, the sheets stacking upon each other with incorporated calcium cations and their hydration shells agglomerate, forming the C-S-H gel.
Figure 2.4: Drying techniques of cement-based materials as illustrated on
phase diagram of water (after Zhang and Scherer, 2011). The red point
represents the starting point.
2.2
Characterization of pore structure
In this section we present the experimental techniques for the characterization of pore structure of cement pastes, that are used in this work, namely mer-cury intrusion porosimetry, gas sorption measurements, and the pre-drying techniques required prior to these measurements. For each technique, the principle of the measurement is introduced as well as the information that can be retrieved from it.
2.2.1
Impact of drying on pore structure
characteriza-tion
The most commonly used techniques for pore structure characterization (eg., MIP, gas sorption) of cement pastes require drying of the sample prior to mea-surements. Drying conducted prior to measurements alters the pore struc-ture. A multitude of techniques are used for drying cementitious materials, such as oven drying, vacuum drying, freeze drying, solvent exchange and
re-cently also supercritical drying (Zhang and Scherer, 2017) as illustrated in
figure2.4.